Evolve Benchmark Exploration
Mobile gaming benchmarks tell us more than if it's a good "do you have any games on your phone" device. This article takes a look at Evolve, which is a game rendering benchmark that may allow us to more comprehensively measure phone performance.

Mobile gaming benchmarks tell us more than if it's a good "do you have any games on your phone" device.
The {{tooltip: these will be used interchangeably throughout this article}}phone/mobile{{/tooltip}} gaming market is generally seen as casual and insignificant in North America, but I think some people would be surprised to hear that the mobile versions of games like PUBG, Fortnite, and Call of Duty have tens of millions of daily active users. The processing power of these small devices hasn't reached the plateau and marginal gains of desktops, so increases in performance or technologies can make large differences.
Most North American users think their phone is good enough for regular use and are more interested in the quality of the photo processing or how smooth the animations will be after four years of software updates. However, it's difficult to put a number on how a device 'feels', or directly compare the image processing time between different cameras and photo processing methods.
The qualitative value of the device is explored in ShortCircuit and LinusTechTips videos; Labs focuses on tests and methods that provide reliable, repeatable, and relevant numbers to inform users of all types. We've recently been conducting and evaluating the AnTuTu benchmark for Android devices, and we've now conducted some testing of the Evolve Benchmark that we're going to share.
Evolve
We currently conduct Geekbench 6 CPU and 3DMark benchmarks on the mobile devices that we receive for testing. These are known and trusted tests in the benchmarking space, but the highly optimized nature of mobile computing can mean that performance is reliant on the implementation of key APIs and technologies. Increasing the variety and coverage of benchmarks boosts our ability to find strengths and weaknesses of devices that users may experience in regular use.

Evolve is a game rendering benchmark from Traverse Research BV, designed for desktops and mobile systems. As their website and documentation explain, Traverse Research is a group with experience in game development, and they've created this benchmark with a focus on implementing the latest rendering technologies, evolving to new technologies.
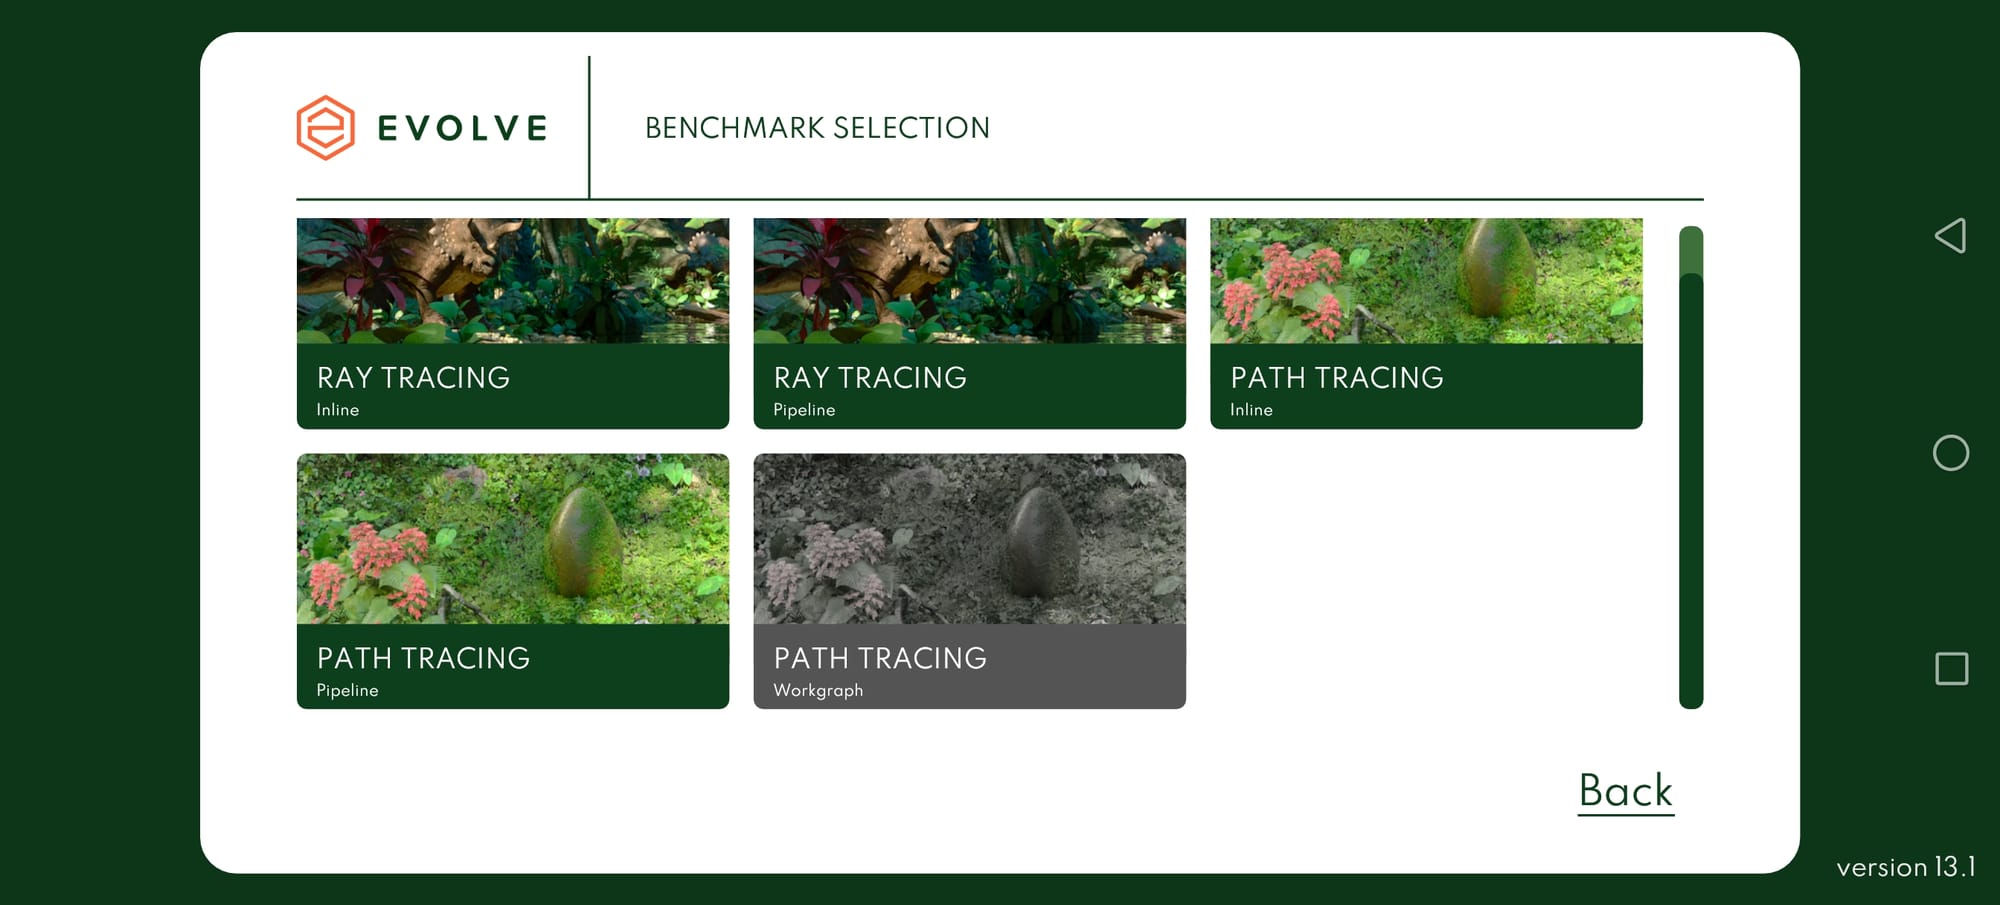
The mobile app offers a selection of five benchmarks as shown below, we have focused on running the "Ray Tracing - Inline" benchmark in our initial testing. The benchmarks available on each device can vary depending on the supported frameworks and technologies.
Testing
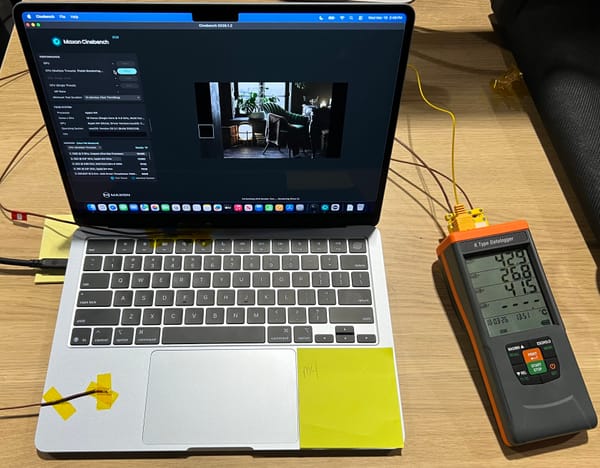
We used our standard mobile benchmark procedure, conducting three test runs with at least 10 minutes between each run to allow the device to cool back down to 'room temperature'. We also turn off all dynamic or adaptive features that may introduce variance. This includes Bluetooth, NFC, background app refresh, and many more depending on the features of the device.
Most mobile benchmarks are relatively consistent within a range of around 5%, but this procedure can still result in some outliers so we sometimes conduct up to three more runs to achieve consistent results.
Devices
The benchmark is currently only available on Android, so we conducted the test on five devices representing a variety of capabilities.
- REDMAGIC 11 Pro
- OnePlus 15
- motorola razr ultra (2025)
- Nothing Phone (3)
- Samsung Galaxy S25 Edge
We also tried to run the app and benchmarks on a Google Pixel 10 Pro XL, but the app would only launch to a green screen.
Mode
There is a 'Custom' mode to the benchmark that includes a handful of options, but we conducted the "Official" version for consistency. All tests were conducted under version 13.1.
Evolve Results
The table below shows the three runs of the inline raytracing benchmark that we ran on all of the devices, including averages. There was only a single score that we would consider an 'outlier', highlighted in the table.
| Test | Score | Run | REDMAGIC 11 Pro | OnePlus 15 | motorola razr ultra (2025) | Nothing Phone (3) | Samsung Galaxy S25 Edge |
|
Evolve,
Ray Tracing,
Inline
|
Acceleration Structure
|
1 | 11566 | 14734 | 13913 | 11715 | 14149 |
| 2 | 11394 | 14523 | 13776 | 11705 | 14232 | ||
| 3 | 11614 | 14451 | 13697 | 11730 | 14155 | ||
| Avg | 11525 | 14569 | 13795 | 11717 | 14179 | ||
|
Rasterization
|
1 | 4561 | 6068 | 2746 | 1810 | 2967 | |
| 2 | 4555 | 6014 | 2693 | 1811 | 2964 | ||
| 3 | 4555 | 6016 | 2673 | 1809 | 2976 | ||
| Avg | 4557 | 6033 | 2704 | 1810 | 2969 | ||
|
Ray Tracing
|
1 | 20739 | 27763 | 16262 | 11158 | 17376 | |
| 2 | 20766 | 25784 | 15996 | 11174 | 17228 | ||
| 3 | 20772 | 25674 | 15898 | 11146 | 17380 | ||
| Avg | 20759 | 26407 | 16052 | 11159 | 17328 | ||
|
Compute
|
1 | 6803 | 9096 | 6756 | 4723 | 7236 | |
| 2 | 6803 | 9017 | 6637 | 4720 | 7219 | ||
| 3 | 6802 | 9017 | 6586 | 4724 | 7260 | ||
| Avg | 6803 | 9043 | 6660 | 4722 | 7238 | ||
|
Driver
|
1 | 8409 | 11399 | 7517 | 5725 | 8079 | |
| 2 | 8401 | 11114 | 7435 | 5736 | 8066 | ||
| 3 | 8424 | 11142 | 7663 | 5729 | 8095 | ||
| Avg | 8411 | 11218 | 7538 | 5730 | 8080 |
The REDMAGIC 11 Pro was then used to conduct a series of tests at various times over a few days, under similar conditions. The table below shows the results, including the initial three results shown above.
| Ray Tracing Benchmark - REDMAGIC 11 Pro | ||||||
| Run | Version | Acceleration Structure | Rasterization | Ray Tracing | Compute | Driver |
| 1 | Inline | 11566 | 4561 | 20739 | 6803 | 8409 |
| 2 | Inline | 11614 | 4555 | 20772 | 6802 | 8424 |
| 3 | Inline | 11396 | 4555 | 20752 | 6801 | 8401 |
| 4 | Inline | 11394 | 4550 | 20766 | 6901 | 8401 |
| 5 | Inline | 11513 | 4554 | 20950 | 6794 | 8428 |
| 6 | Inline | 11430 | 4552 | 20812 | 6797 | 8397 |
| 7 | Inline | 11539 | 4556 | 20843 | 6800 | 8417 |
| 8 | Pipeline | 11553 | 4553 | 20756 | 6802 | 9810 |
| 9 | Pipeline | 11440 | 4550 | 20955 | 6791 | 9795 |
| 10 | Pipeline | 11440 | 4550 | 20955 | 6791 | 9795 |
| 11 | Pipeline | 11551 | 4553 | 20814 | 6796 | 9816 |
| 12 | Pipeline | 11476 | 4554 | 20765 | 6805 | 9804 |
| 13 | Pipeline | 11476 | 4554 | 20765 | 6805 | 9804 |
| 14 | Pipeline | 11381 | 4555 | 20831 | 6801 | 9805 |
| 15 | Pipeline | 11495 | 4557 | 20814 | 6798 | 9822 |
Note that the final eight tests were conducted with the pipeline raytracing benchmark. In this version of the benchmark, the scores for all categories except for "Driver" are directly comparable.
Comparative Results
We see from the tests above that these benchmarks are Reliable and Repeatable, but the third 'R' that artificial benchmarks can struggle to prove is Recycle Relevance. We can optimize our benchmarks for the ultimate repeatability, but if the results are completely disconnected from the performance when playing games or processing photos, then we're just wasting energy.
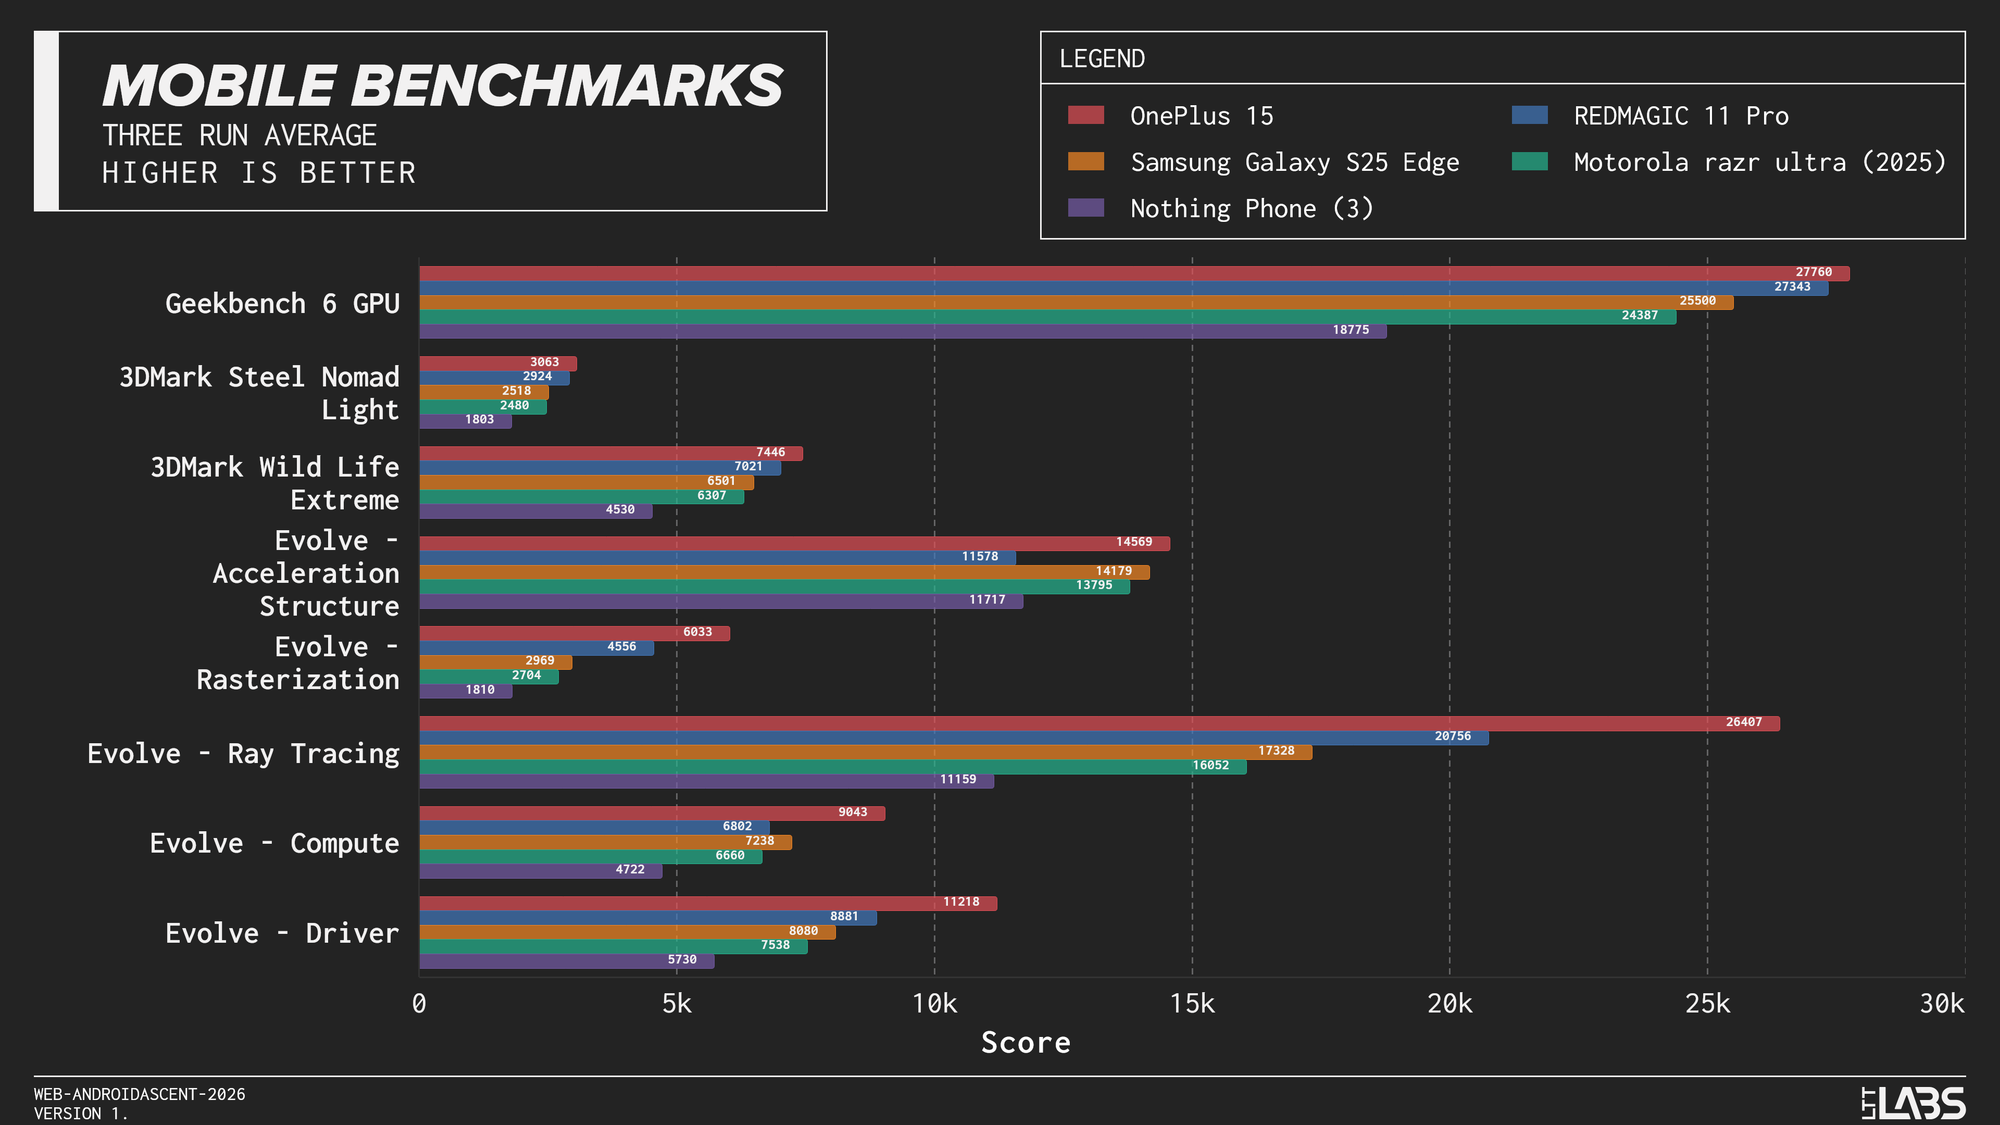
Alongside the Evolve benchmark, we also conducted runs of Geekbench 6 GPU, and 3DMark Steel Nomad Light and Wild Life Extreme. Below is an extremely dense graph with average scores of the devices in all tests, including the five scores from Evolve.
While there are certainly trends with the more and less powerful devices, there are also scores and benchmarks that don't follow the same trend. Devices can be far ahead in some aspects of a benchmark, but be comparable for other aspects. This highlights the importance of a broad spread of benchmarks.
Unfortunately, the relevance of a benchmark is difficult to prove in a week, so we'll continue conducting this benchmark in our projects going forward and it will likely appear when it gives interesting or differing results from our existing benchmarks. Likely eventually appearing alongside the other benchmark results to give a more complete picture of device performance.