MacBook Neo and M5 MacBook Thermal Testing
While we’ve had many MacBooks around for the testing of the MacBook Neo, MacBook Air M5, and MacBook Pro M5 Pro, we’ve done some exploration of surface temperature measurement.
While phones, laptops, and handhelds are usually cool to the touch when idle, many consumer devices have enough computational power to achieve high temperatures. These peaks are tempered by safety standards like IEC 62368-1 which place limits on maximum surface temperatures of consumer devices.
We've been 'tipped off' by people in the laptop industry that not all devices are playing by the rules when switched into their maximum power modes. We test laptop power and thermals while testing, but we don’t yet have a standard procedure to characterize the surface temperatures of each device. We know how to place a thermocouple or read a temperature log, but it requires more consideration if we’d like to turn it into a procedure or gather consistent data.
So while we’ve had many MacBooks around for the testing of the MacBook Neo, MacBook Air M5, and MacBook Pro M5 Pro, we’ve done some exploration of surface temperature measurement.
ShortCircuit video of the MacBook Neo with LTT Labs results.

While this article includes some interesting results, it doesn't present conclusive testing on the temperature of these laptops. It’s a test to ‘learn by doing’, and gather some results.
Test Setup
Devices Under Test
We set up the MacBooks according to our standard procedure mostly choosing defaults, except where we disable features like cloud syncing that could {{tooltip: 'randomly'}}periodically{{/tooltip}} load the system with an update or upload. We also configured the laptops in the "Automatic" power/battery mode of macOS, and set the display brightness to roughly 60%, keeping the devices plugged in and at full charge for the duration of the tests.
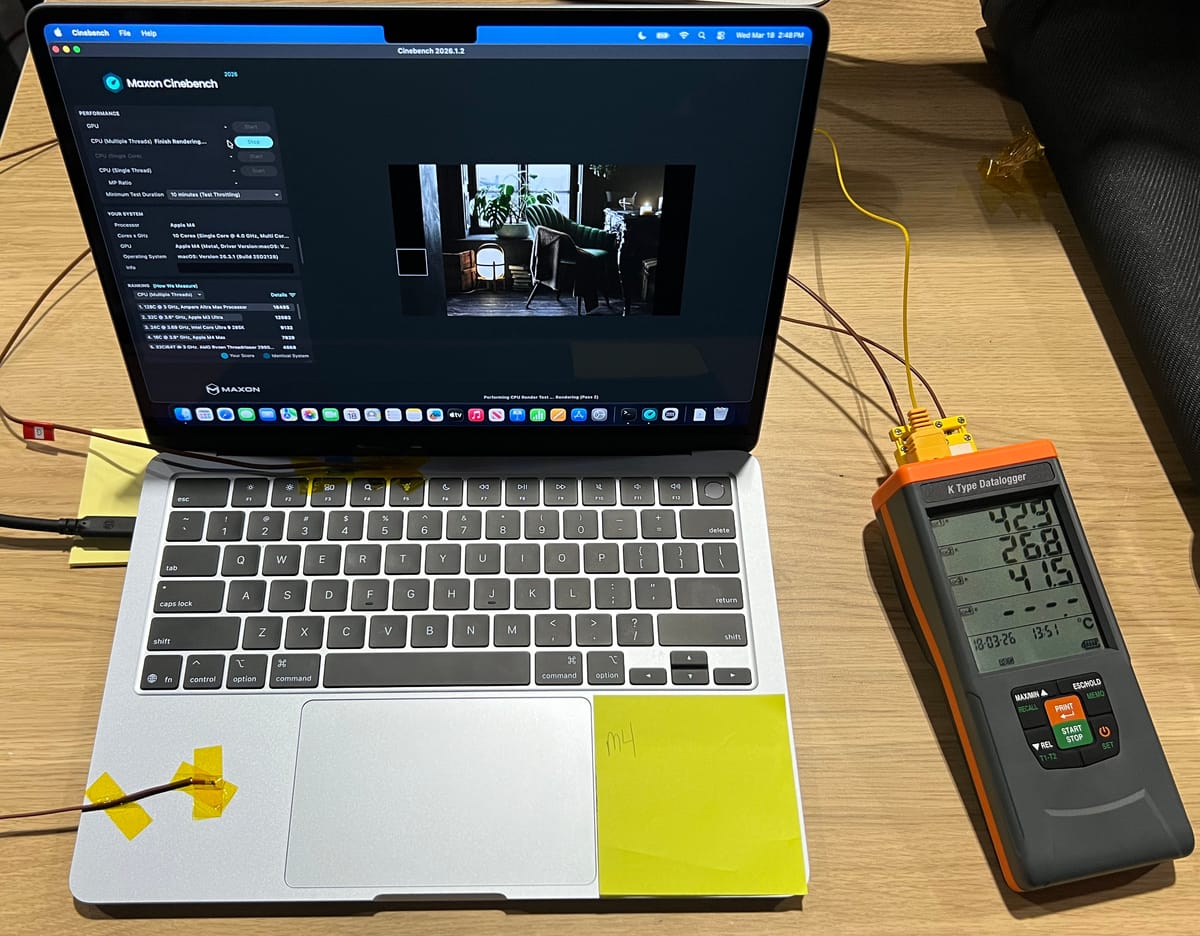
We used Cinebench 2026 to generate the {{tooltip: and heat}}load{{/tooltip}}, conducting two 10 minute CPU multi-threaded runs in a row, then letting the laptop sit idle for approximately 10 more minutes. The benchmark duration differs slightly between devices, but the endpoint of the benchmarks is clear in the power and temperature results. We used the macOS powermetrics tool to gather CPU and GPU power at 1 Hz.
Devices were tested at the 'ambient temperature' of our workspace, approximately 20°C.
MUT(MacBooks Under Test)
- MacBook Neo A18 Pro (6c CPU, 5c GPU)
- MacBook Air M1 (8c CPU, 7c GPU)
- MacBook Air M4 (10c CPU, 8c GPU)
- MacBook Air M5 (10c CPU, 8c GPU)
- MacBook Pro M5 (10c CPU, 10c GPU)
- MacBook Pro M5 Pro (15c CPU, 16c GPU)
Temperature Measurement
We used a FLIR T540 to capture images of the laptops under load. This allows us to identify hotspots and perform some approximate temperature measurements.
A four channel Danoplus Thermocouple Logger was used to measure K-type thermocouples at 1 Hz on the left palm rest of the laptop, as well as the top and bottom of the case, just above the keyboard.

Temperature measurement is tricky as it often isn't as precise as measuring a distance or voltage. The FLIR T540 has a rated accuracy of +/- 2°C or +/- 2% of the reading.
Thermocouples can be more consistent in some cases, but they have a similar accuracy rating, and the method of securing and thermally bonding them to the surface can also have a large effect. The goal is for the very tip of the thermocouple junction to be in direct contact with the surface. A gap between the junction and the surface can have large effects on the temperature reading.
Ideally cyanoacrylate glue(super glue) is used, but it often damages the surface so in this case we used Kapton tape. That is likely the method that we'll have to 'stick to' as the devices also have to remain presentable.
Results
FLIR Images
Below is a collection of FLIR images from each of the devices while they were undergoing the test. They were taken near the end of the second Cinebench 2026 run, when the devices were up to temperature.
While the reticle is not pointed at the point of maximum temperature for each device, it does show the usefulness of the FLIR. It is able to take readings of locations where thermocouple contact can be unreliable, like between keys on a keyboard.
It is interesting to see the effect of the single cooling fan of the M5 (non-Pro) MacBook Pro compared to the two fans of the M5 Pro equipped MacBook Pro.(final two images)
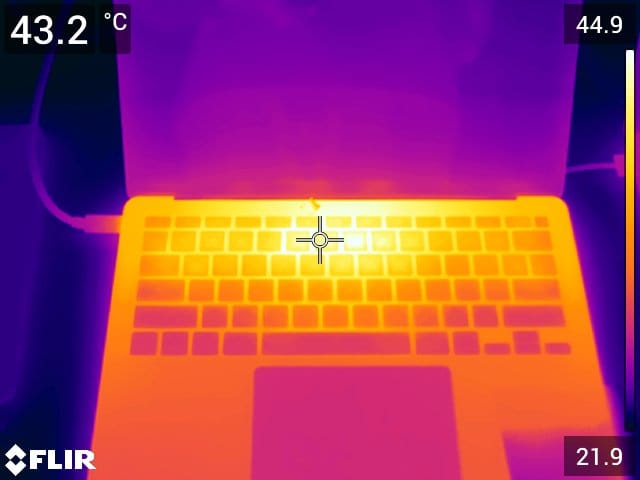
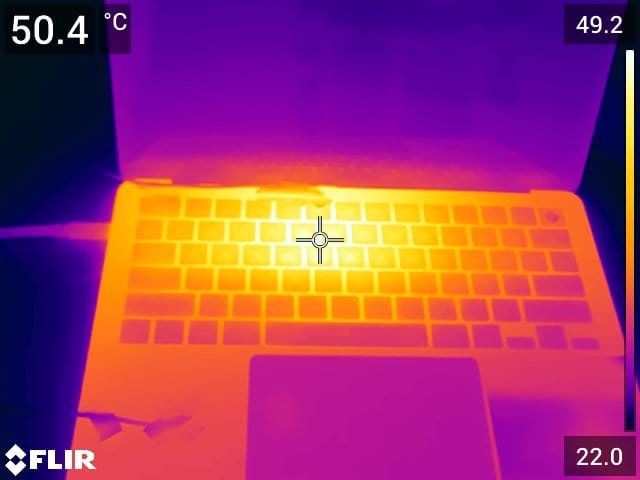
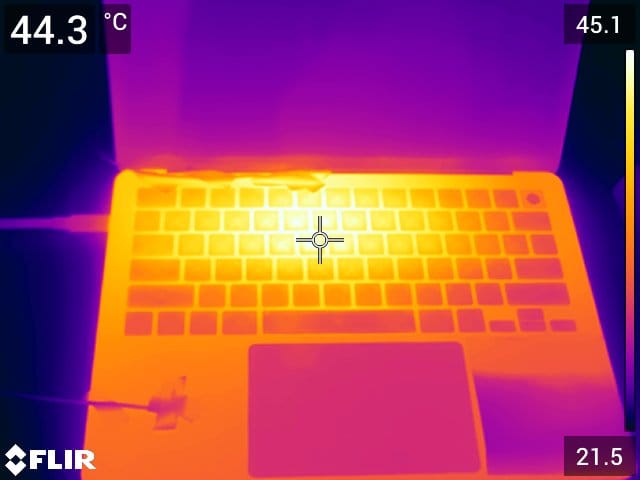
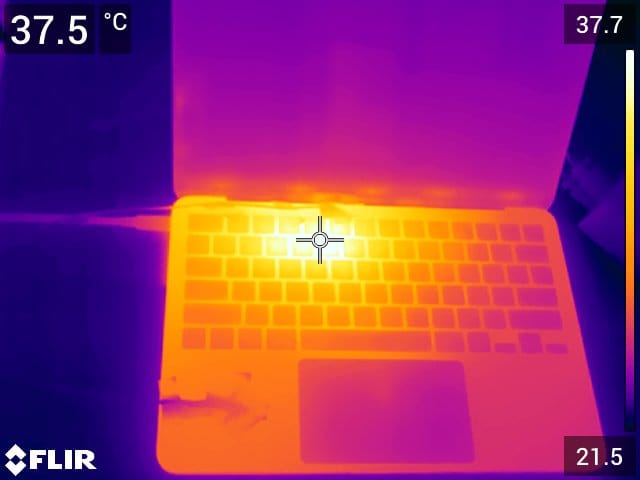
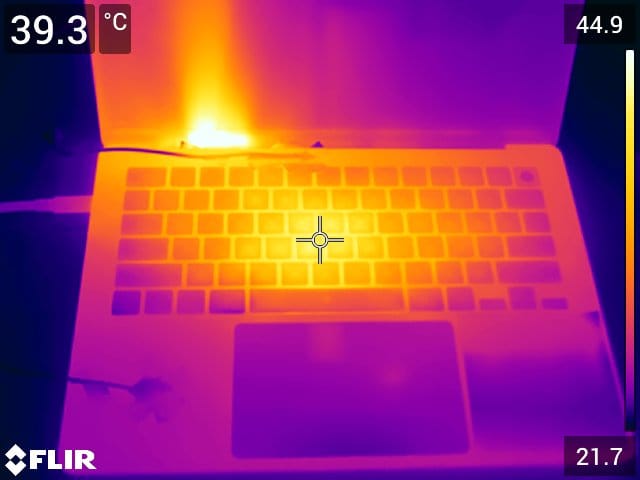
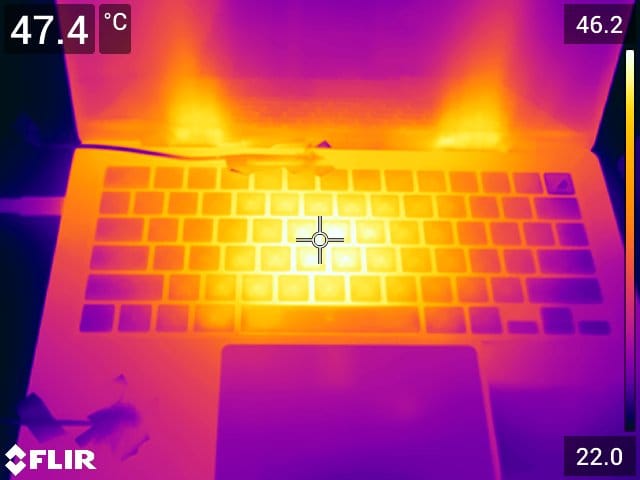
{{slide}}MacBook Air M1 FLIR image.{{/slide}}{{slide}}MacBook Air M4 FLIR image.{{/slide}}{{slide}}MacBook Air M5 FLIR image.{{/slide}}{{slide}}MacBook Neo A18 Pro FLIR image.{{/slide}}{{slide}}MacBook Pro M5 FLIR image.{{/slide}}{{slide}}MacBook Pro M5 Pro FLIR image.{{/slide}}
All Device Results
We conducted the Cinebench 2026 runs on all six devices, below are plots of the temperatures and total processor power. Each device is shown in a separate subplot.
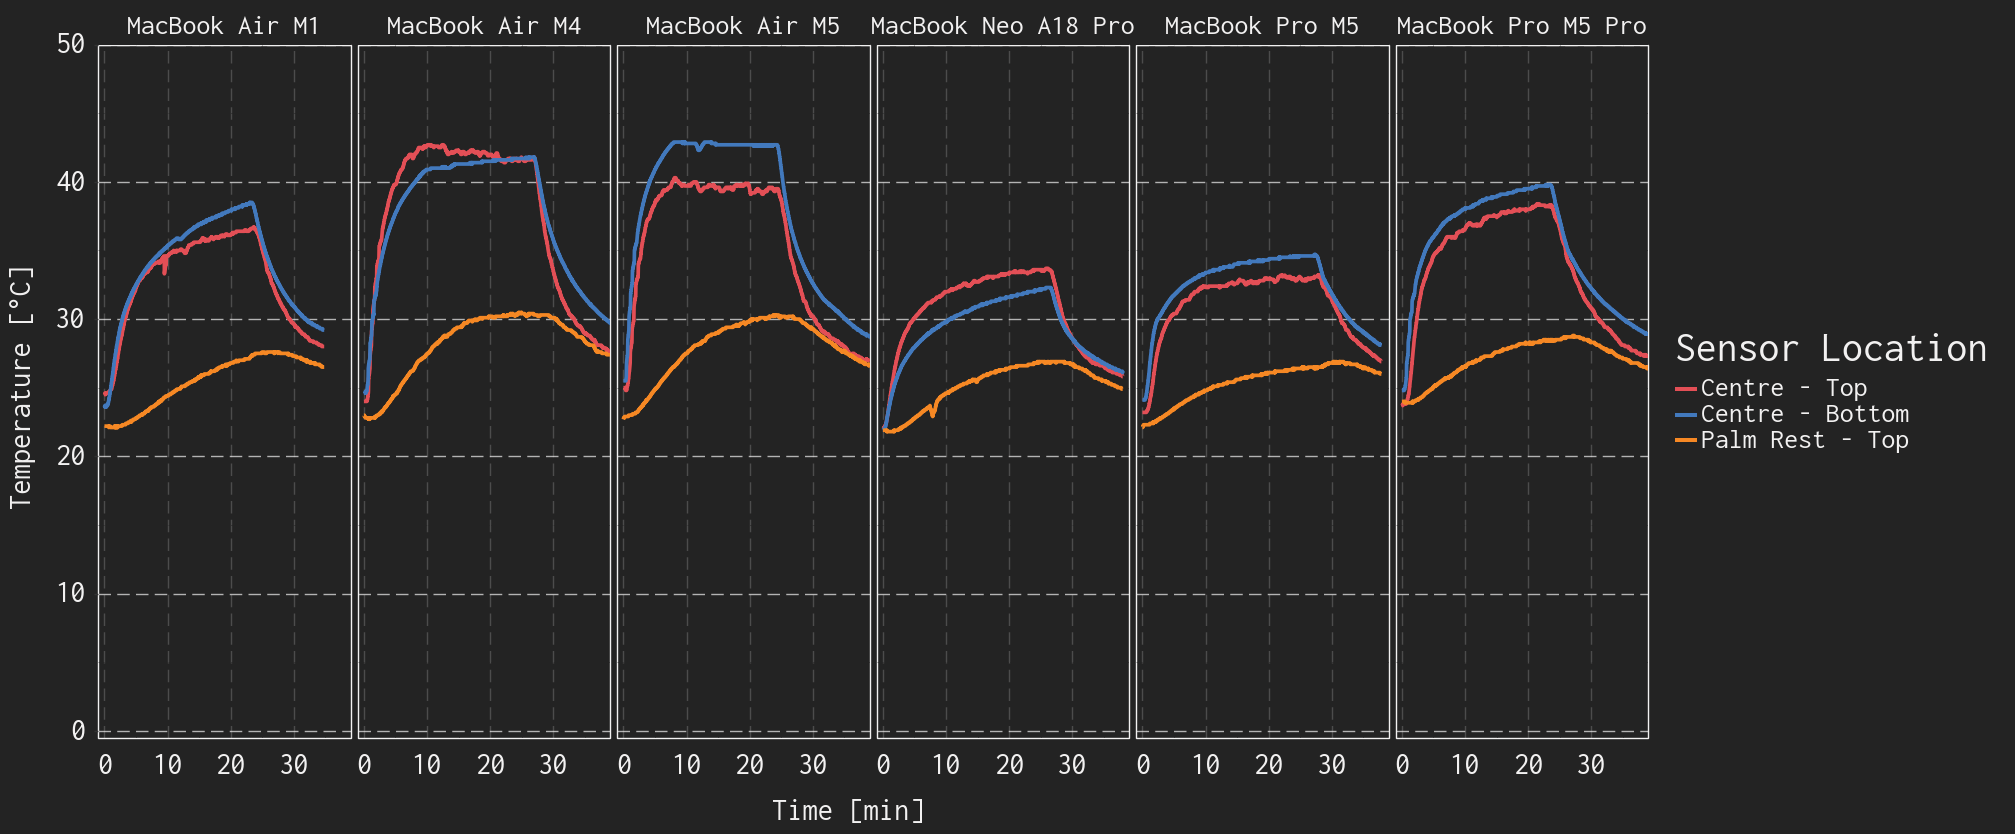
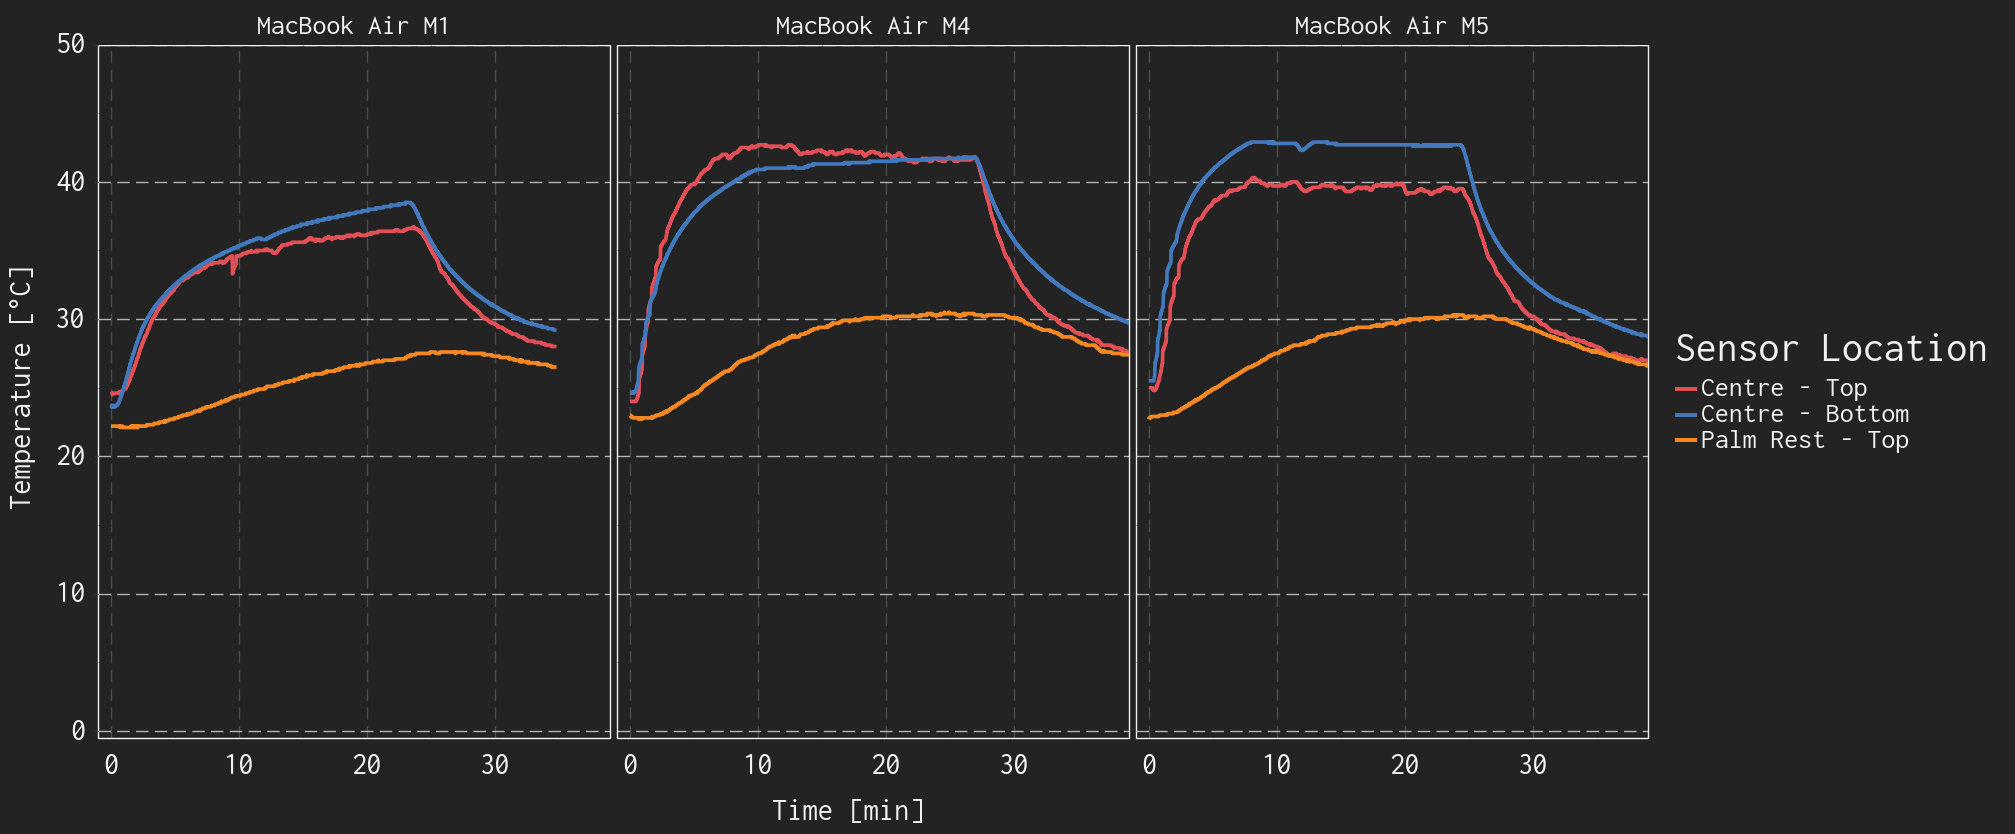
{{slide}}Surface temperature of all MacBooks over the test duration.{{/slide}}{{slide}}Surface temperature of MacBook Airs over the test duration.{{/slide}}
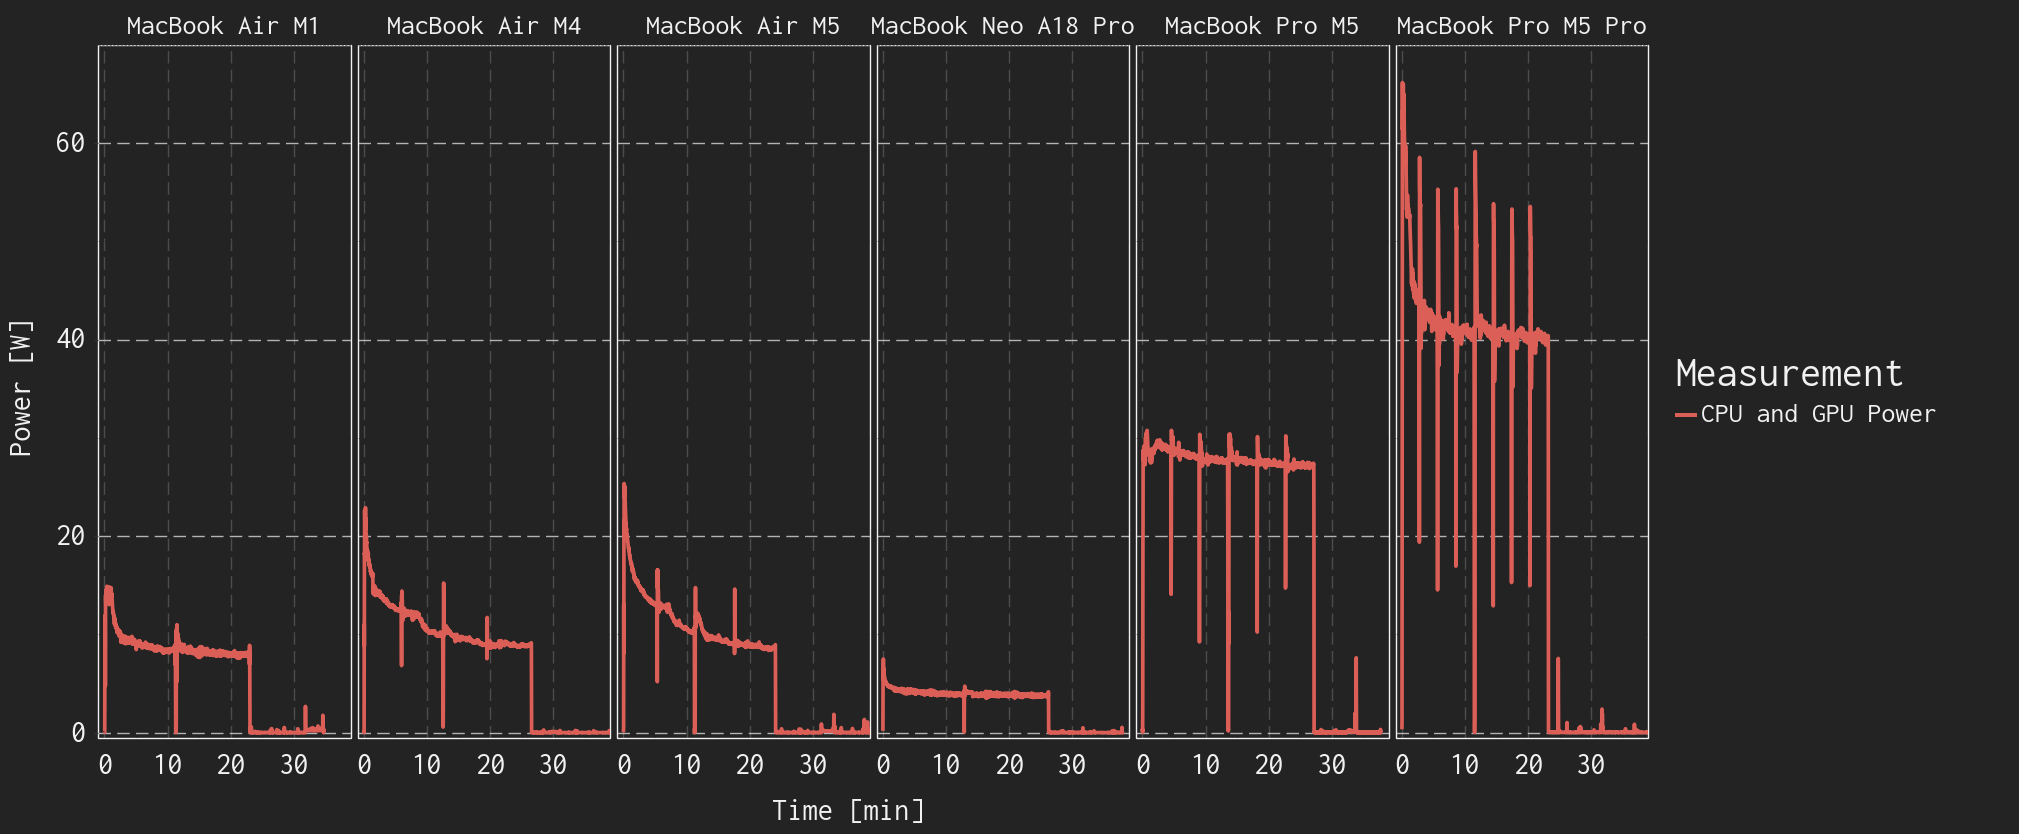
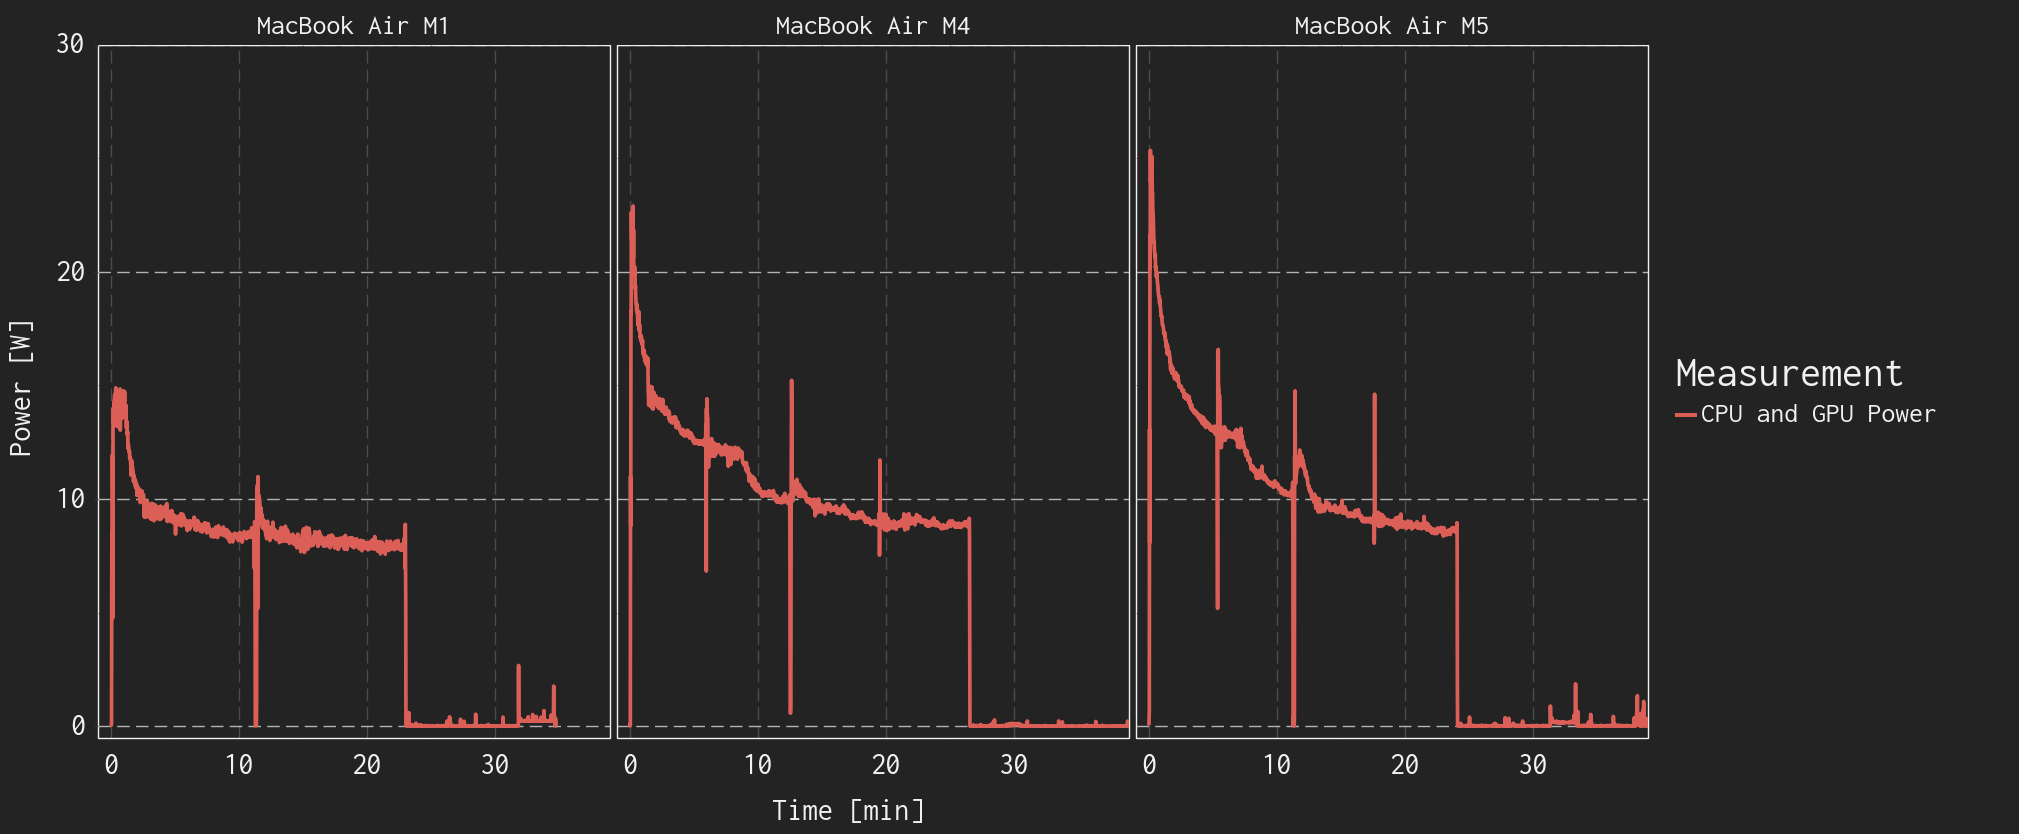
{{slide}}Combined CPU and GPU power of all MacBooks over the test duration.{{/slide}}{{slide}}Combined CPU and GPU power of MacBook Airs over the test duration.{{/slide}}
Comparative Temperatures
Each subplot below shows the temperature measurements of a single measurement location, across all devices tested.
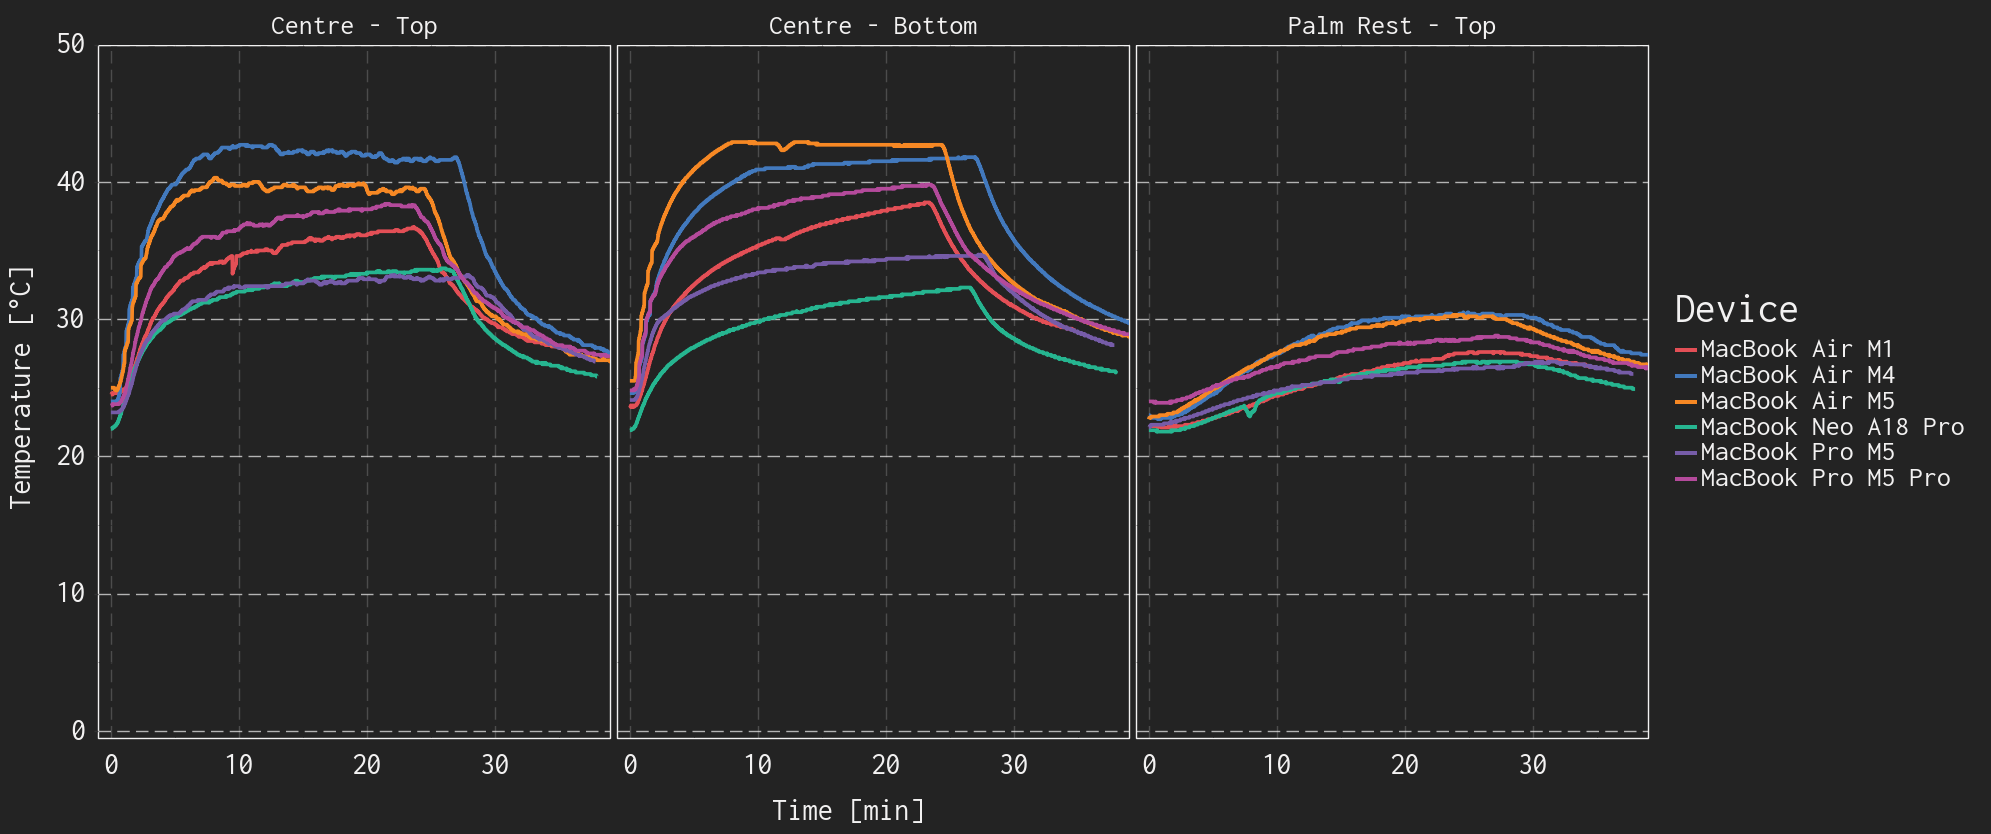
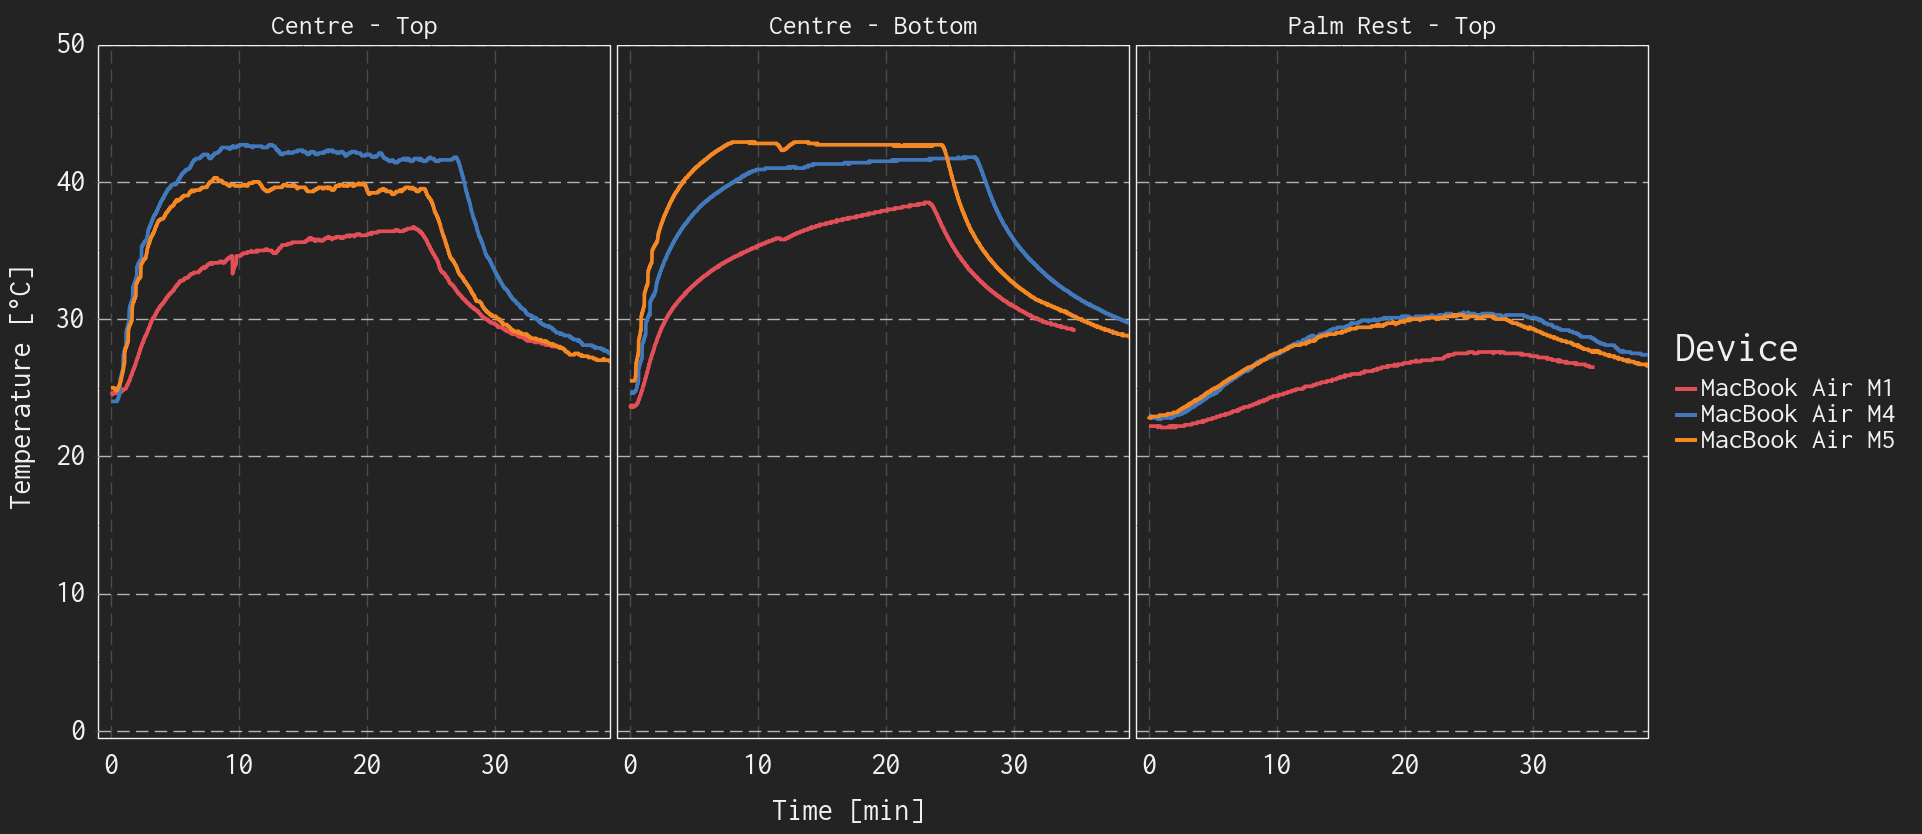
{{slide}}Surface temperature measurement location comparison of all MacBooks.{{/slide}}{{slide}}Surface temperature measurement location comparison of all MacBook Airs.{{/slide}}
MacBook Air M4 ReTest
The plots above show that the MacBook Air M4 has a different temperature profile than the rest of the devices. The thermocouple on the top of the case reached higher temperatures than the bottom case, but then the temperatures equalized. We reapplied the thermocouples and conducted the test a second time with similar results, shown below.
This is also an interesting look at the repeatability of the test.
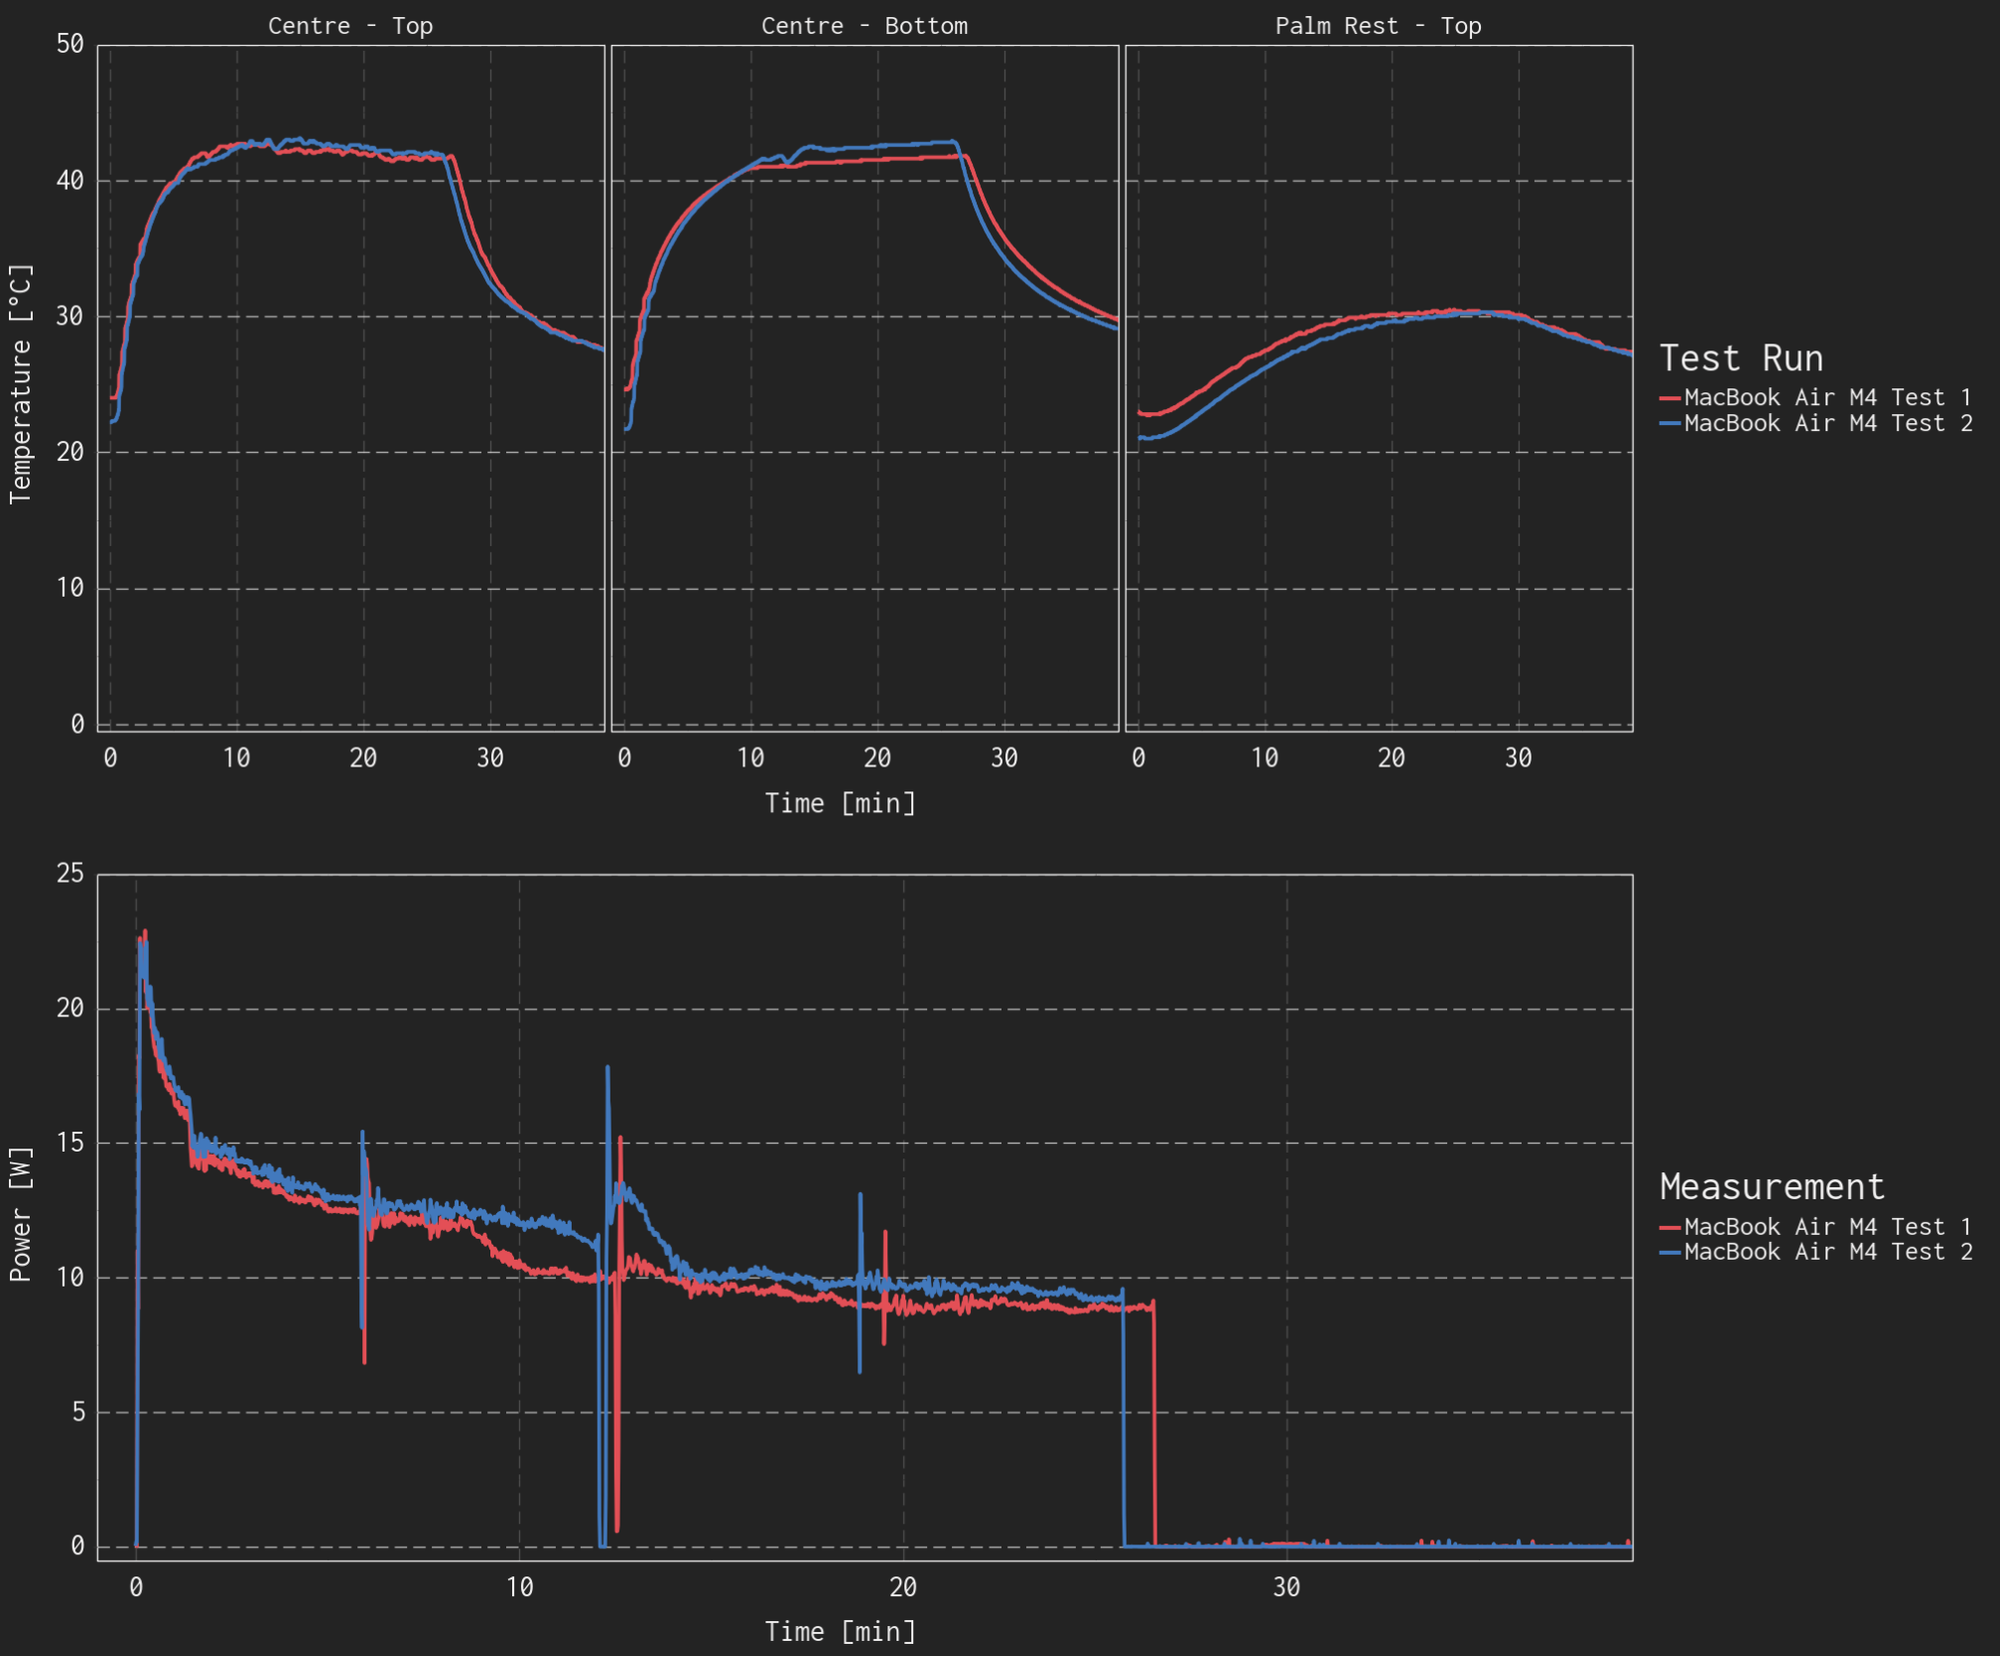
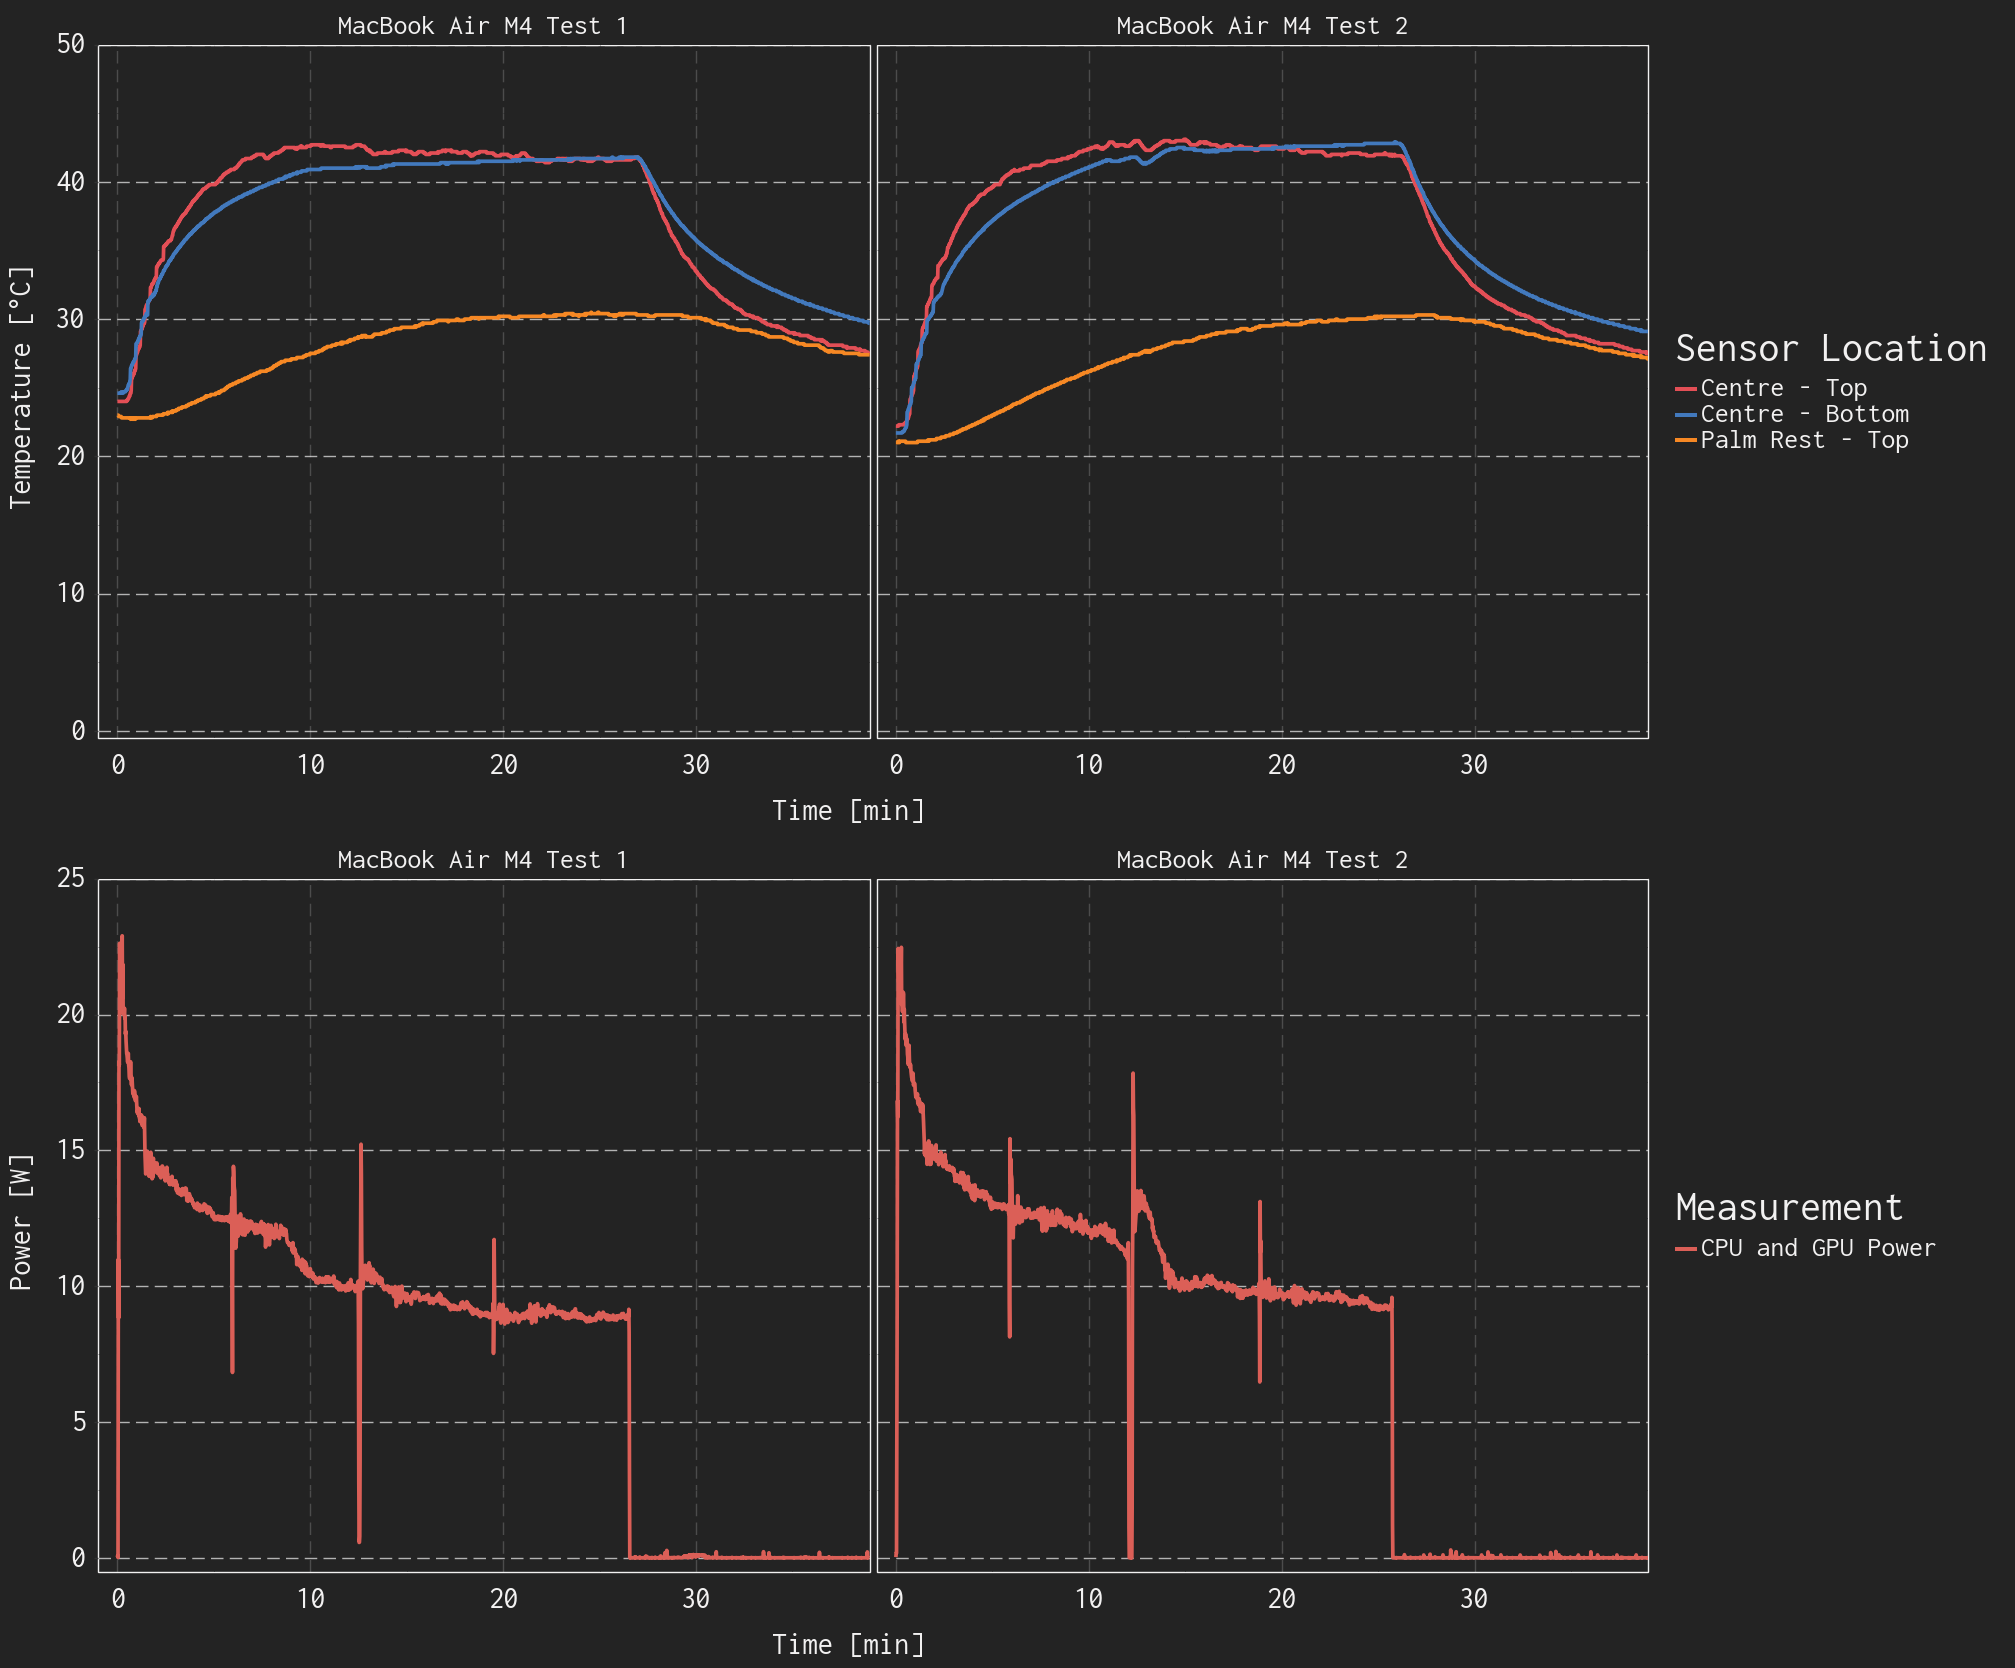
Comparison of two separate test runs with the MacBook Air M4.
Discussion
These results aren't conclusive and should be taken with a grain of salt, we're very open to discussion about what you would like to see more/less of, or which questions we can answer while we develop some sort of standard method for temperature testing. Below are some aspects that aren't settled and warrant further discussion and experimentation.
Probe Location
Beyond the measurement method, the locations on the device where the temperature is measured will significantly impact the relevance, and comparability of the results.
All laptops tested in this round have relatively similar construction, and even relatively similar placement of the heat generating components. This simplifies the decision of where to conduct the measurements, and the results are relatively comparable. Though even with this consistency, the FLIR images show that the location of the hotspot(processor location) differs.
Measuring the temperature at the hottest point(s) on each device will allow us to make statements of maximum temperature reached, but then we lose comparability of results between devices. Measuring in consistent locations makes results more comparable, but will likely result in us 'missing' hotspots or other points of interest.
We'll likely stick to a maximum of four measurement points, with a couple in fixed locations and the others at the points of maximum temperature that we can identify with the FLIR.
Environmental Controls
This testing was conducted in our general workspace, not in our environmental chamber. This has a slight decrease in consistency as our ambient temperature/environment can vary by a couple degrees Celsius, but may remove the cooling effect that the forced air in the chamber can cause. There is further testing required here to determine the level of influence that can have.
Industry professionals that we've discussed this with say that they often conduct thermal testing 'on the bench' for the ease of testing.
Applying a Load
We conducted two runs of the 10 minute Cinebench 2026 CPU multi-thread test followed by approximately 10 minutes idle. This test has almost no GPU component to it, so that hardware won't be generating heat and the test won’t be representative of all workloads.
Ideally we could test all varieties of workload, but time constraints mean that we would likely have to choose one or two. It can’t be the ‘worst case’ for every single device that we test. We can perform exploratory testing, but we have to draw the line somewhere, and waiting for devices to cool down before another test can take significant time{{tooltip: especially if they have no fan}}.{{/tooltip}}
Duration
While most devices tested were able to achieve close to thermal equilibrium, the MacBook Air M1 throttled while the temperature continued to rise. The M1 processor isn't generating an immense amount of heat, but the MacBook Air doesn't have a way to spread it around quickly. With longer testing and loading it would likely achieve temperatures close to 40°C.
There is a tradeoff to be made between reaching the maximum temperatures, being able to capture the pattern of the temperature rise, and of course not requiring a four hour test for each device. Especially when that is unlikely to be representative for users of a MacBook Air.
We’re still working on all this, but you may start to see some temperature results if we’re able to collect informative results for ShortCircuit and LinusTechTips videos.