Phone Battery Life Meta Analysis
Smartphone battery testing is one of the most valuable but contentious tests that we conduct. Here we explore some of our results collected from projects in the past year.
{{tooltip: interchangeable with 'mobile devices' in this article}}Smartphone{{/tooltip}} battery testing is one of the most valuable but contentious tests that we conduct. We design our tests and benchmarks with the goal of achieving the three "R"s: Reliability, Repeatability, and Relevance. The tests typically strike a balance that satisfies all three, but considering the constraints, this test requires a conscious tradeoff.
Our approach of prioritizing reliability and repeatability over relevance has downsides, like not being able to make the statement "it will last you eight hours of daily use". The alternative is optimizing for the relevance of the test, but that typically makes it hyper-relevant to a subset of the population while alienating others.
Our current procedure empowers us to perform some measured comparison of our results across different test projects and devices, as in the visualizations below. We've compiled results since July 2025 when we last altered our test procedure.
Let us know if this brings up any additional questions that you would like answered!
The Test
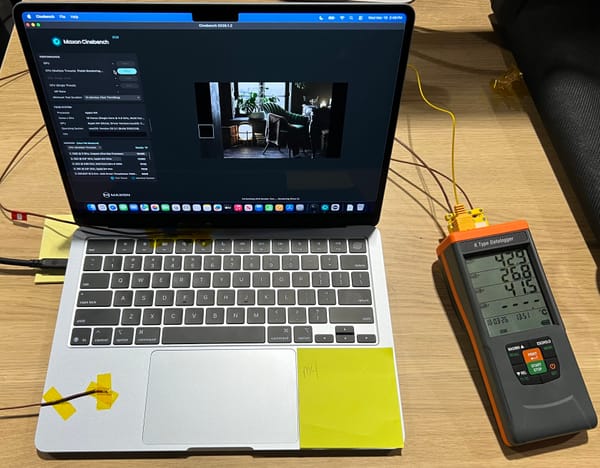
Our battery discharge test focuses on achieving the most repeatable results considering that our time is often limited between when we receive a product, and when the results have to be delivered for inclusion in a ShortCircuit or LinusTechTips video.
We setup the device primarily using default settings, with some changes for consistency. We set the display brightness to 200 nits, and locally stream muted video in the Plex app until the device powers off. The specific settings vary for each phone, operating system, and technology so it is infeasible to account for all of them in a standard procedure. Instead we set them with a philosophy of limiting unpredictable power behaviour.
One of the complexities of testing mobile devices is that they're quite 'locked down', like testing a 'black box'. We often don't have any control to stop it from indexing photos or syncing to the cloud when it chooses. We disable what we can, including most dynamic reactions to external stimuli(light or attention-aware features), but the test results still vary from run to run.
If a discharge test results in an unexpected measurement then we look back at our camera recording to check for unintended notifications or interruptions to the video, and typically conduct the test again for a second or third time. If there are notable display, power, or battery saving features then we also consider testing those.
Results
Visualizations of the complete results are presented below, followed by a collection of results and conclusions. There isn't a single conclusion that can be drawn, but there are many small things to observe.
We're maximizing the data shown, so we've had to use both colour and shape to convey information and ensure that each device and manufacturer is distinct. It may be helpful to use the graphs as visual reference and then consult the complete table; some of the shapes and colours can appear similar.
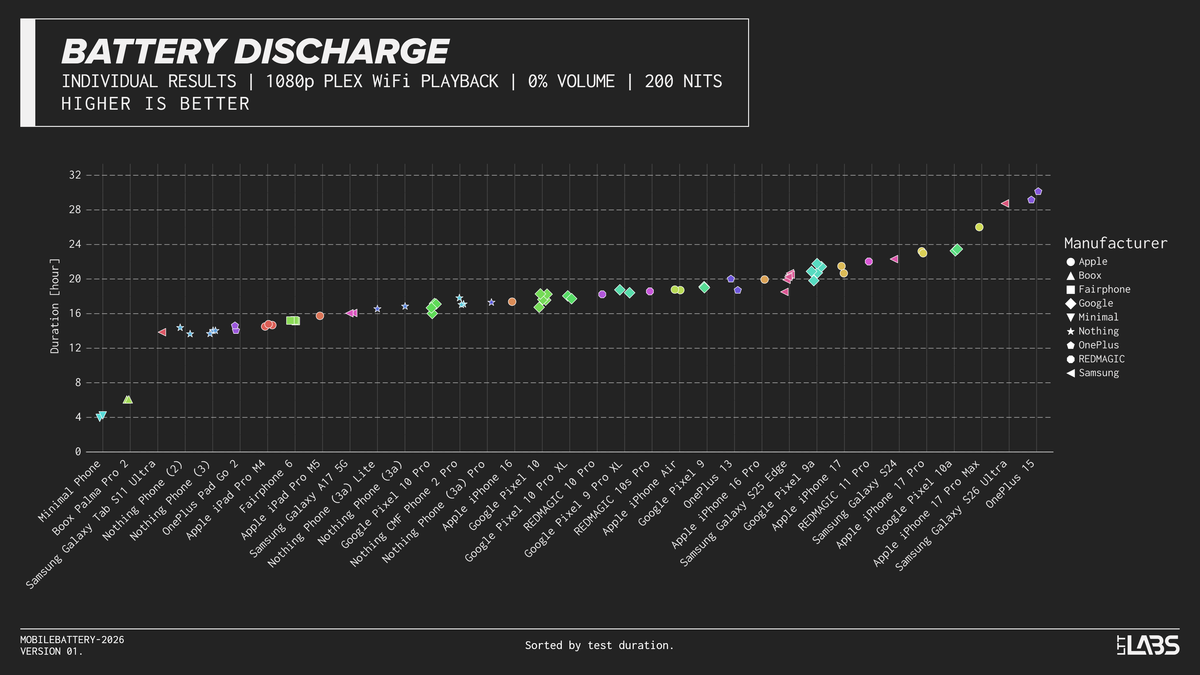
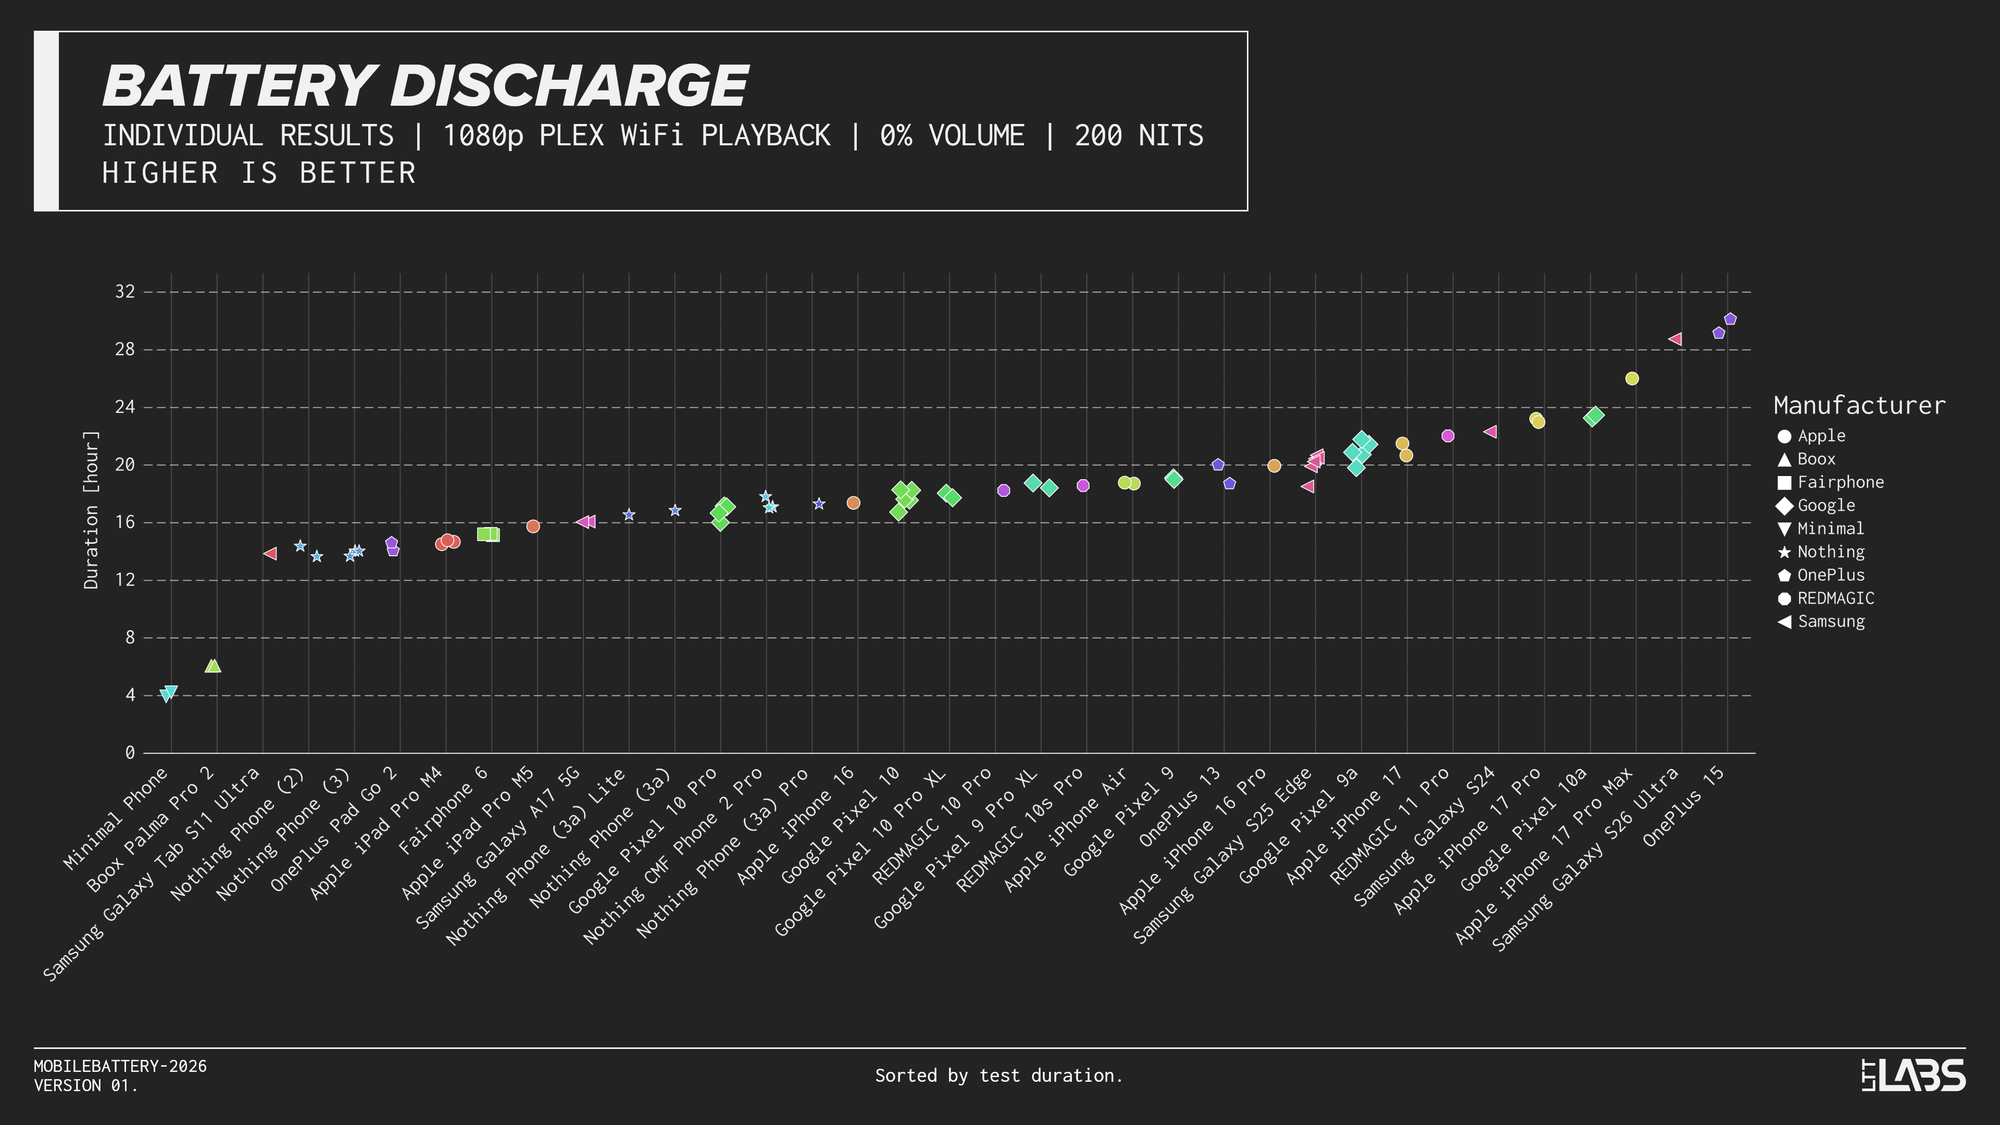
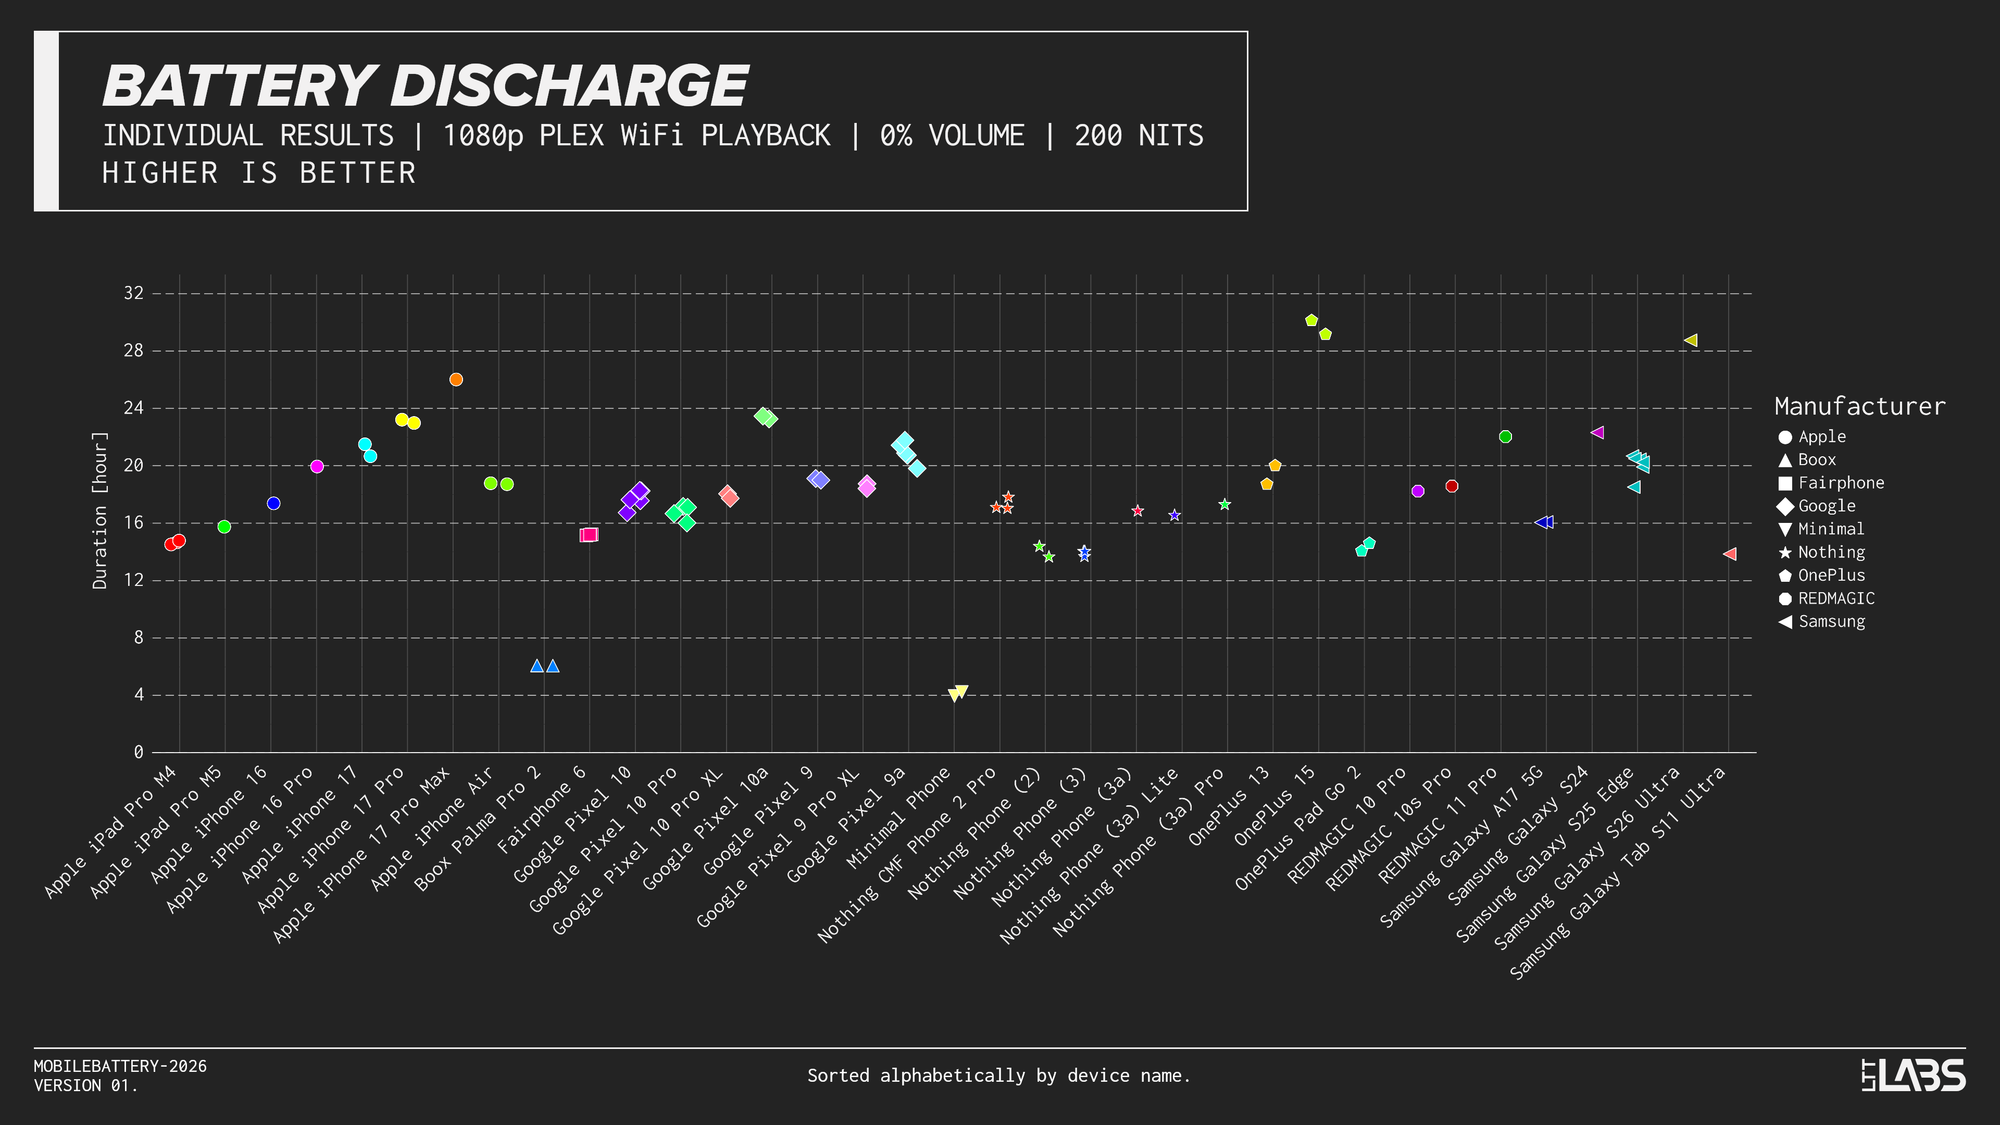
Below are the results of all devices we tested, the multiple datapoints also display the variance we experienced with the test.
Below is the same data, but sorted by device name.
The graphs below show the nominal capacity of the battery on the x-axis with the result of the battery discharge test on the y-axis. Higher values represent devices that last longer in the test, and devices with larger batteries are further to the right.
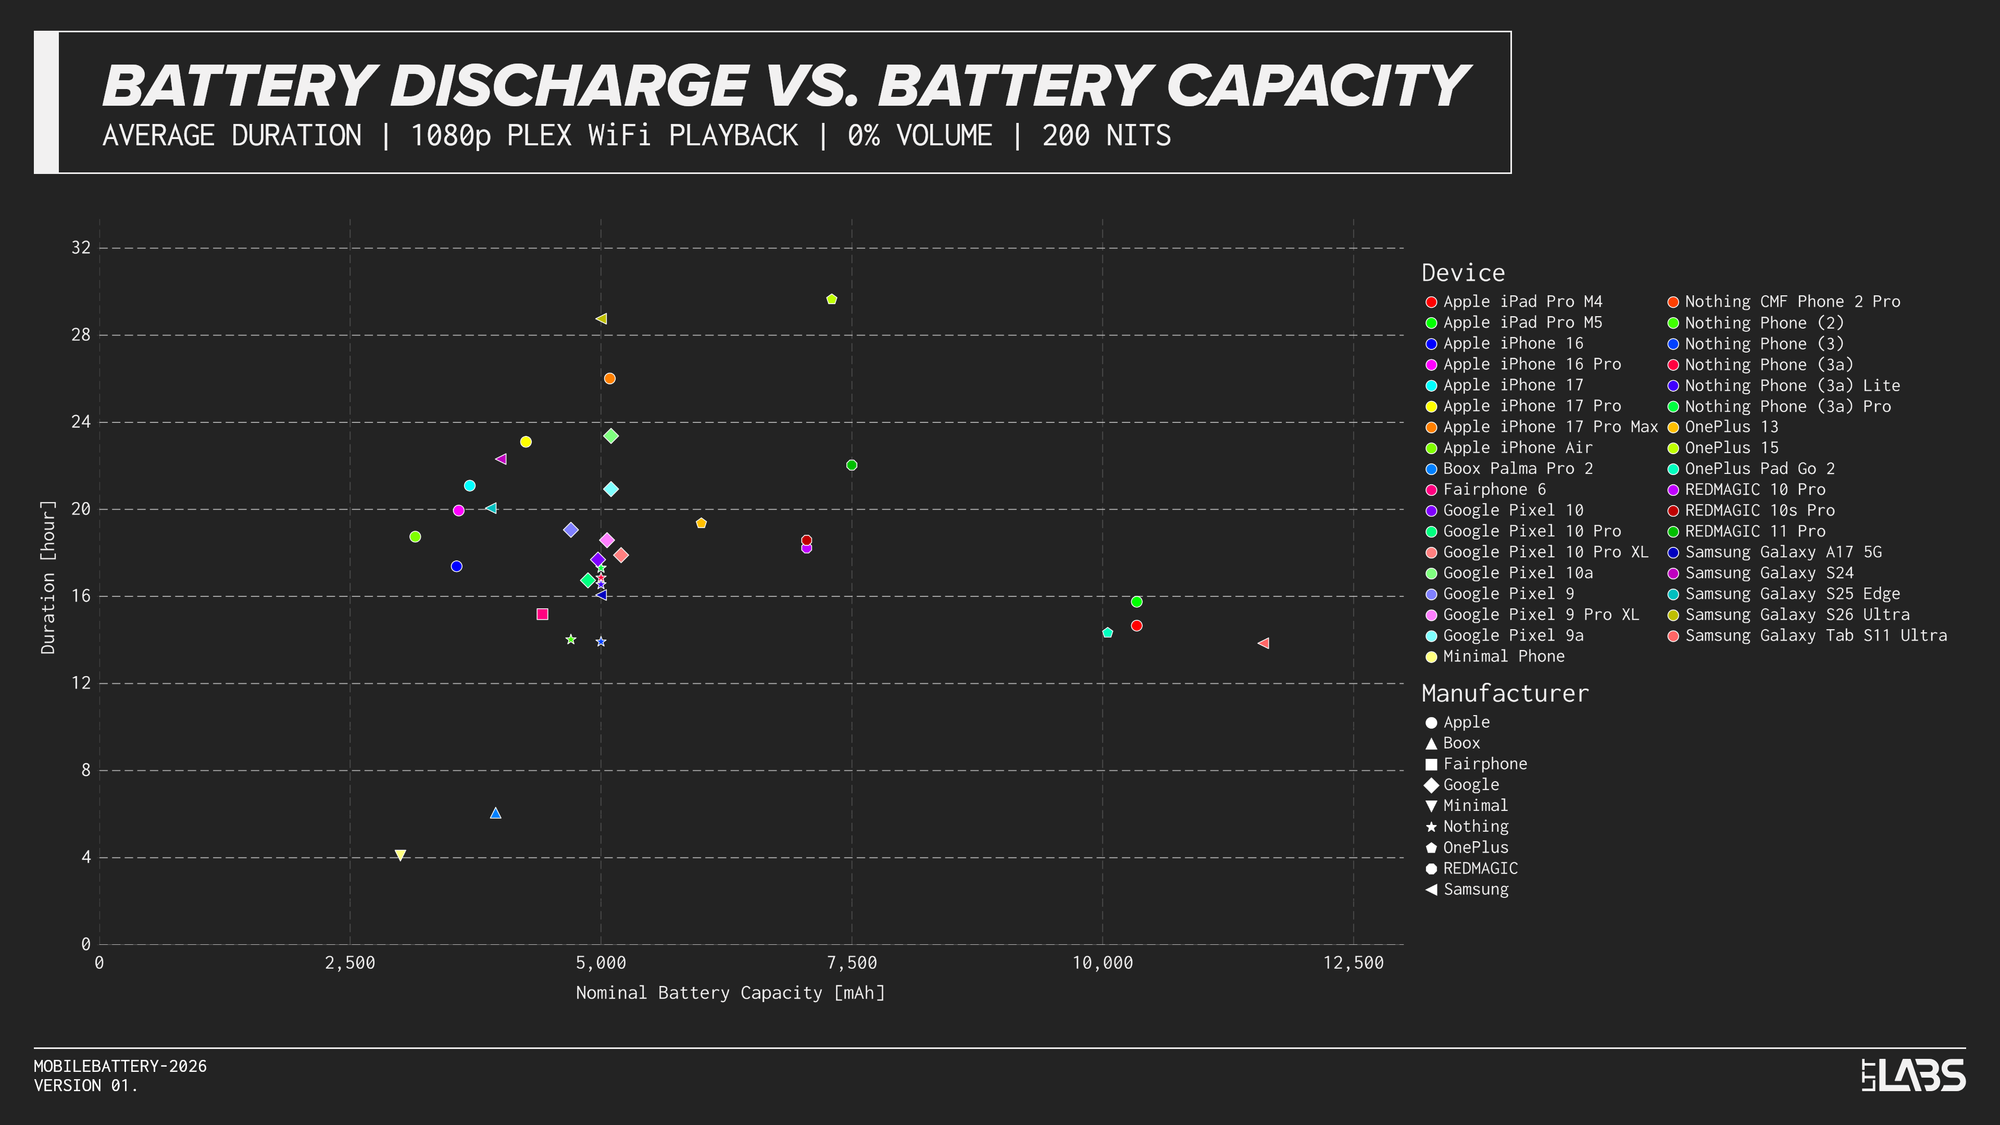
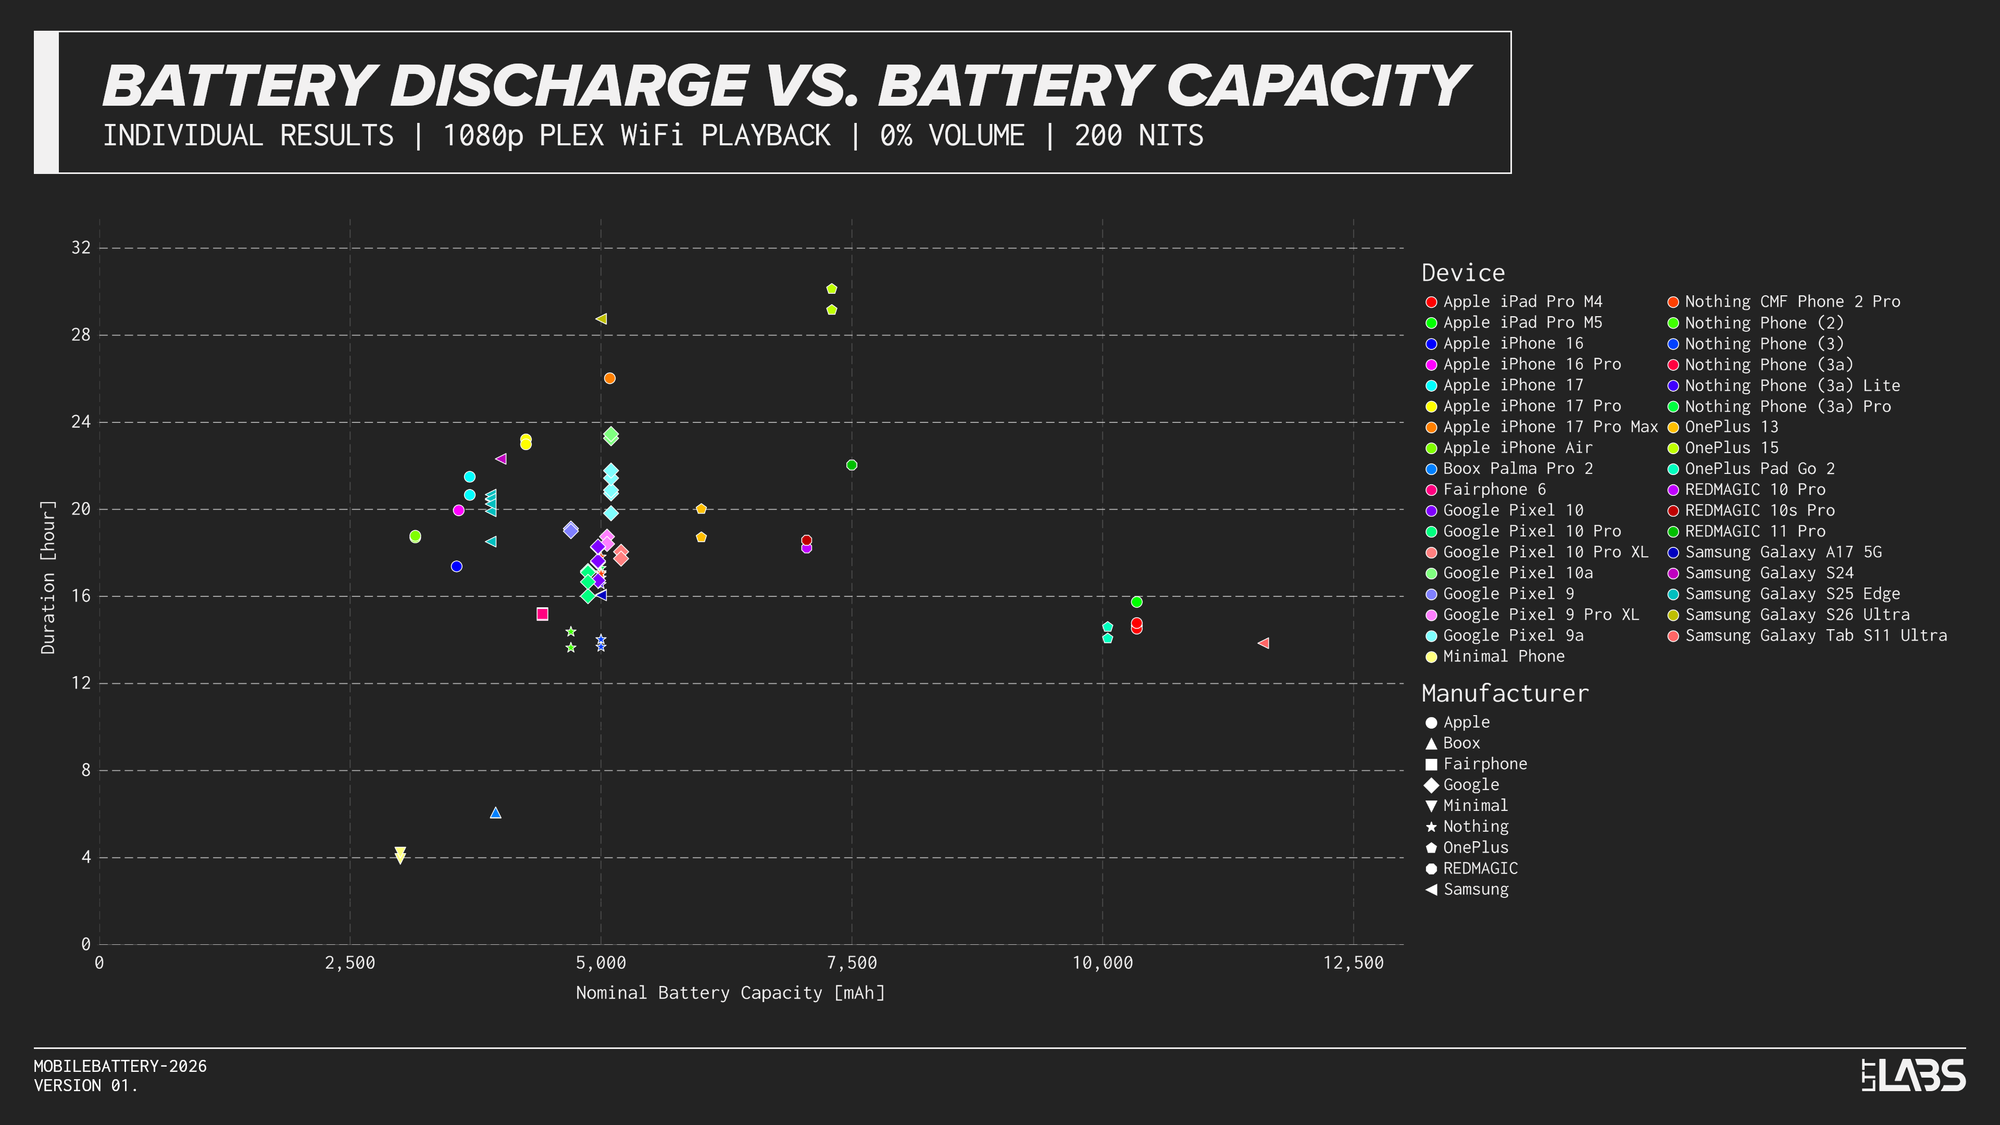
Device battery discharge test results in comparison to nominal battery capacity.
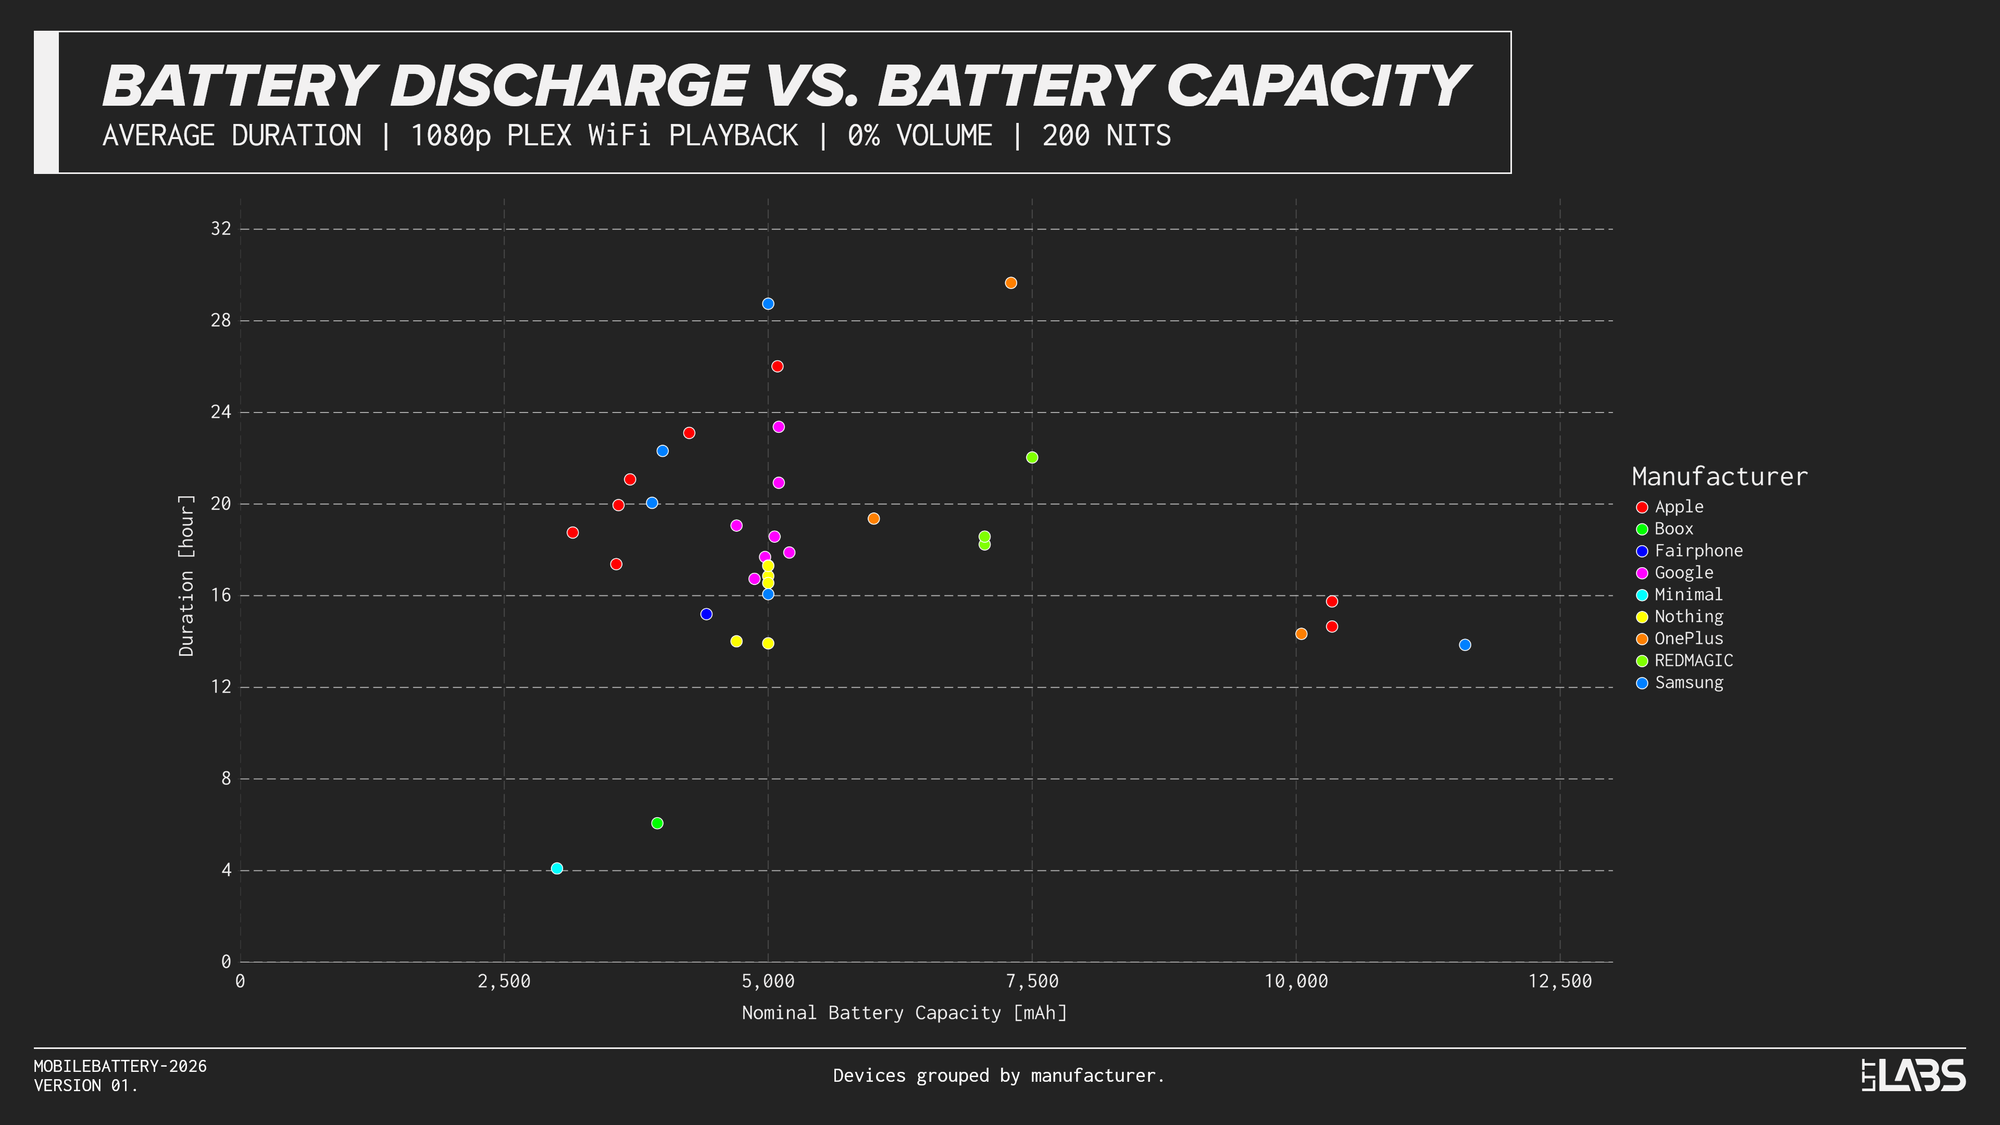
This is the same data, but coloured according to the manufacturer.
Battery Discharge Table
Sorted by descending average duration.
| Device | Battery Capacity [mAh] | Test Count | Minimum Duration [min] | Average Duration [min] |
Maximum Duration [min]
|
| OnePlus 15 | 7300 | 2 | 1750 | 1779 | 1808 |
| Samsung Galaxy S26 Ultra | 5000 | 1 | 1725 | 1725 | 1725 |
| Apple iPhone 17 Pro Max | 5088 | 1 | 1561 | 1561 | 1561 |
| Google Pixel 10a | 5100 | 2 | 1396 | 1402 | 1408 |
| Apple iPhone 17 Pro | 4252 | 2 | 1379 | 1386 | 1393 |
| Samsung Galaxy S24 | 4000 | 1 | 1339 | 1339 | 1339 |
| REDMAGIC 11 Pro | 7500 | 1 | 1322 | 1322 | 1322 |
| Apple iPhone 17 | 3692 | 2 | 1240 | 1265 | 1290 |
| Google Pixel 9a | 5100 | 5 | 1189 | 1256 | 1307 |
| Samsung Galaxy S25 Edge | 3900 | 6 | 1111 | 1203 | 1241 |
| Apple iPhone 16 Pro | 3582 | 1 | 1197 | 1197 | 1197 |
| OnePlus 13 | 6000 | 2 | 1123 | 1162 | 1201 |
| Google Pixel 9 | 4700 | 2 | 1140 | 1144 | 1147 |
| Apple iPhone Air | 3149 | 2 | 1123 | 1125 | 1127 |
| Google Pixel 9 Pro XL | 5060 | 2 | 1105 | 1115 | 1125 |
| REDMAGIC 10s Pro | 7050 | 1 | 1115 | 1115 | 1115 |
| REDMAGIC 10 Pro | 7050 | 1 | 1094 | 1094 | 1094 |
| Google Pixel 10 Pro XL | 5200 | 2 | 1064 | 1074 | 1083 |
| Google Pixel 10 | 4970 | 5 | 1004 | 1062 | 1097 |
| Apple iPhone 16 | 3561 | 1 | 1043 | 1043 | 1043 |
| Nothing CMF Phone 2 Pro | 5000 | 3 | 1022 | 1039 | 1069 |
| Nothing Phone (3a) Pro | 5000 | 1 | 1038 | 1038 | 1038 |
| Nothing Phone (3a) | 5000 | 1 | 1011 | 1011 | 1011 |
| Google Pixel 10 Pro | 4870 | 4 | 961 | 1004 | 1030 |
| Nothing Phone (3a) Lite | 5000 | 1 | 993 | 993 | 993 |
| Samsung Galaxy A17 5G | 5000 | 2 | 963 | 964 | 965 |
| Apple iPad Pro M5 | 10340 | 1 | 945 | 945 | 945 |
| Fairphone 6 | 4415 | 3 | 909 | 912 | 914 |
| Apple iPad Pro M4 | 10340 | 3 | 871 | 879 | 887 |
| OnePlus Pad Go 2 | 10050 | 2 | 844 | 860 | 876 |
| Nothing Phone (2) | 4700 | 2 | 819 | 841 | 863 |
| Nothing Phone (3) | 5000 | 3 | 821 | 835 | 842 |
| Samsung Galaxy Tab S11 Ultra | 11600 | 1 | 831 | 831 | 831 |
| Boox Palma Pro 2 | 3950 | 2 | 364 | 365 | 365 |
| Minimal Phone | 3000 | 2 | 237 | 246 | 254 |
Conclusions
Variation
The initial reason for this analysis was to analyze the variance of the results. From the above we can see that results from the same device are consistent enough to draw general battery life conclusions from. As with any test, the variance must be considered, and we will continue to be conservative with comparative statements of battery life, but this provides context for how definitively the results should be taken.
Software Updates
We reconduct the battery discharge test for each project as there are often rumours of software updates improving or 'destroying' battery life. Software updates may explain some of the variance in our test results, but we haven't observed any significant increase or decrease in battery life after updating a device.
The historic data presented here spans less than a year, and most of the devices haven't received a major OS update so these results aren't conclusive. We will continue to watch for significant changes in performance.
Outliers
The most significant outlier without a {{tooltip: The app froze, or a notification interrupted the test.}}notable reason{{/tooltip}} is the low result for the Samsung Galaxy S25 Edge, measuring at 18h31m(1,111 minutes) instead of the typical 20h00m(1,200 minutes) to 20h40m(1,240 minutes). This was conducted in the OnePlus 15 ShortCircuit project(SC-EQUALS16-2025) and a re-test was performed, achieving 20h15m(1,215 minutes).
e-Ink Displays
The devices with extremely low battery life in this test are the Minimal Company Minimal Phone and the Boox Palma Pro 2. These devices claim to have exceptional battery life, but our standard battery test is not suited to the regular use of the device.
e-Ink devices can have a long battery life when displaying static content, but our test focuses on the display of moving video content. This testing is not representative of the comparative battery life that you can expect with these devices.
Battery Capacity
The most common battery capacity(mAh) for the devices we've tested in the past year is around 5,000 mAh(18.5 Wh assuming a cell voltage of 3.7 V). There are some lower devices, but those are mostly iPhones and a few specialty devices.
The battery life range for a device with a 5000 mAh battery was from 14 hours up to 28 hours. Even within the Google Pixel collection there was quite a difference; a 16h01m(961 minutes) test with the Google Pixel 10 Pro, up to 23h28m(1,408 minutes) achieved by the Google Pixel 10a. A nearly 50% increase, even within the same generation of device.
Tablets and Display Size
Tablets defy most people's expectations of having a long battery life due to their large battery capacity. Their large batteries typically don't make up for their even larger displays. Manufacturers seem to have a target battery life, after which they make the device as thin as possible.
As the display is a large component of our battery test(even at 200 nits), this means that they last between 14 and 16 hours in our test.
Apple iPhone
It is interesting to see the battery life of the iPhone 16 and iPhone 17 series have quite a pronounced increase from the oldest to the newest, with exception of the iPhone Air.
Google Pixel
The Pixel lineup appears to be going the opposite direction, with a minor decrease in battery life from the Google Pixel 9 series to the 10 series.