USB-C Cable Voltage Drop
This is a continuation(and escalation) of our previous article on USB-C cable voltage drop, now with improved testing and more cables.
This is a continuation(and escalation) of our previous article on USB-C cable voltage drop, now with improved testing and more cables. Data transfer speed capabilities of the cables aren’t tested in this article, we instead focus on thoroughly measuring the voltage drop across a variety of cable brands and lengths.
LTT Labs is directly affiliated with Linus Tech Tips, Creator Warehouse, and the LTT TrueSpec cable. We are conducting this testing exactly as described below, however, we advise you to confirm with other sources and come to your own conclusions. With that said, we have access to more equipment and cables than most people so we would like to share the interesting results of this testing. Spoiler alert, but the TrueSpec cables don't have the lowest voltage drop at all lengths we tested.
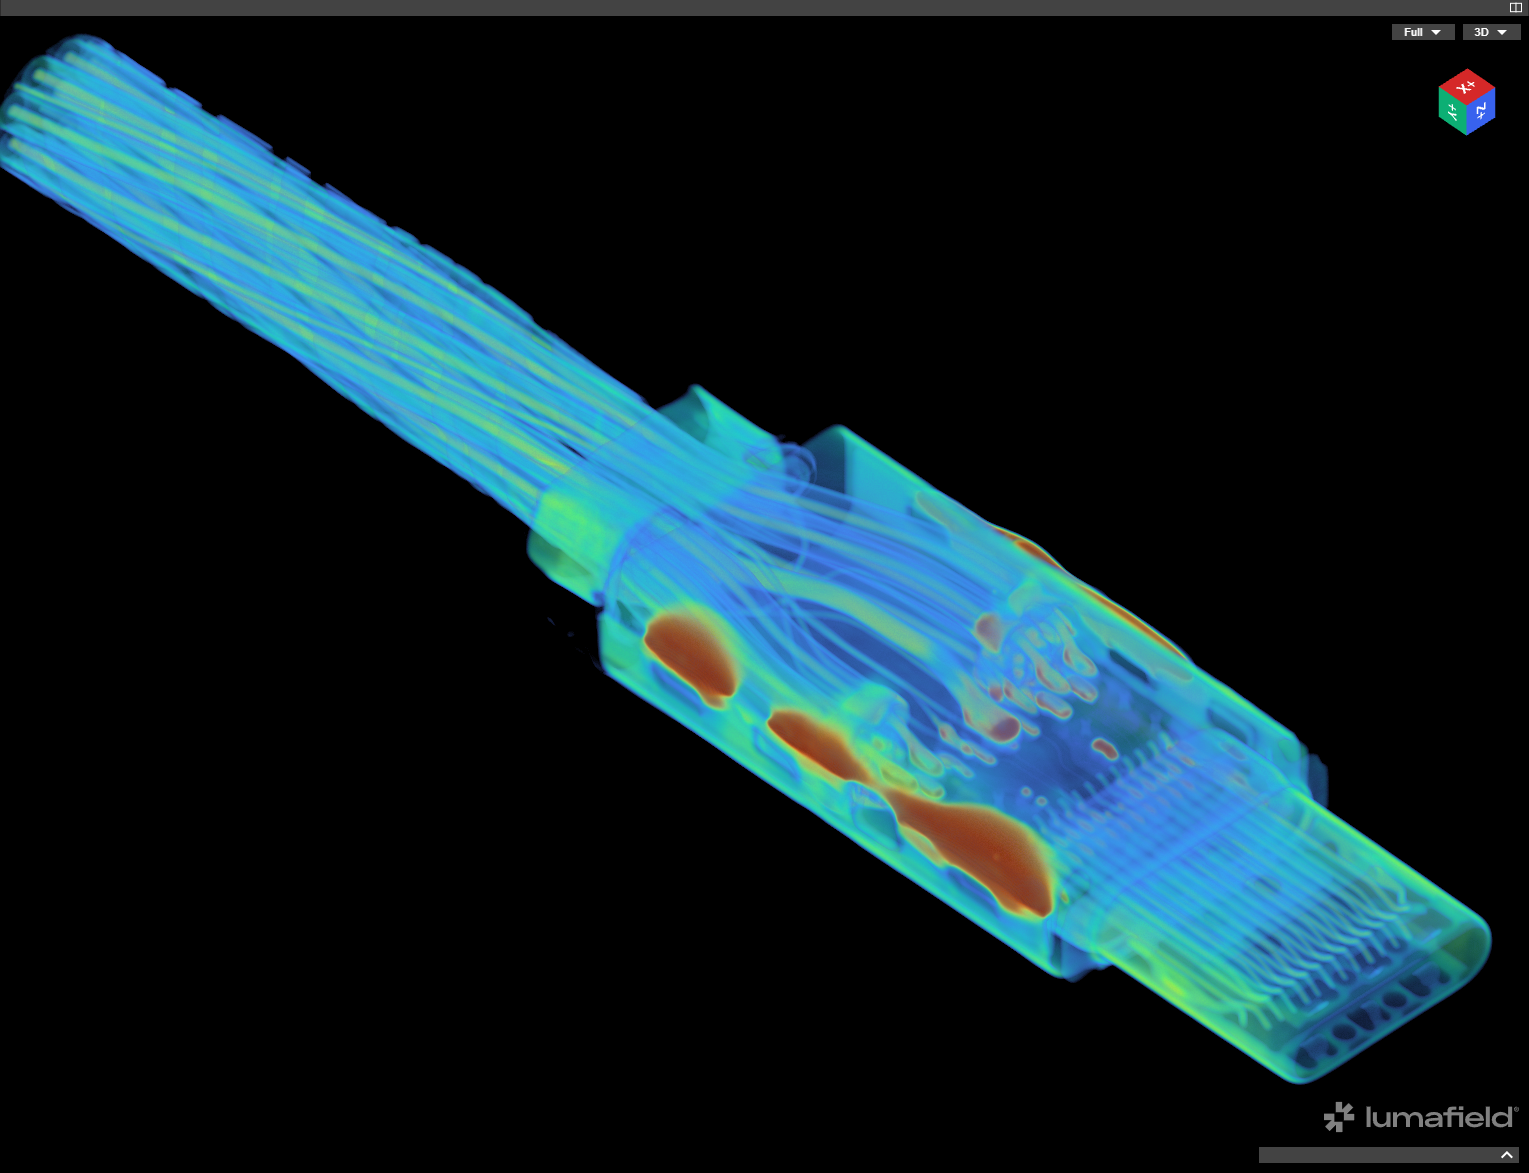
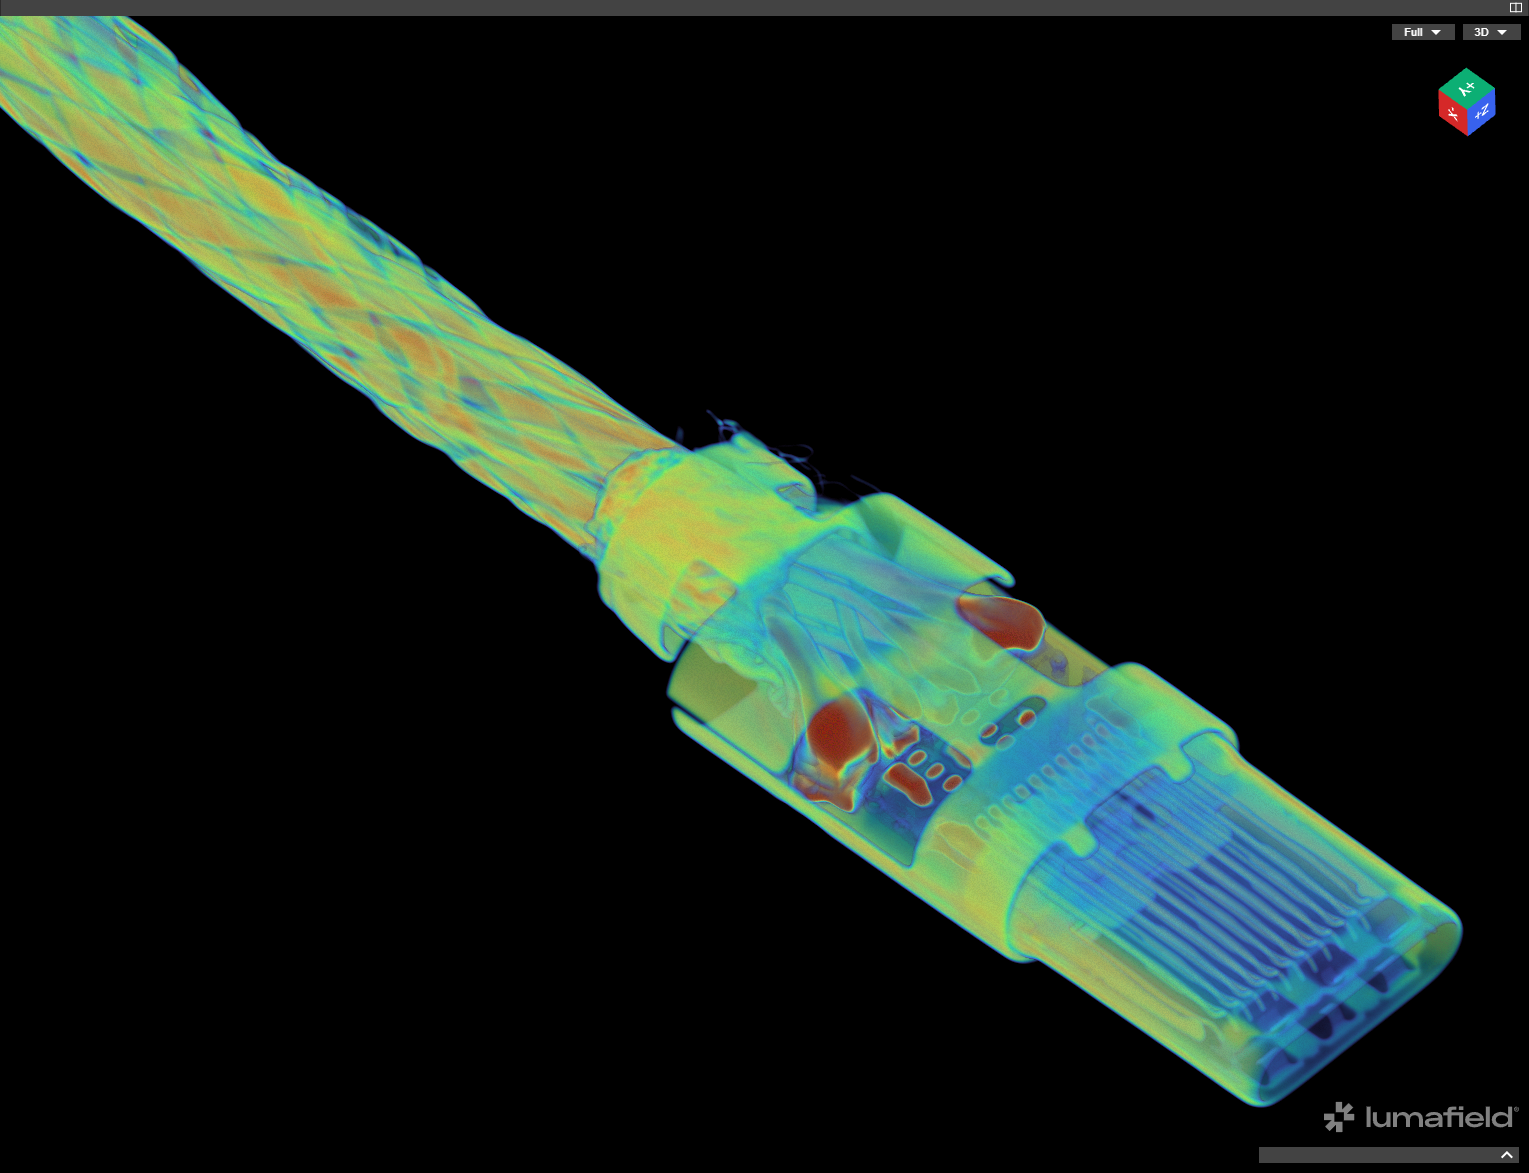
Before getting into the numbers, below are interactive CT scans of the 0.1 m and 5.0 m TrueSpec cables. It is very interesting to see the difference in number and size of conductors. The table of contents on the left of the screen is also very useful for jumping to different sections.
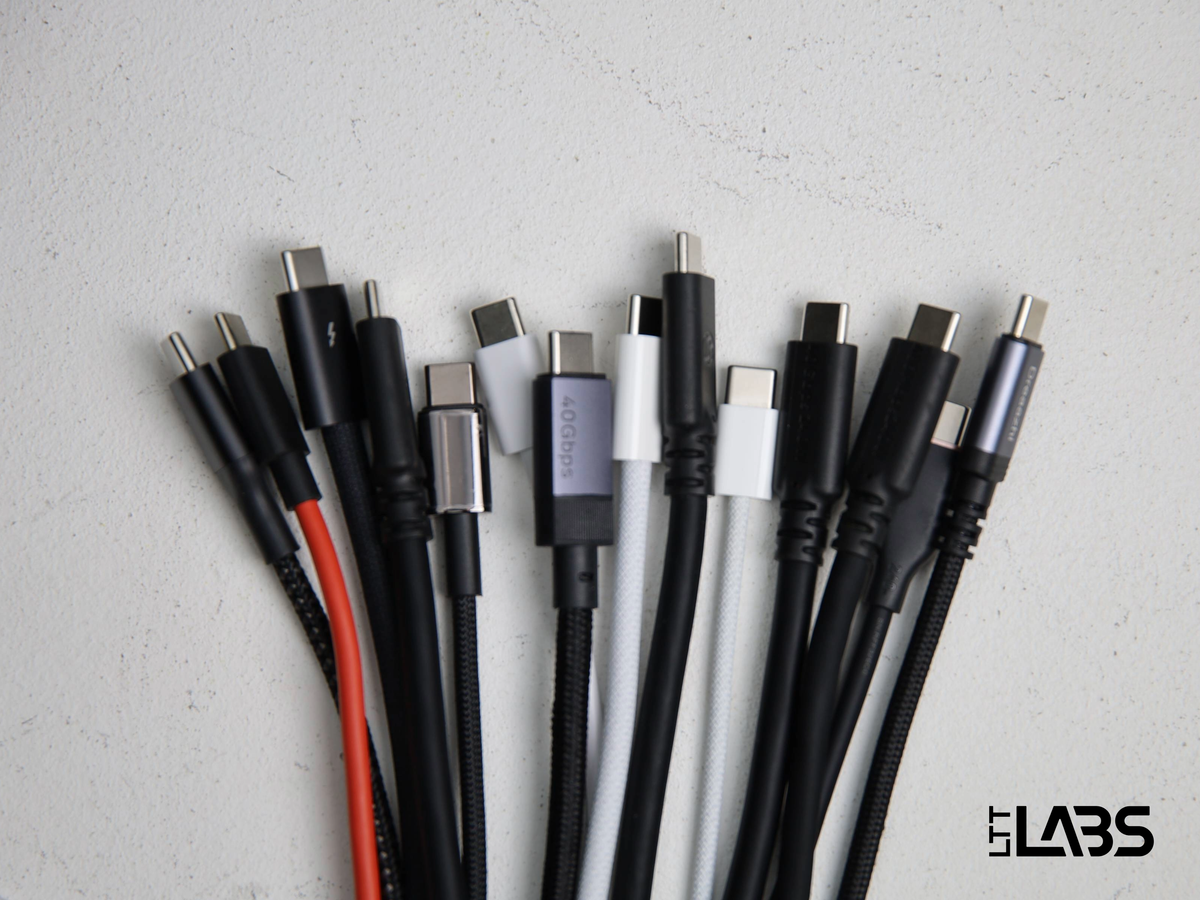
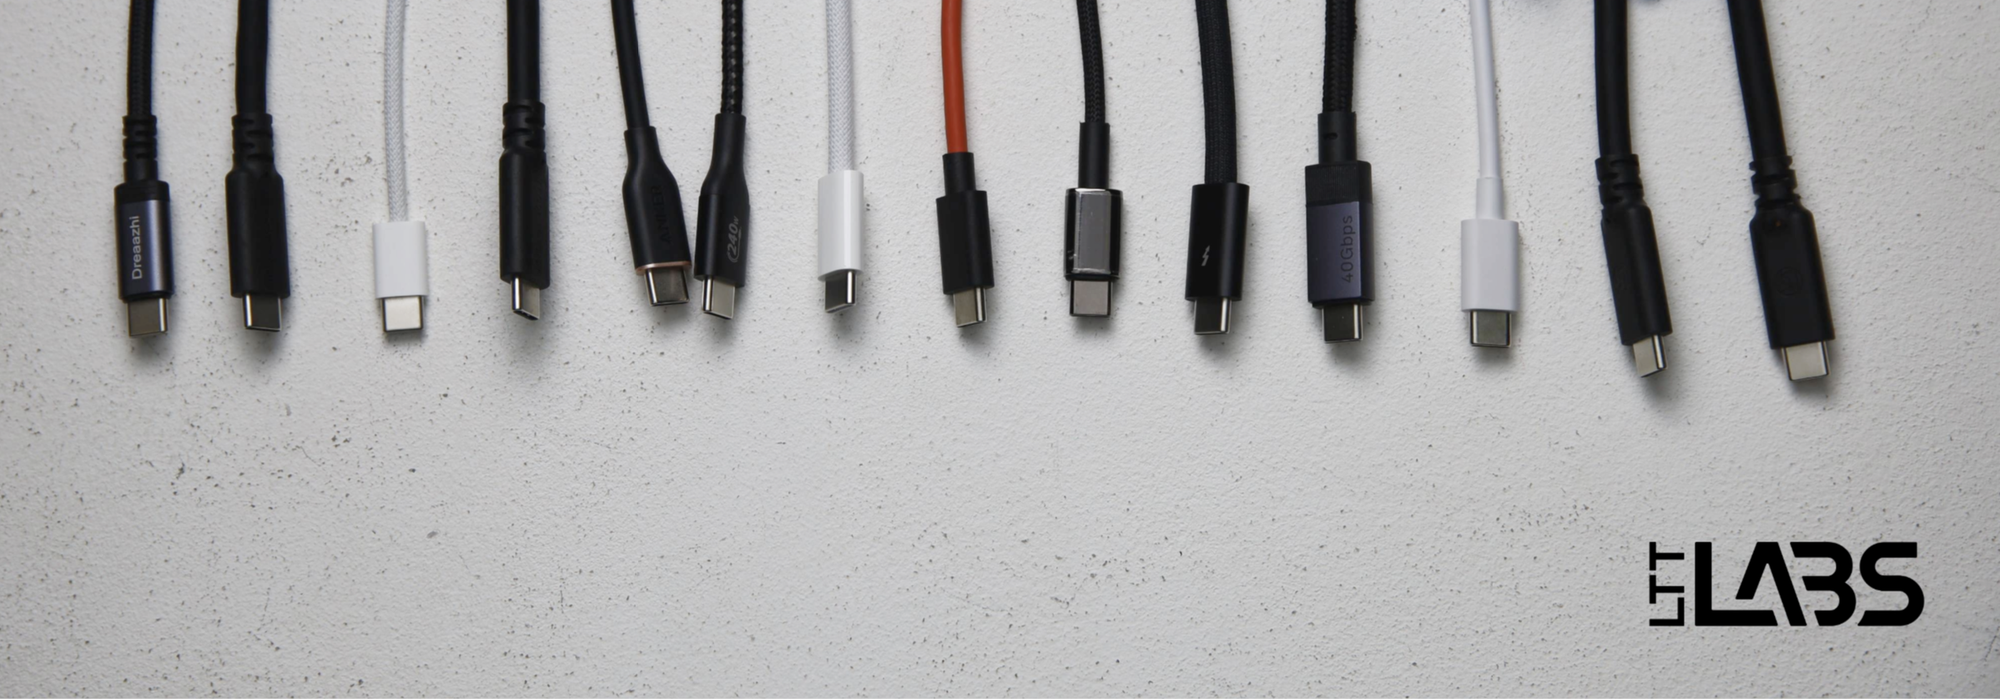
Cables Tested
Below is a list of all of the cables that we tested. The diameters were measured at multiple points along the cables and there is often a 0.1-0.2 mm variance. The lengths of the cables were measured between the strain reliefs, and to the nearest half centimeter. USB PD Standard Power Range(SPR) limits a cable to 21 V, while Extended Power Range(EPR) allows up to 48 V.
| Cable | Voltage Range | Data Speed | Measured Length [cm] | Measured Diameter [mm] |
| TrueSpec 0.1 m | EPR | 40 Gbps | 11.0 | 5.90 |
| TrueSpec 1.0 m | EPR | 40 Gbps | 101.0 | 5.90 |
| TrueSpec 2.0 m | EPR | 20 Gbps | 200.5 | 6.05 |
| TrueSpec 5.0 m | EPR | 480 Mbps | 501.5 | 5.25 |
| Google Pixel 10 Pro 1 m | SPR | 480 Mbps | 93.5 | 3.60 |
| UGREEN 240 W 1 m | EPR | 40 Gbps | 94.0 | 4.85 |
| Apple Thunderbolt 5 1 m | EPR | 80 Gbps | 94.0 | 5.70 |
| Baseus 100 W 1 m | SPR | 480 Mbps | 91.5 | 3.75 |
| REDMAGIC 11 Pro 1 m | SPR | unspecified | 93.0 | 9.35 |
| Apple Charge Cable 2 m | EPR | 480 Mbps | 190.5 | 4.45 |
| Belkin BoostCharge 1 m | EPR | 480 Mbps | 94.0 | 3.58 |
| Anker 240 W Flow Cord 1 m | EPR | 480 Mbps | 87.0 | 3.80 |
| Apple iPhone 17 Pro 1 m | SPR | 480 Mbps | 95.5 | 3.10 |
| Dreaazhi 5 m | EPR | 480 Mbps | 491.5 | 4.15 |
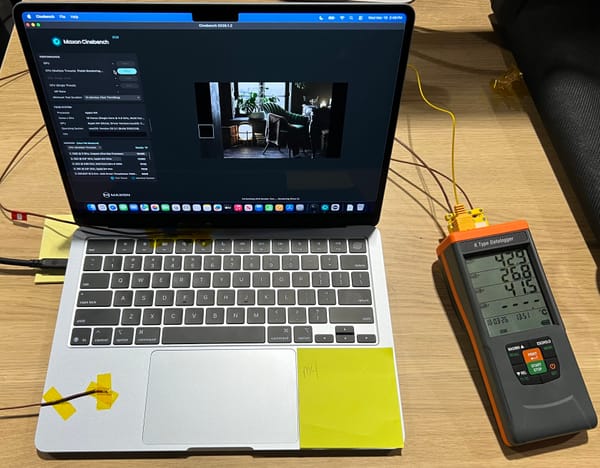
Test Setup
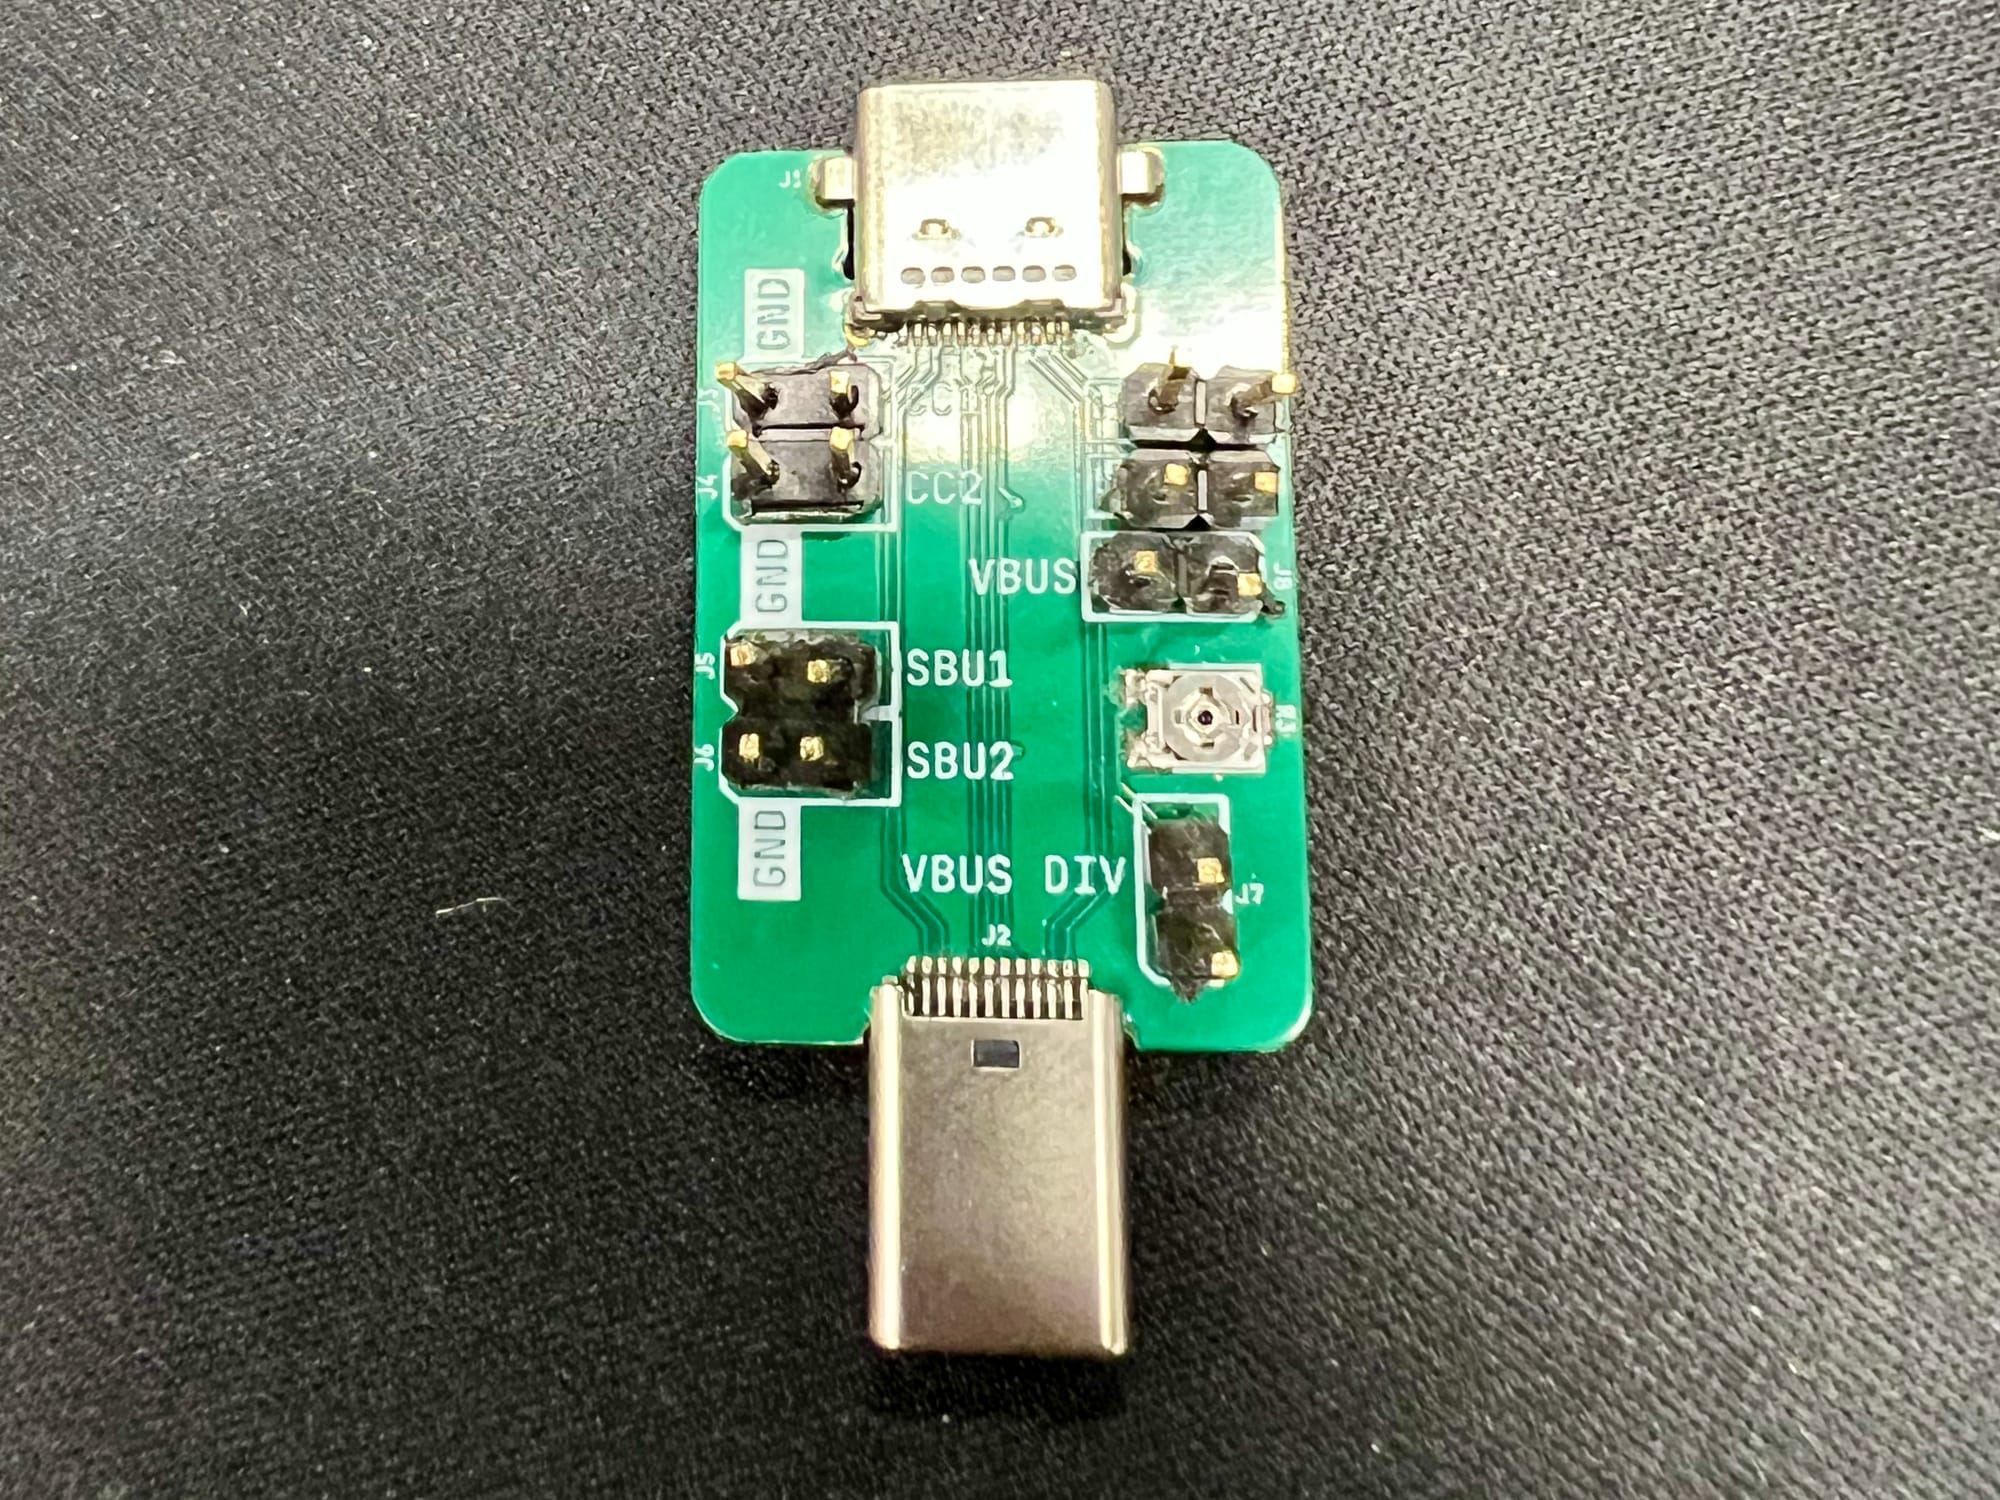
The test setup is very similar to our previous article(refer there for a full list of equipment), but slightly more complex as there are two configurations and we've added a USB-C breakout board. The breakout board allows the 'Remote Voltage Sense' cables of the programmable load to connect directly to either side of the Cable Under Test(CUT) and measure more representative voltages.
Remote Voltage Sense(Vsense)
For direct current(DC) signals, the voltage drop of a conductor is predominantly governed by Ohm's Law, V = I * R. When measuring the voltage at a point in a circuit, each cable/connection that either has a resistance or carries a current will introduce a voltage drop and affect the voltage that is measured.
This means that if we're using the same electrical connection from the programmable load to pull the 5 A load and measure the voltage, the measurements will be affected by the voltage drop of the connection, not just the cable under test. To minimize the effect of the measurement connection we have to minimize either the resistance, or the current.
'Remote Voltage Sensing'(Vsense) connections are two additional connections {{tooltip: This four wire connection method is also used with other equipment like voltage sources and ohmmeters.}} from the load{{/tooltip}} to the device under test that provide an alternate electrical path for measurement. The main connections are responsible for drawing the current(up to 5 A in this case), while the Vsense connections carry virtually no current, minimizing the voltage drop of the measurement connection.
In this test setup, we use the Vsense connections to measure the voltage at various points of the circuit and isolate the voltage drop of the cable under test. In the "Source Configuration" the breakout board and Vsense connections are placed at the USB-C power source, while in the "Sink Configuration" the breakout board and Vsense connections are placed at the trigger board.
Setup Diagrams
The block diagrams for the Source and Sink Configurations are shown below.
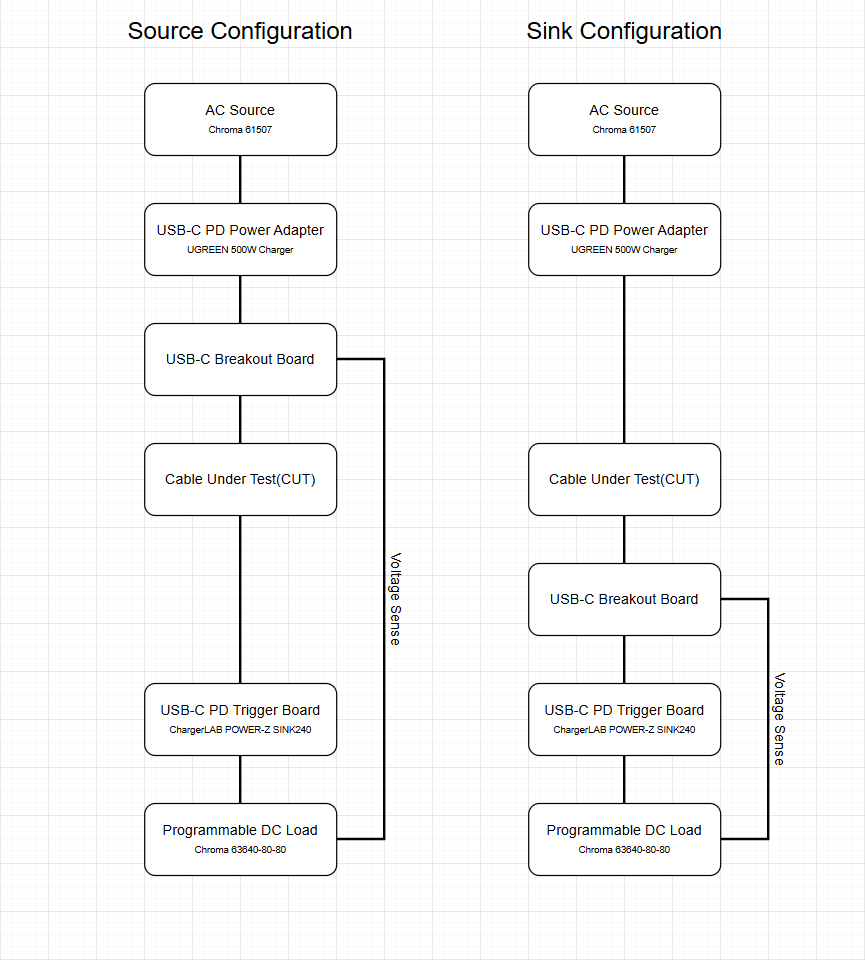
Comparing the voltage measured directly on either side of the cable isolates the voltage drop due to the cable itself(and whatever small effect the breakout board has). Despite measuring the two ends of the cable on separate runs, automation of testing with the Chroma PowerPro 5 software allows us to apply the test very consistently. This is explored further in the appendix.
Testing was conducted with a fixed 5 V output up to the maximum of 3 A, as well as a 20 V output up to the maximum of 5 A.
Results
This first set of graphs is similar to the graphs presented in the previous article, however, this measurement setup and procedure have been refined to isolate the voltage drop of the cable. Voltage drop is shown for 5 V output(with a limit of 3 A) and 20 V output(with a limit of 5 A). We'll focus on the 20 V results as the 5 V current range is a subset of the 20 V current range.
We have applied a different colour scheme for these graphs because there are many distinct models(although all TrueSpec cables are LTT orange). Hopefully this improves legibility, but they may require some studying.
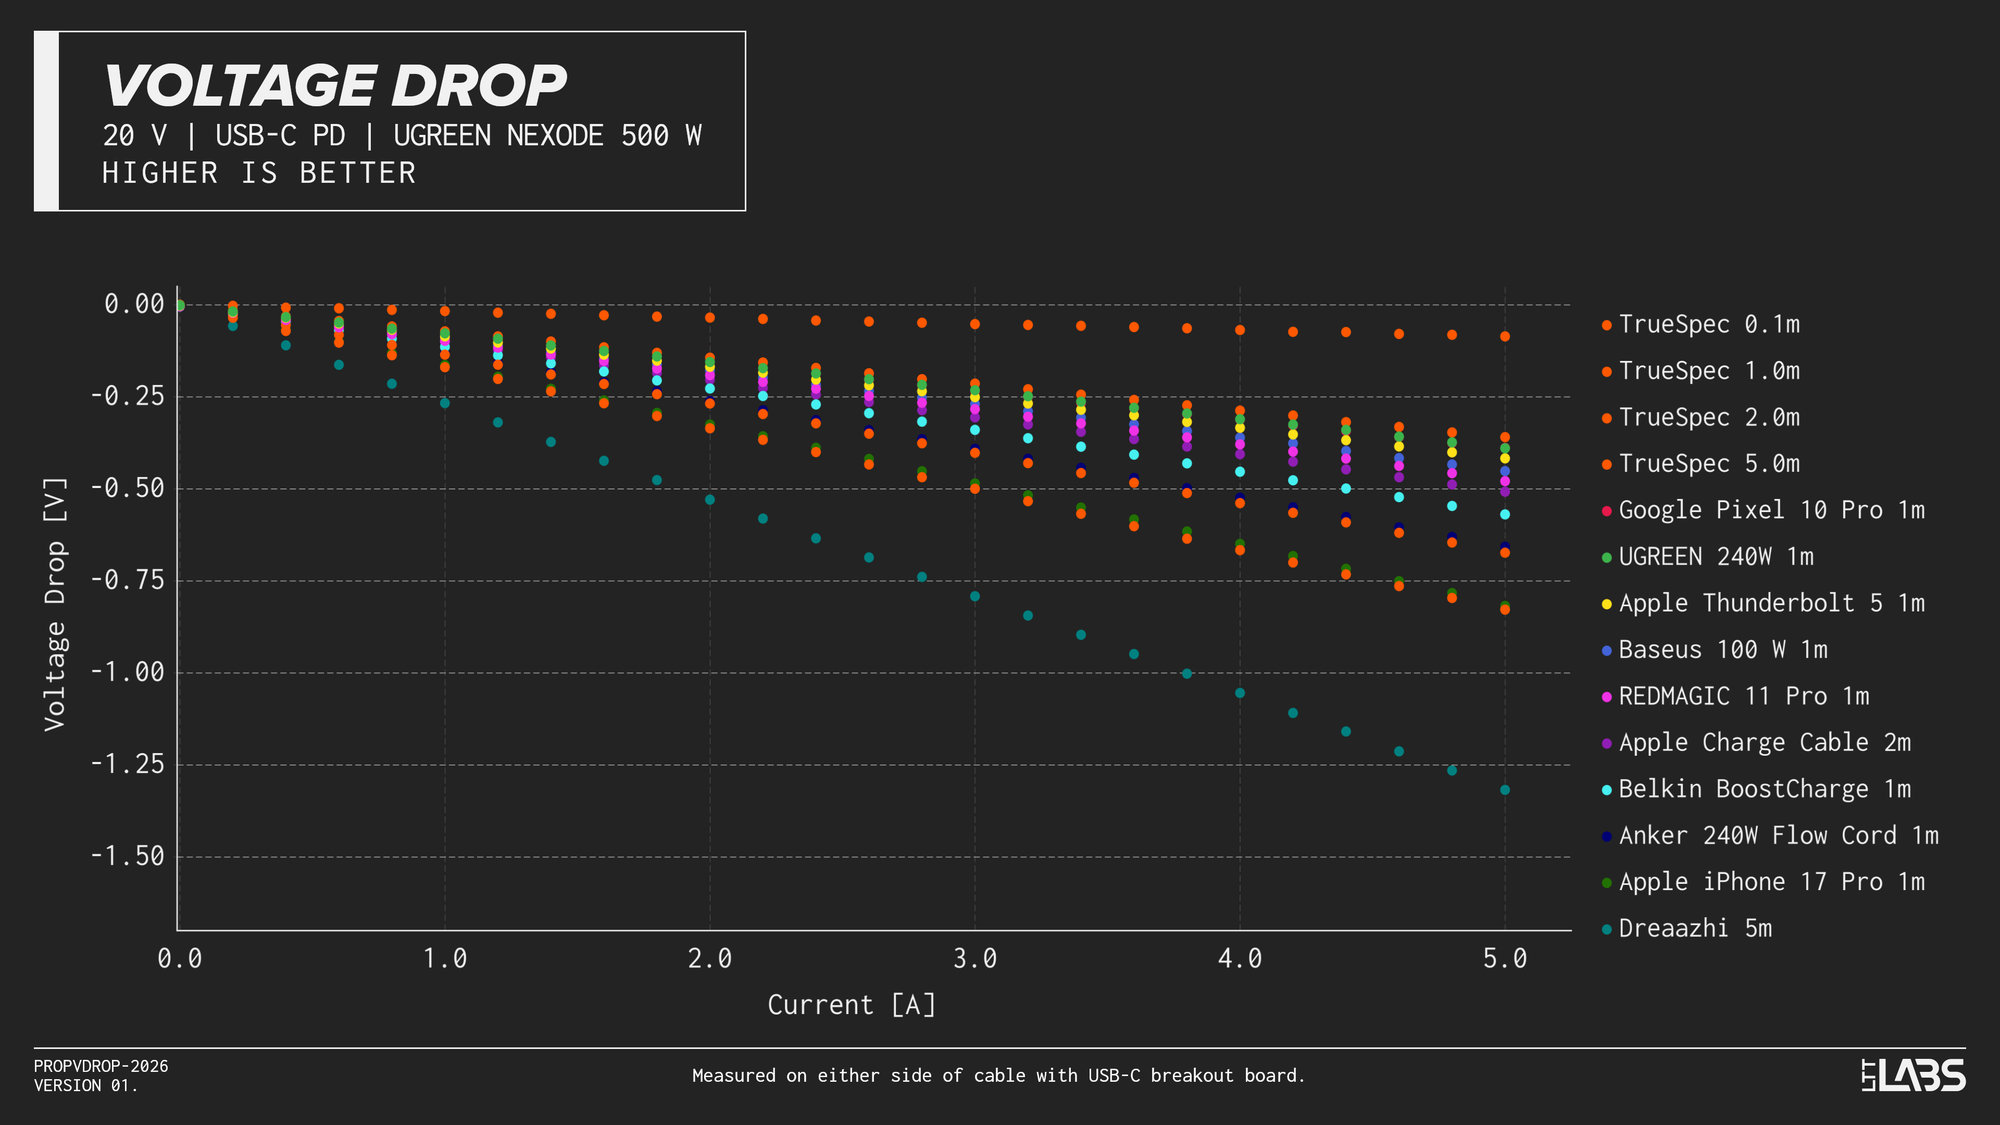
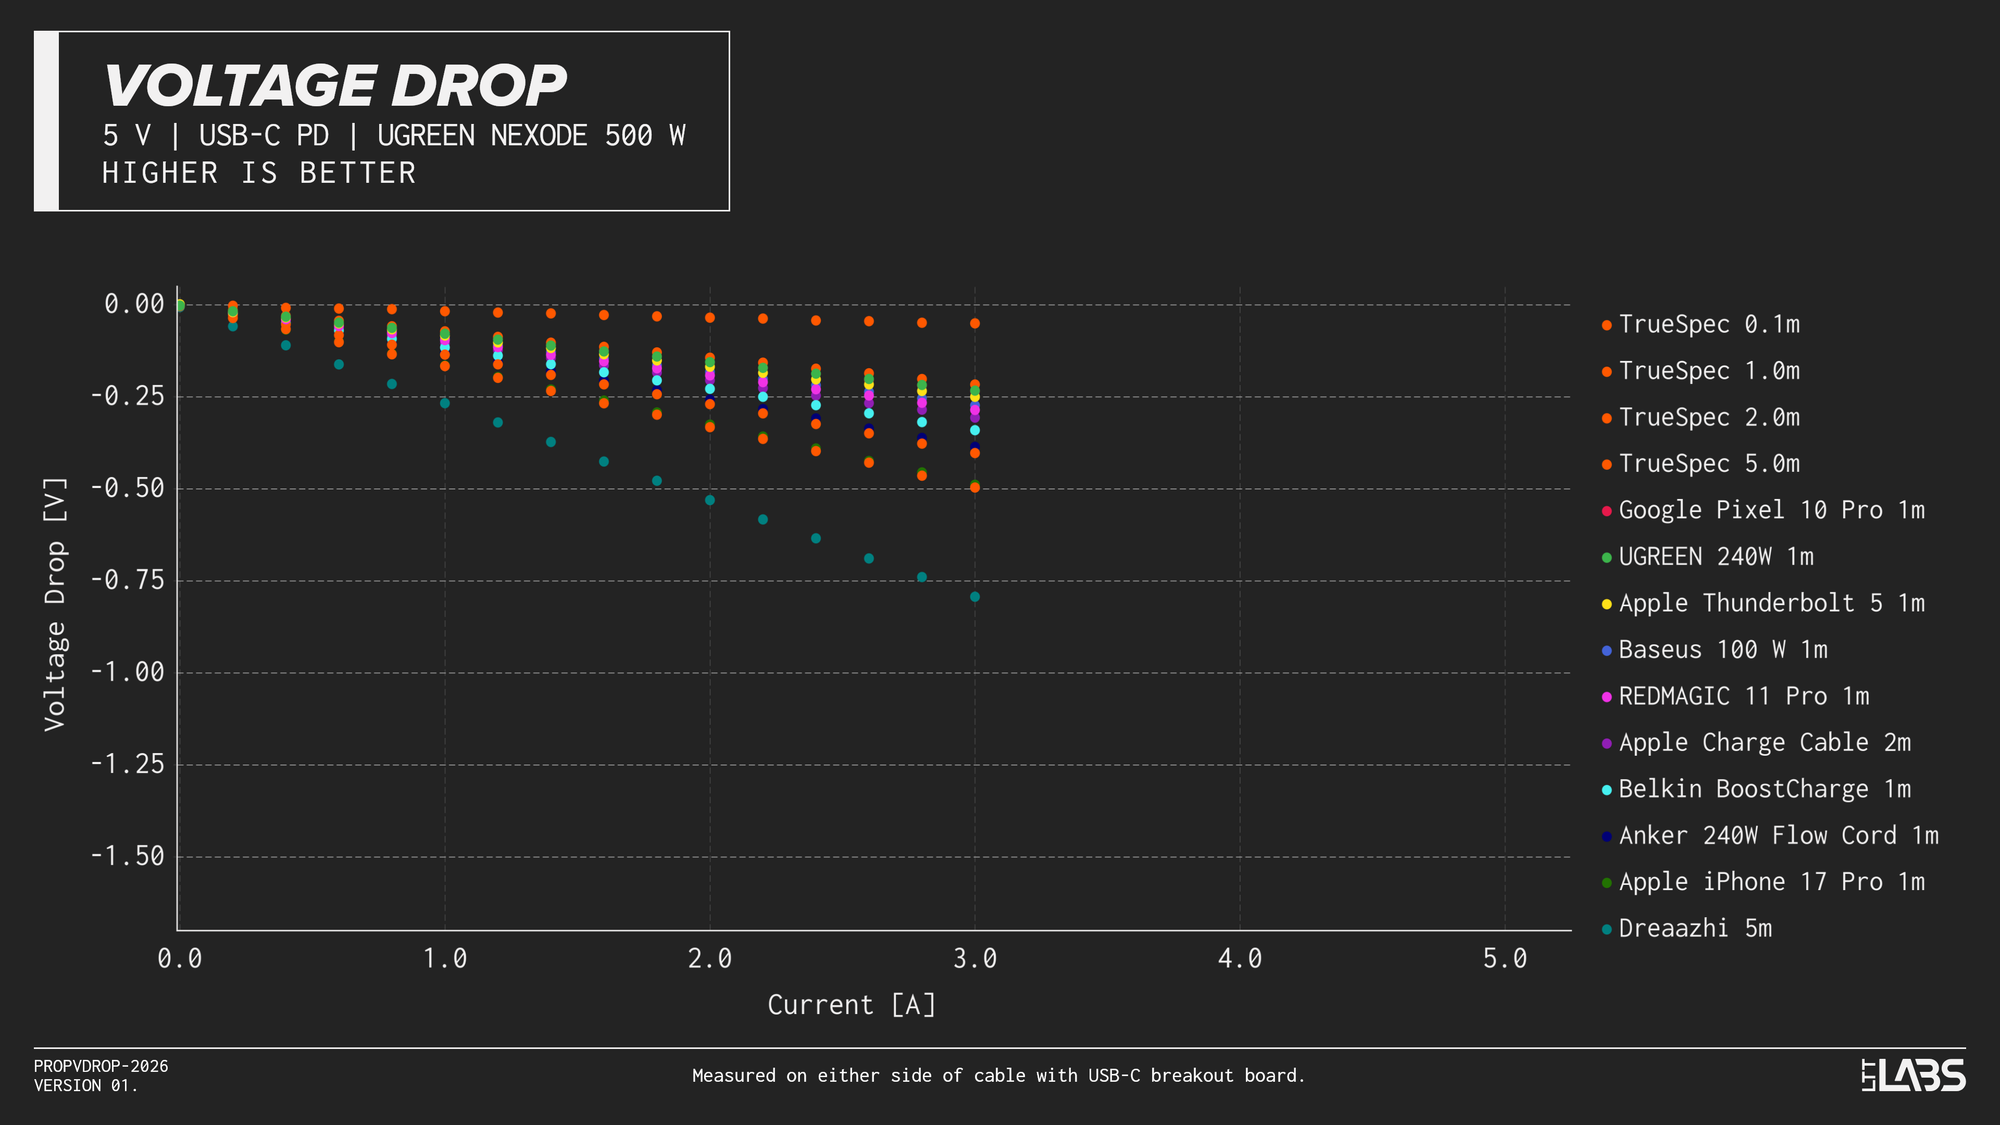
{{slide}}20 V Voltage Drop Results{{/slide}}{{slide}}5 V Voltage Drop Results{{/slide}}
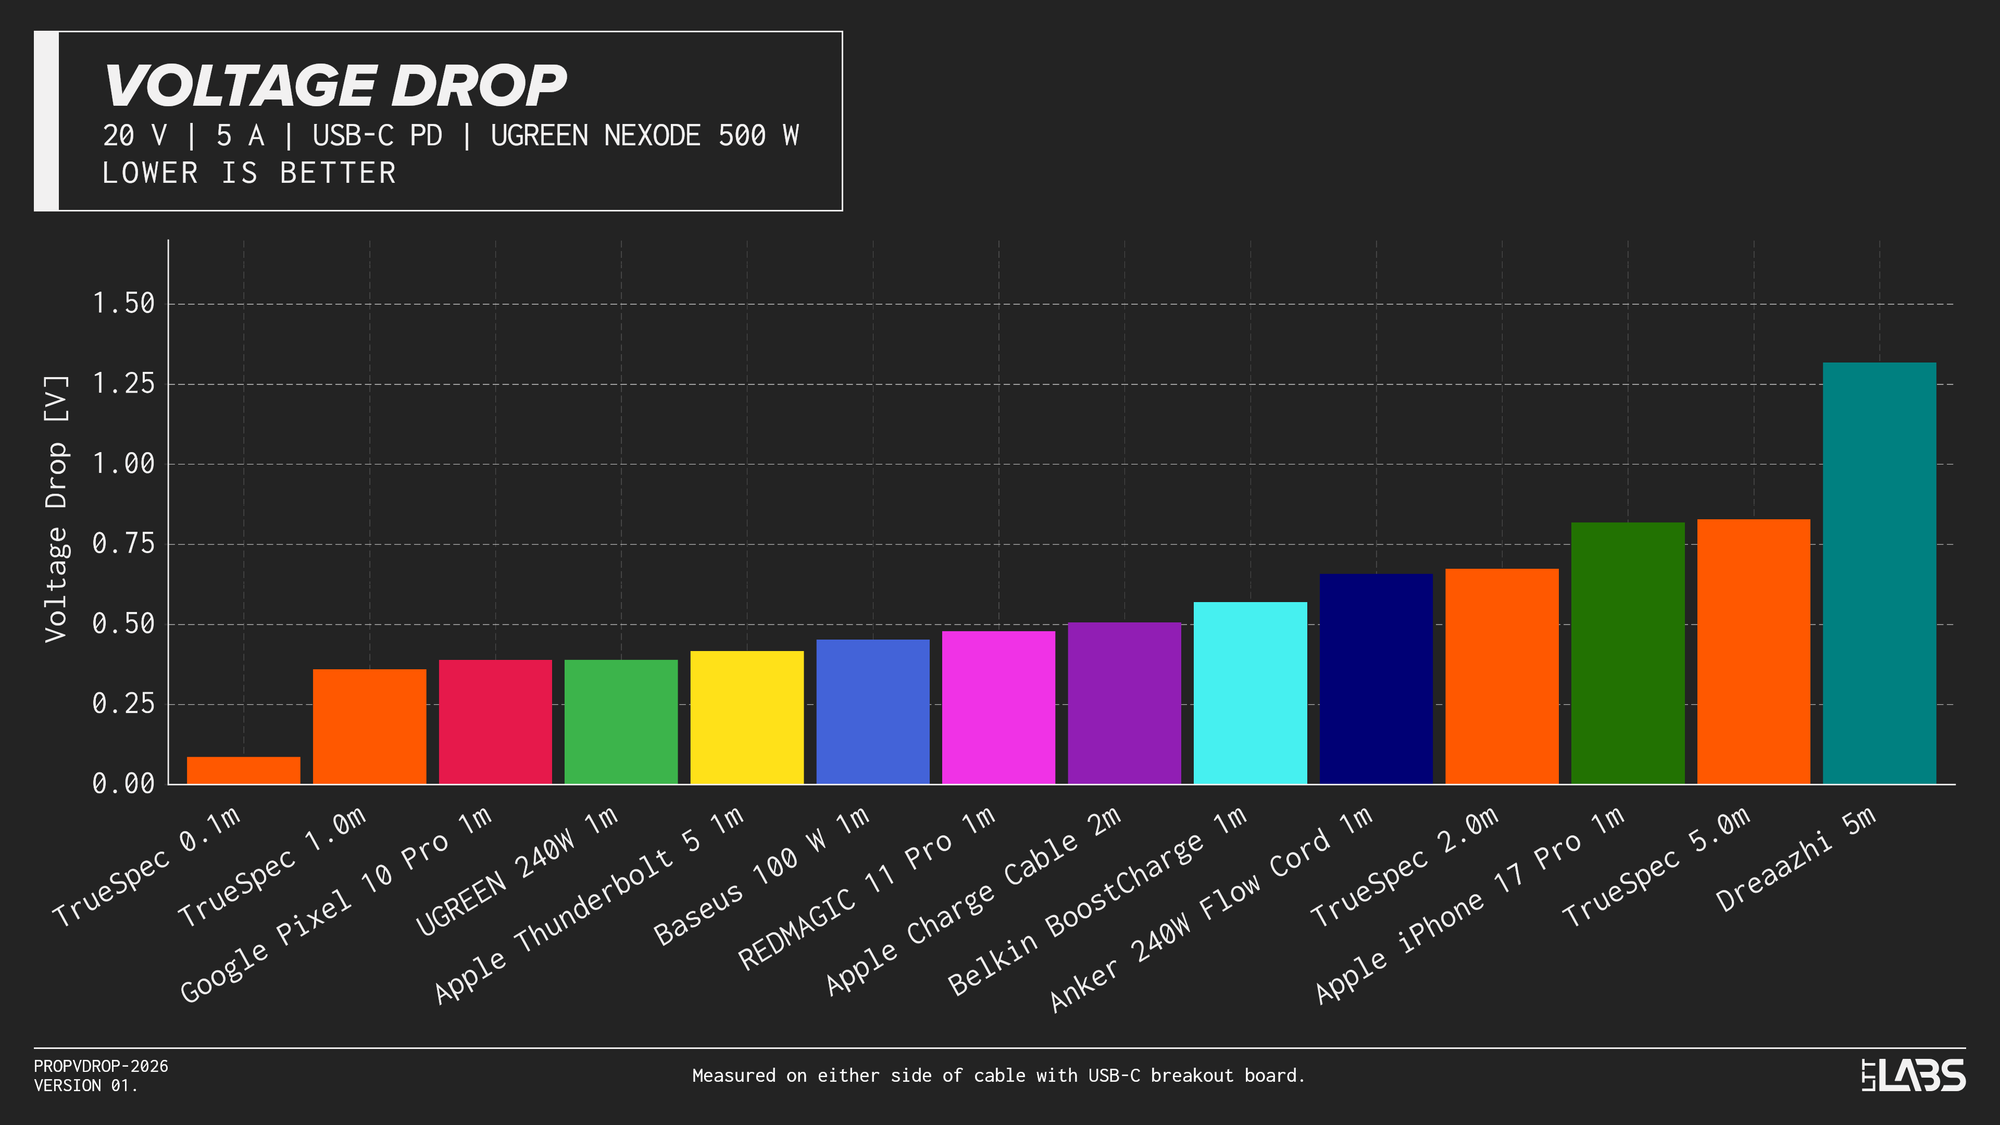
Comparing the voltage drop of all cables when delivering 5 A at 20 V, we see the maximum voltage drop measured with each cable.
Additionally, using the measured lengths of the cables, the graph below shows the voltage drop of each cable(with 5 A applied) with respect to the length between the connectors. The first plot in the carousel highlights the LTT TrueSpec cables while the second one separates all data.
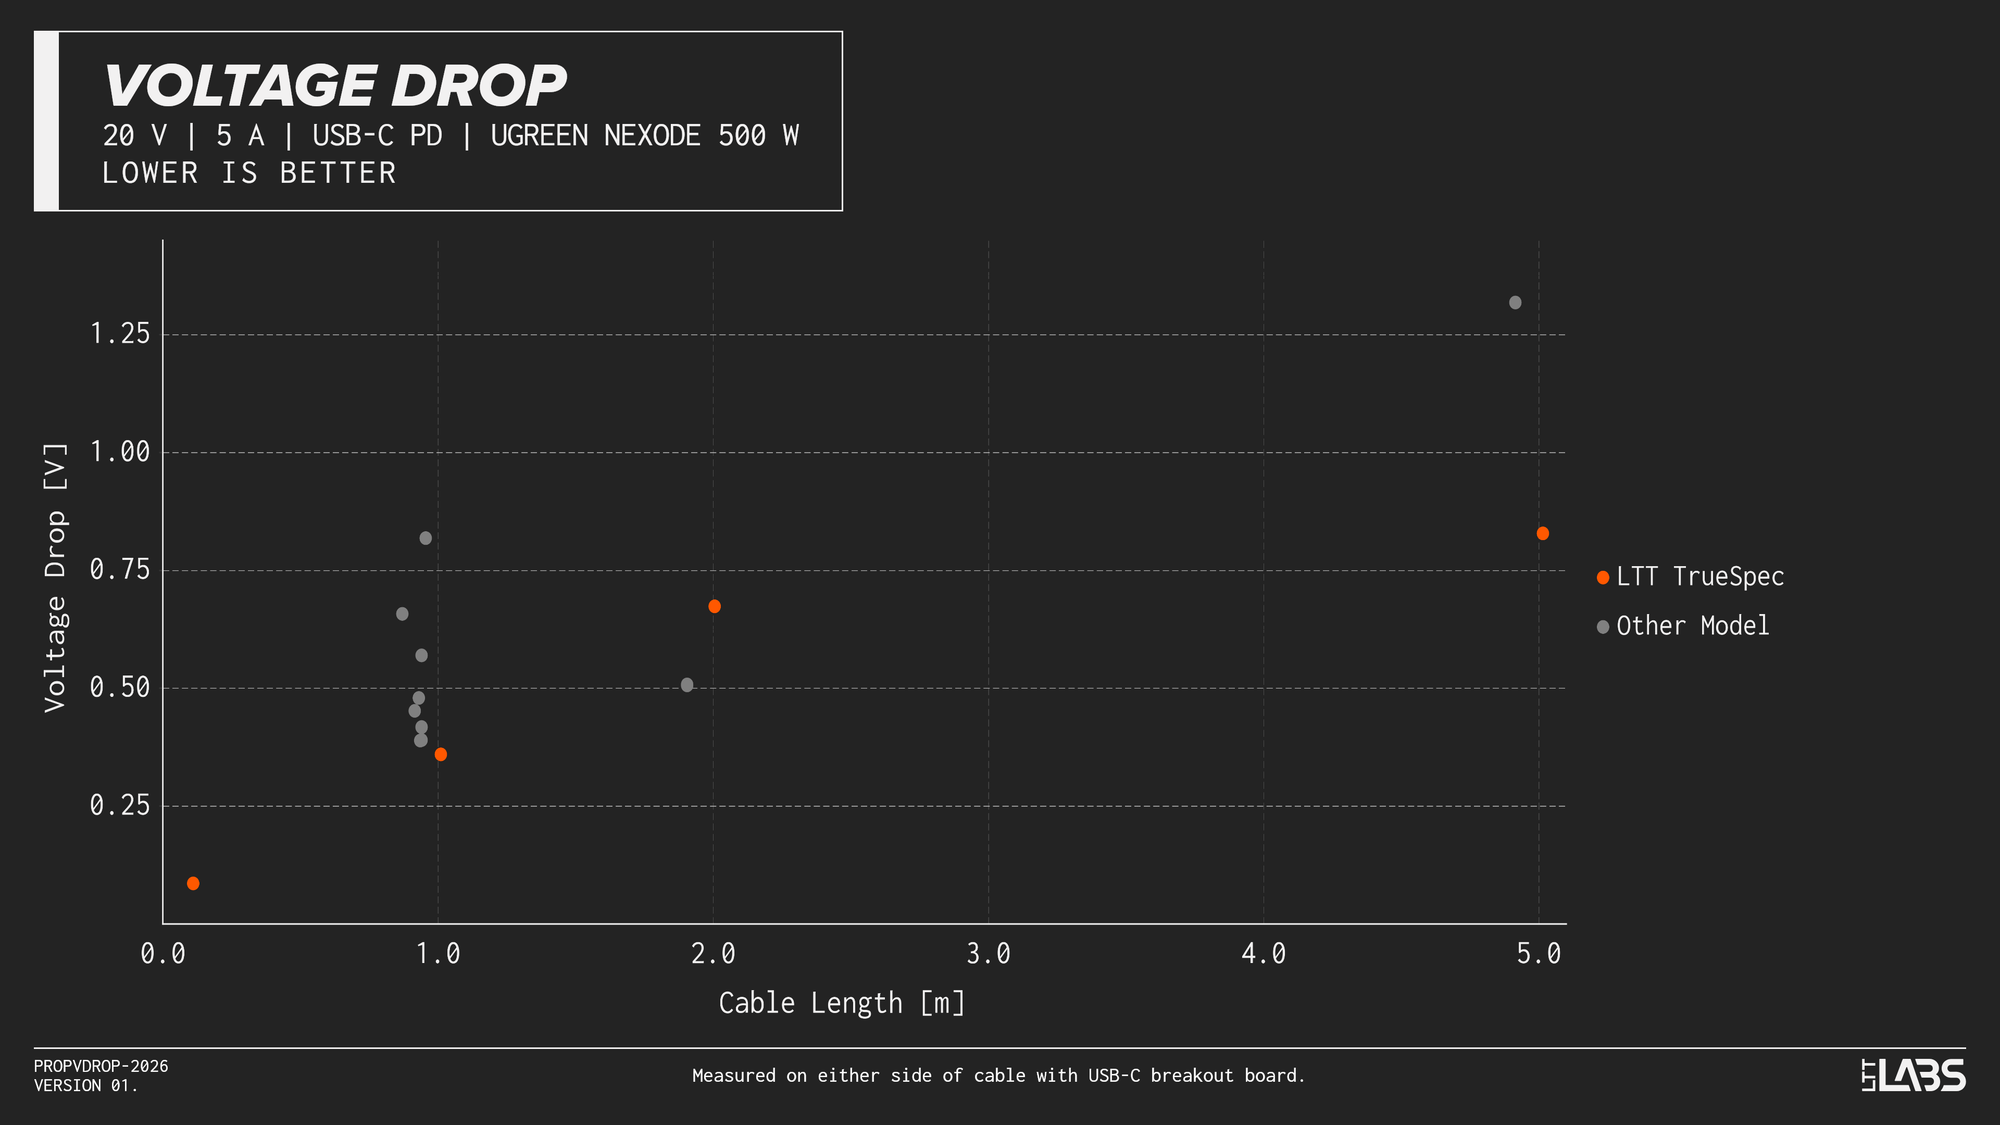
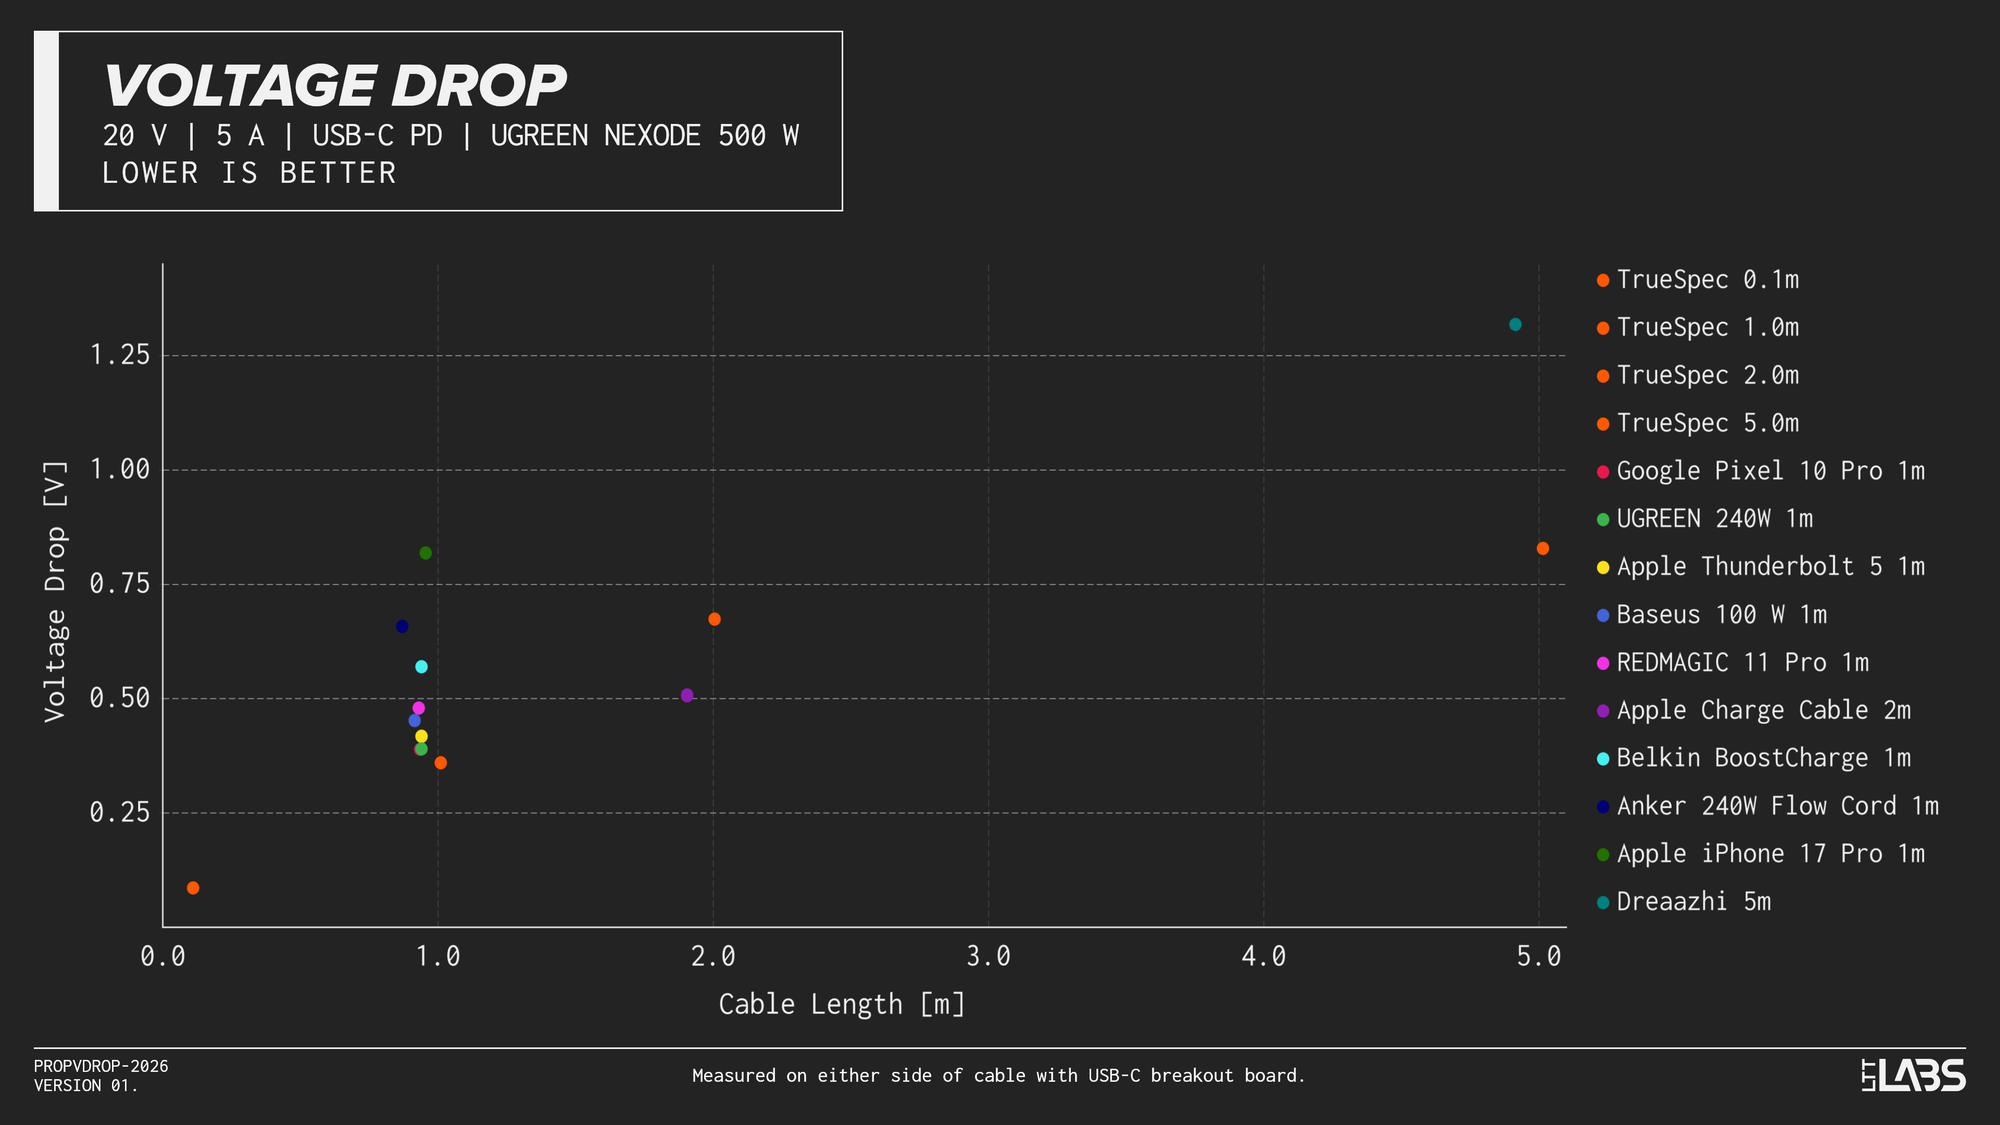
{{slide}}Voltage Drop vs. Cable Length - LTT TrueSpec Focus{{/slide}}{{slide}}Voltage Drop vs. Cable Length - All Data{{/slide}}
Finally, below is a table with the voltages measured for each cable, when delivering 0, 1, 2, 3, 4, and 5 A.
| Cable | Nominal Cable Length [cm] | 0 A Voltage Drop [V] | 1 A Voltage Drop [V] | 2 A Voltage Drop [V] | 3 A Voltage Drop [V] | 4 A Voltage Drop [V] | 5 A Voltage Drop [V] |
| TrueSpec 0.1m | 10 | 0.001 | 0.018 | 0.035 | 0.052 | 0.069 | 0.086 |
| TrueSpec 1.0m | 100 | 0.002 | 0.072 | 0.144 | 0.216 | 0.288 | 0.360 |
| Google Pixel 10 Pro 1m | 100 | 0.002 | 0.079 | 0.157 | 0.235 | 0.312 | 0.389 |
| UGREEN 240W 1m | 100 | 0.002 | 0.078 | 0.156 | 0.233 | 0.311 | 0.390 |
| Apple Thunderbolt 5 1m | 100 | 0.001 | 0.085 | 0.167 | 0.250 | 0.331 | 0.418 |
| Baseus 100 W 1m | 100 | 0.002 | 0.091 | 0.181 | 0.272 | 0.361 | 0.452 |
| REDMAGIC 11 Pro 1m | 100 | 0.004 | 0.097 | 0.192 | 0.285 | 0.379 | 0.479 |
| Belkin BoostCharge 1m | 100 | 0.001 | 0.115 | 0.228 | 0.340 | 0.454 | 0.570 |
| Anker 240W Flow Cord 1m | 100 | 0.004 | 0.131 | 0.260 | 0.389 | 0.524 | 0.658 |
| Apple iPhone 17 Pro 1m | 100 | 0.004 | 0.165 | 0.326 | 0.487 | 0.650 | 0.818 |
| Apple Charge Cable 2m | 200 | 0.001 | 0.103 | 0.203 | 0.306 | 0.406 | 0.507 |
| TrueSpec 2.0m | 200 | 0.003 | 0.136 | 0.269 | 0.403 | 0.539 | 0.674 |
| TrueSpec 5.0m | 500 | 0.004 | 0.168 | 0.334 | 0.498 | 0.667 | 0.828 |
| Dreaazhi 5m | 500 | 0.006 | 0.267 | 0.530 | 0.793 | 1.055 | 1.318 |
Observations
I will present some statements that I believe can be drawn from this data. These will focus on the TrueSpec cables as they are the subject of this article, but there is also some interesting data about other cables. Please also draw your own conclusions.
As expected, we see that shorter cables introduce a smaller voltage drop as they typically have a smaller resistance. However, there are some long cables that introduce a smaller voltage drop than shorter ones. This can be seen with the 2 m Apple 240W Charging Cable. It has a smaller total resistance than the Apple iPhone, Anker, and Belkin 1 m cables. It also introduces less of a voltage drop than the 2 m LTT TrueSpec cable.
Of the 1 m cables, the LTT TrueSpec cable introduces the smallest resistance. It is also worth noting that the LTT TrueSpec is also the only 1 m cable that actually achieves 1 m between the connectors.
Besides the LTT TrueSpec cable, the 1 m cables that introduce the smallest voltage drop(correlating with larger or higher quality conductors) are the Google Pixel 10 Pro 1 m, UGREEN 240 W 1 m, and Apple Thunderbolt 5 1 m.
You can see that the LTT TrueSpec cables of 0.1 m, 1.0 m, and 2.0 m use the same gauge of current carrying conductors, producing a linear voltage drop trend with increasing cable length. The 5.0 m variant uses larger conductors, not following that trend, otherwise it would have a much higher voltage drop.
The 1 m Apple charging cable that ships with new iPhones has quite a high voltage drop. It has the same voltage drop as the 5.0 m LTT TrueSpec cable. It is quite flexible, so they've likely made an intentional tradeoff for that benefit.
The Dreaazhi 5 m cable isn't particularly expensive and doesn't feel especially high quality, but considering the length, it appears to have relatively low resistance. With a voltage drop of 1.318 V when delivering 5 A, it remains above the minimum voltage specification of USB-C PD.
Does this Matter?
This brings us to a similar conclusion as the previous article: it is unlikely that this level of voltage drop in a USB-C cable will have a major impact when charging your phone or laptop. Cables with higher voltage drop will leech off some power as you charge, but it will likely be below 5% of the total when operating at 5 A.
Furthermore, some devices can now negotiate in the Programmable Power Supply(PPS) and Adjustable Voltage Supply(AVS) modes which allow the device being charged to request specific voltages. This allows them to optimize the voltage(in 20 mV or 100 mV steps) that they're receiving so that they can convert the power or charge batteries more efficiently. Another benefit of this is that the device being charged can compensate for any cable voltage drop by simply requesting a slightly higher voltage.
However, cables with low voltage drop can provide more of a benefit in voltage sensitive applications. Some test & measurement equipment, audio equipment, and single-board computers are far more sensitive to voltage fluctuations. The voltage drop they experience when drawing a high load could affect performance. This may also be the case with budget equipment that doesn't incorporate a lot of protections or power conditioning components.
Appendix
Ideally, and maybe in a future setup, we would measure the input and output voltage of the USB-C cable at the same time. However, our current setup is limited to only measuring one of these values at a time, requiring separate sweeps through the current range to measure the voltage at the two ends of the cable. This could introduce error to our measurements and conclusions if the input voltage or applied load differed significantly between measurements.
For the testing of each cable, a sweep of the current range(3 A or 5 A) was run with the USB-C breakout board on either end of the cable. We observed that the output voltage of the USB-C power source(UGREEN 500W Power Adapter) and the load drawn by the Chroma 63640-80-80 programmable DC load were extremely consistent.
Current Drawn
It is important that the current drawn through the cables is equal for the two configurations of the test setup. The table below shows the measured current draw for the Sink and Source test configurations in the bottom two rows, with a column for each cable tested.
For perfect comparisons between runs, for each column we expect to see the number in the bottom row equal to the number in the penultimate row. The largest difference in the table is 0.0009 A at 5 A output. This is 0.018% of the full 5 A range and introduces negligible error.
Voltage Applied
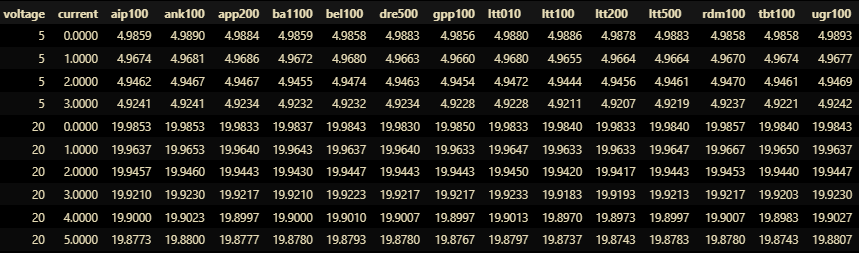
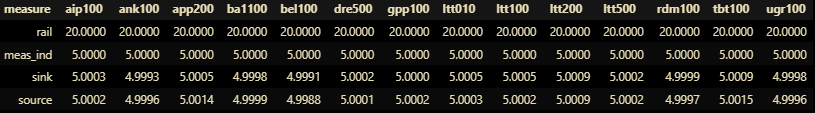
Additionally, the voltage applied to the source side of the cable should be consistent between runs. The table below shows the measured input voltage of the cables in the Sink Configuration for the 5 V and 20 V tests, at a variety of current loads. The columns represent the cables tested.
For perfect comparisons between runs, we expect to see the numbers in each row equal to each other, showing that the voltage applied by the power source is consistent and only dependent on the output current. The column names are shorthand specifiers for the cables. Here we see the measured voltages spanning a maximum of 0.007 V, 0.035% of the full 20 V range. This again introduces negligible error for this testing and precision.