Who Is High-Speed DDR5 Memory Actually For?
These are some tough times for PC builders. Not long ago, a 32GB DDR5 kit cost around $100, but with the current RAM prices that is no longer true. We did some tests to find out who would benefit the most from faster memory speeds.
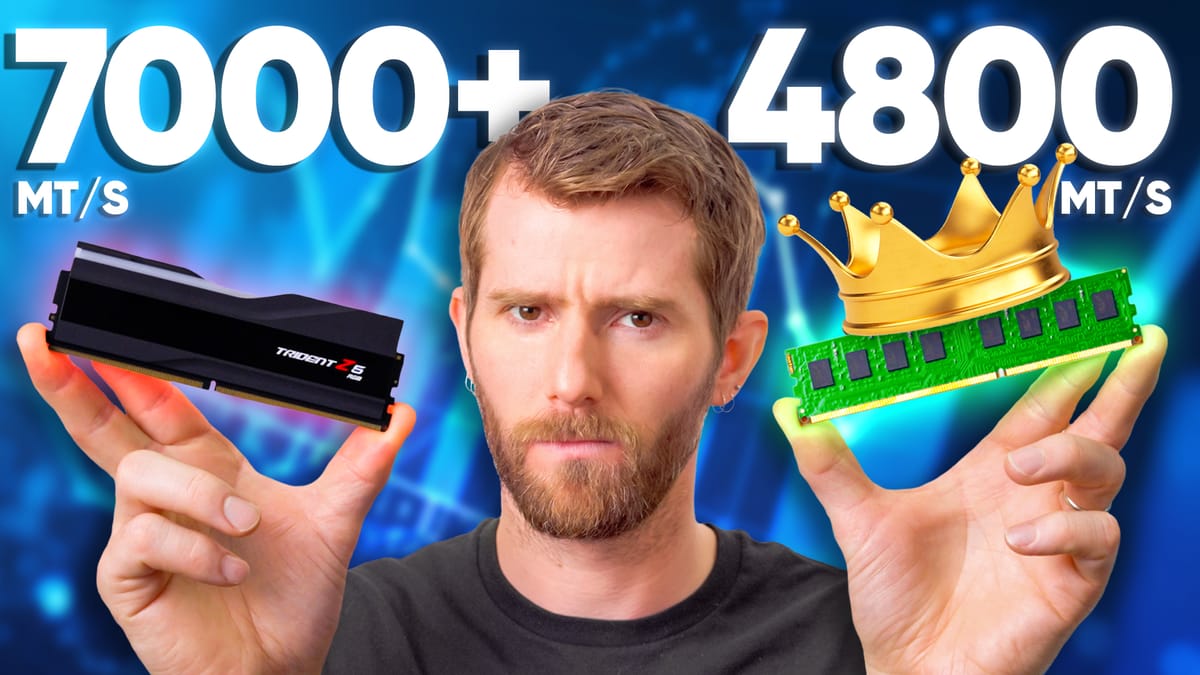
These are some tough times for PC builders. Not long ago, a 32GB DDR5 kit cost around $100, and stepping up to something faster like 6000MT/s instead of 5200MT/s was often a $20 decision. Today, AI “demand” has pushed even basic kits toward $300, and moving from an entry-level 5600MT/s kit to a high-speed 7200-8000MT/s kit can add another $150-$300. At that point, memory speed isn’t a small optimization. It’s competing with a CPU tier jump, or in some builds, even a GPU upgrade.
Naturally, we wanted to know how much performance that extra couple thousand MT/s actually gets you and help you make the decision of getting the right kit for you. This article is a supplementary piece to the LTT video and as such it is a “data repository” of sorts to have all the data in one place for the viewers to refer to. Given how dynamic the current memory market is, any comments on the price to performance ratio of the kits will probably be rendered moot by the time you read this. So, we are going to focus primarily on the results of our performance testing. Prepare yourselves for a LOT of data.
Tested RAM Kits and Platforms
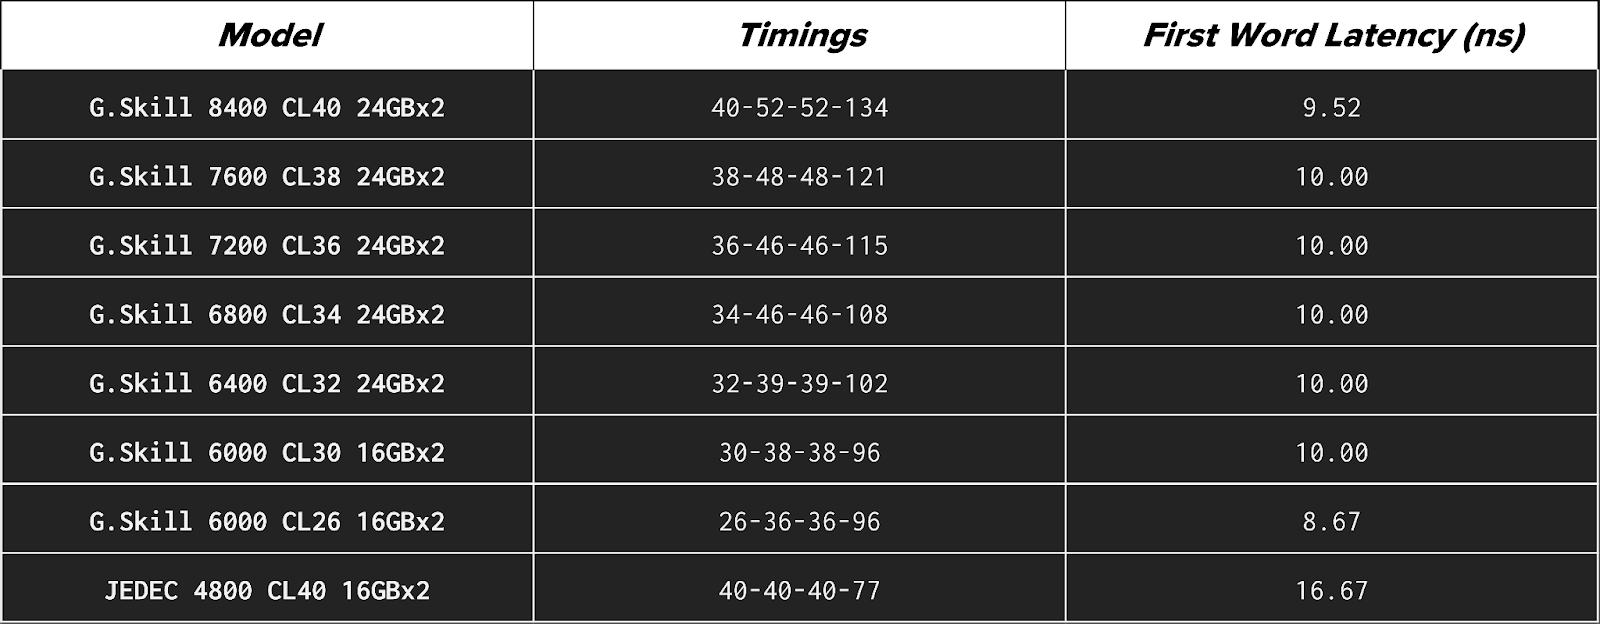
We used the following RAM kits in our testing:
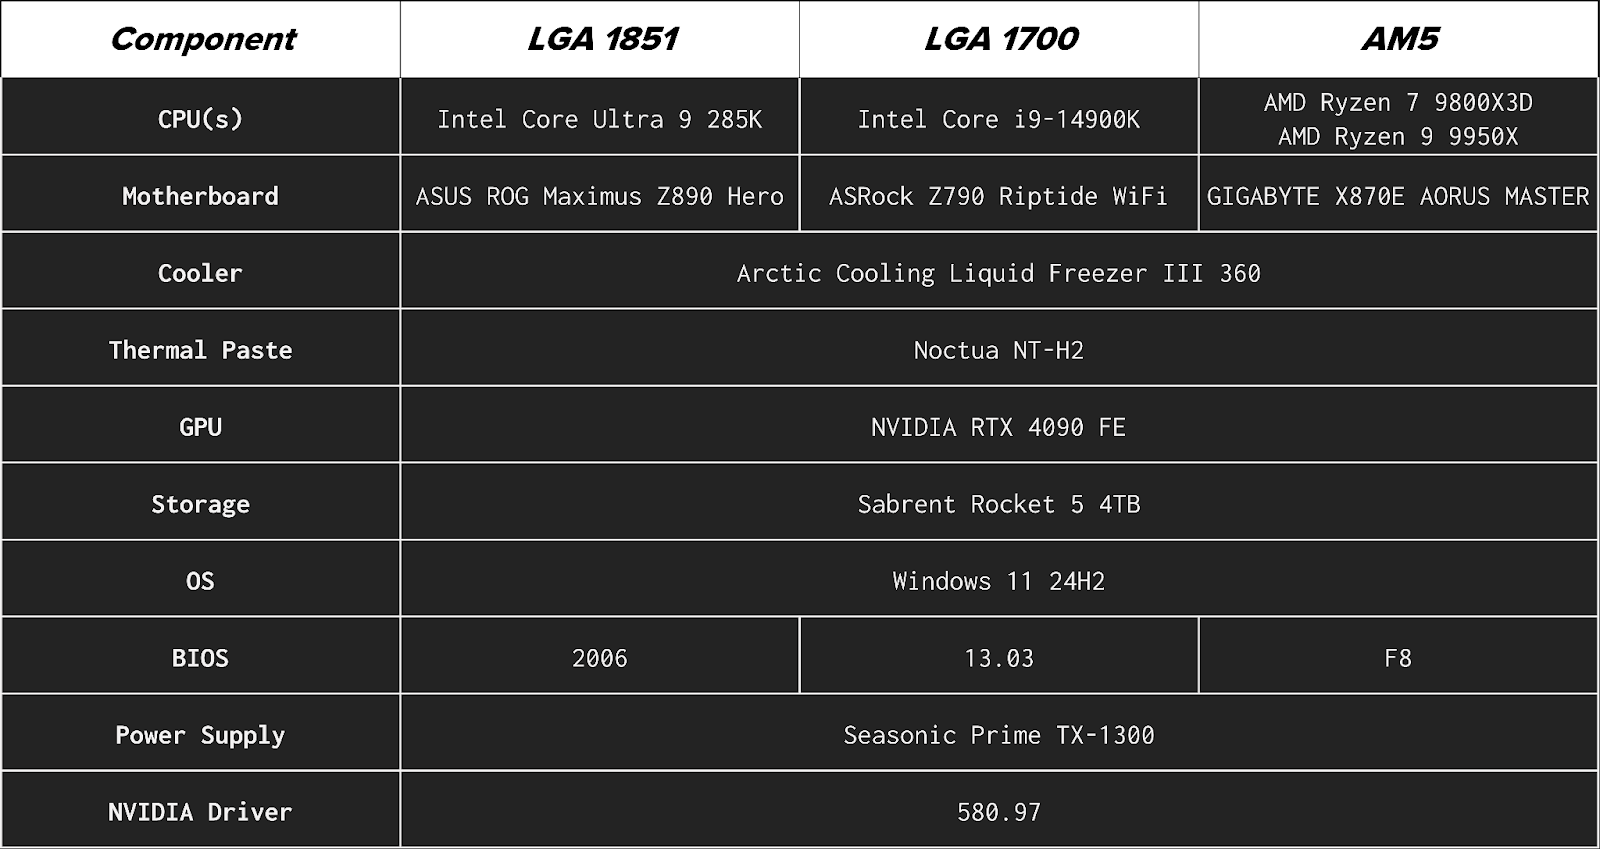
We used these configurations across four desktop platforms:
These represent both current and previous Intel and AMD architectures, including AMD’s 3D V-Cache design, to capture a range of memory sensitivity across modern gaming and productivity systems. Here is the full breakdown of the test bench configuration for each platform:
Tests and Results
A few things to note here to better interpret the results before we get to them:
- JEDEC (Joint Electron Device Engineering Council) speeds represent the “default”, specification-compliant performance that any compatible system should support out of the box. JEDEC is in most cases significantly slower because it prioritizes maximum compatibility and stability rather than performance.
- Theoretical First Word Latency estimates how long it takes for memory to deliver the first data after a request is made. It converts CAS (Column Address Strobe) latency (CL), which can be a little unintuitive to comprehend, into {{tooltip: real-time time?}}real time{{/tooltip}} in nanoseconds (ns) using the memory’s data rate in megatransfers per second (MT/s): Latency (ns) = (CL × 2000) / MT/s. You can also use this calculator available online. For everyday workloads, this is the most useful single latency indicator, as it {{tooltip:This is an approximation because real memory access also depends on other timings, such as Row-to-Column Delay (tRCD), Row Precharge Time (tRP), and Row Active Time (tRAS), as well as memory controller behavior and whether the requested data is already in cache. First Word Latency reflects only the initial column access delay, but it is the most useful single comparison metric.}}approximates{{/tooltip}} how quickly the system can begin servicing a memory request.
- Configurations at 6000 MT/s and below use 32GB (2×16GB), while higher-speed kits use 48GB (2×24GB) due to availability. Results should be interpreted primarily as speed scaling rather than direct capacity comparisons.
- All non-JEDEC configurations were tested using manufacturer-rated memory profiles rather than manual tuning. That means, AMD EXPO (Extended Profiles for Overclocking) and Intel XMP (eXtreme Memory Profile) were used wherever applicable but voltages were not tuned.
- For testing, Intel Dynamic Tuning Technology (DTT) was disabled on the Intel platforms to prevent it from influencing system behavior.
- Higher-speed configurations in this testing use 24GB modules (48GB total), which rely on newer high-density memory ICs. These higher-density DIMMs place greater electrical load on the memory controller and are still less mature in terms of platform tuning and BIOS optimization. As a result, high-frequency operation with 24GB modules can be more difficult to stabilize than traditional 16GB-based configurations. Consequently, we did notice some instances where the 16GB base module outperformed the 24GB modules.
- Not all systems could operate at the highest DDR5 speeds. Maximum achievable frequency is limited by the CPU’s integrated memory controller (IMC), motherboard signal integrity, and memory training behavior, which vary by architecture and platform. In testing, the Core Ultra 9 285K was unable to boot at 7600 or 8400 MT/s, AMD platforms (Ryzen 9 9950X and Ryzen 7 9800X3D) were unable to boot at 8400 MT/s, and 8400 MT/s was unstable in some gaming workloads on the Core i9-14900K. Only configurations that were stable enough to complete testing are included in the results.
- All testing was performed on standard four-DIMM slot consumer motherboards. While two-DIMM (1DPC or DIMMs Per Channel) boards can sometimes achieve higher stable memory frequencies due to shorter trace lengths and reduced electrical load, four-slot layouts represent the most common desktop configuration. Results should therefore be interpreted as representative of typical system behavior rather than maximum overclocking potential.
All workloads used are application-level benchmarks, so methodology and results are presented together and discussed by category.
Productivity
Productivity tests represent real-world applications and workflows commonly used for content creation, development, and local compute tasks.
Blender 4.5 (Monster CPU render)
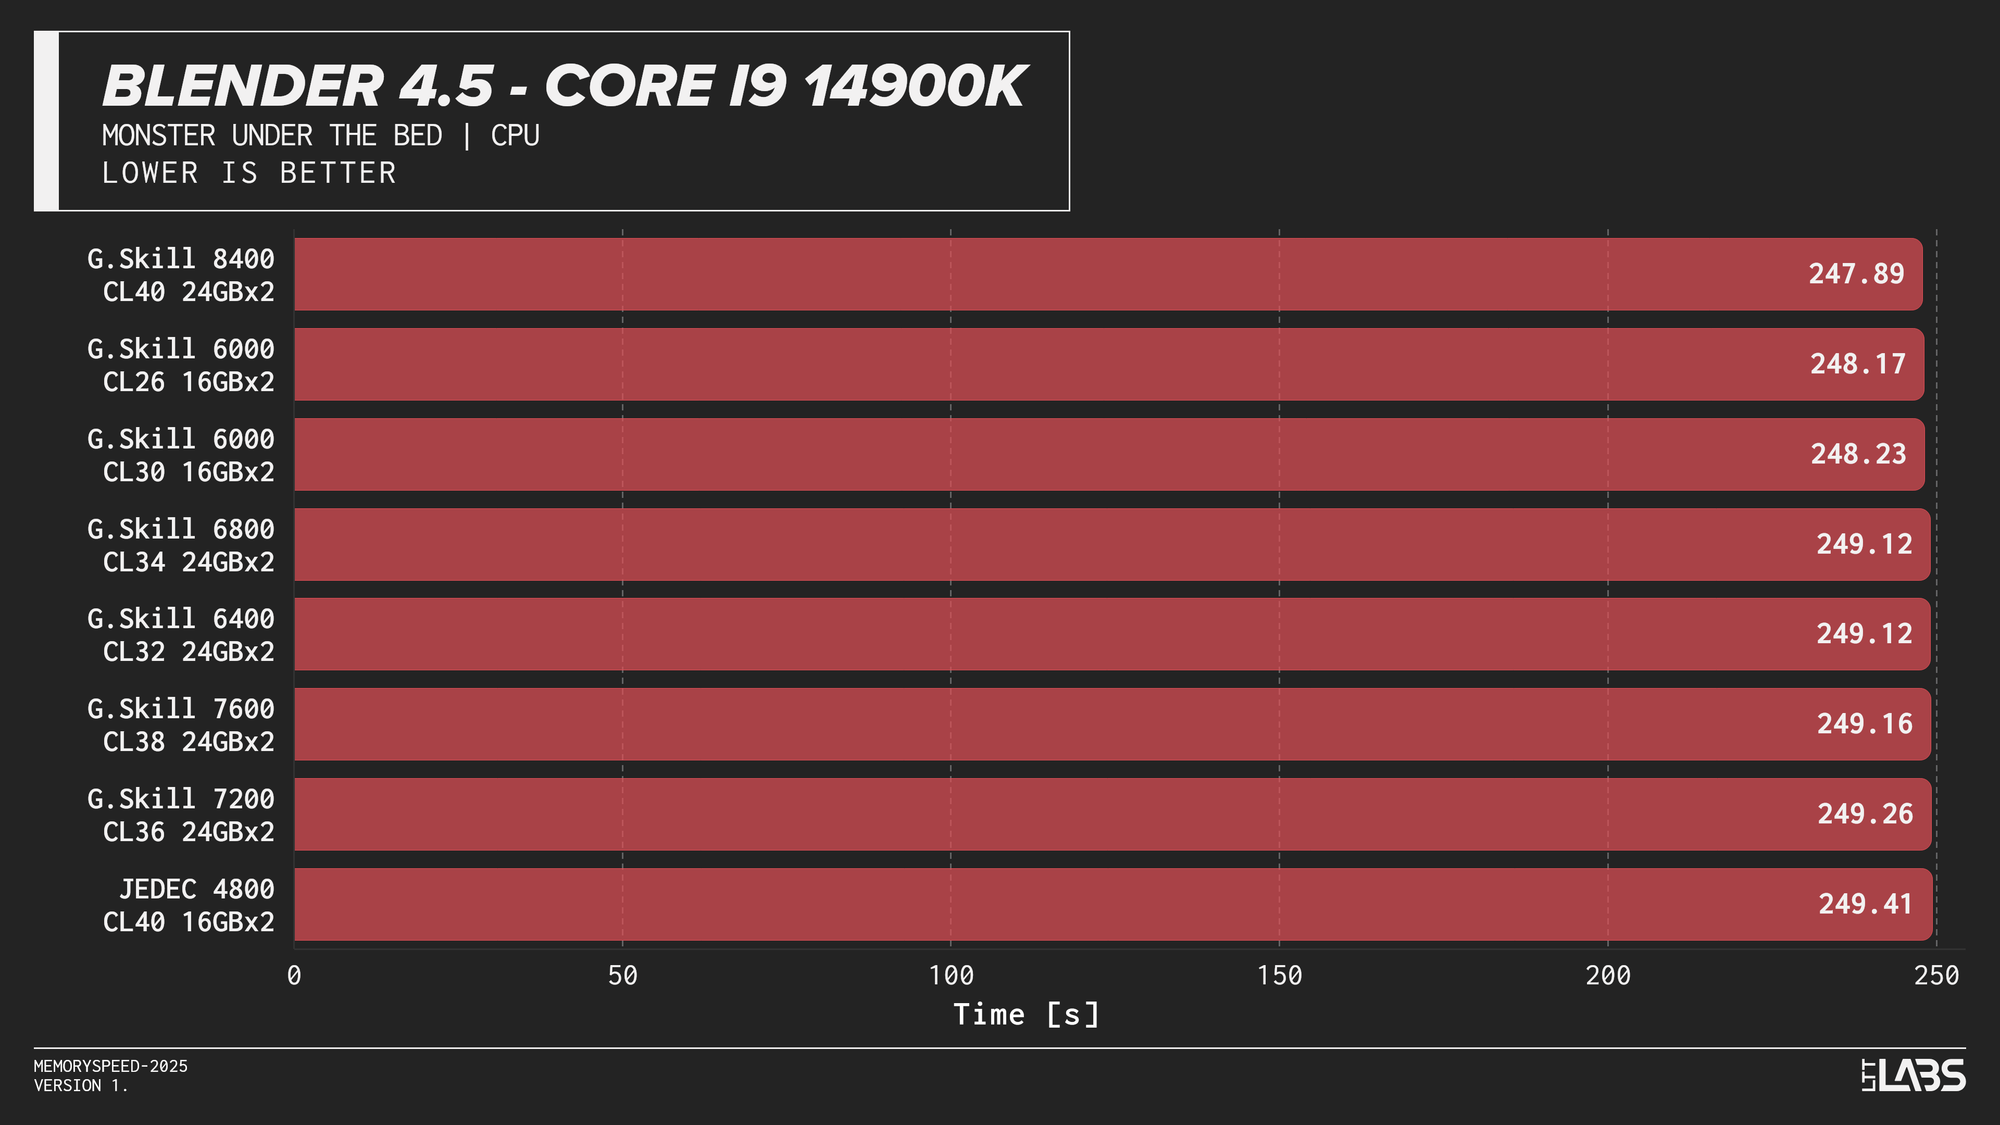
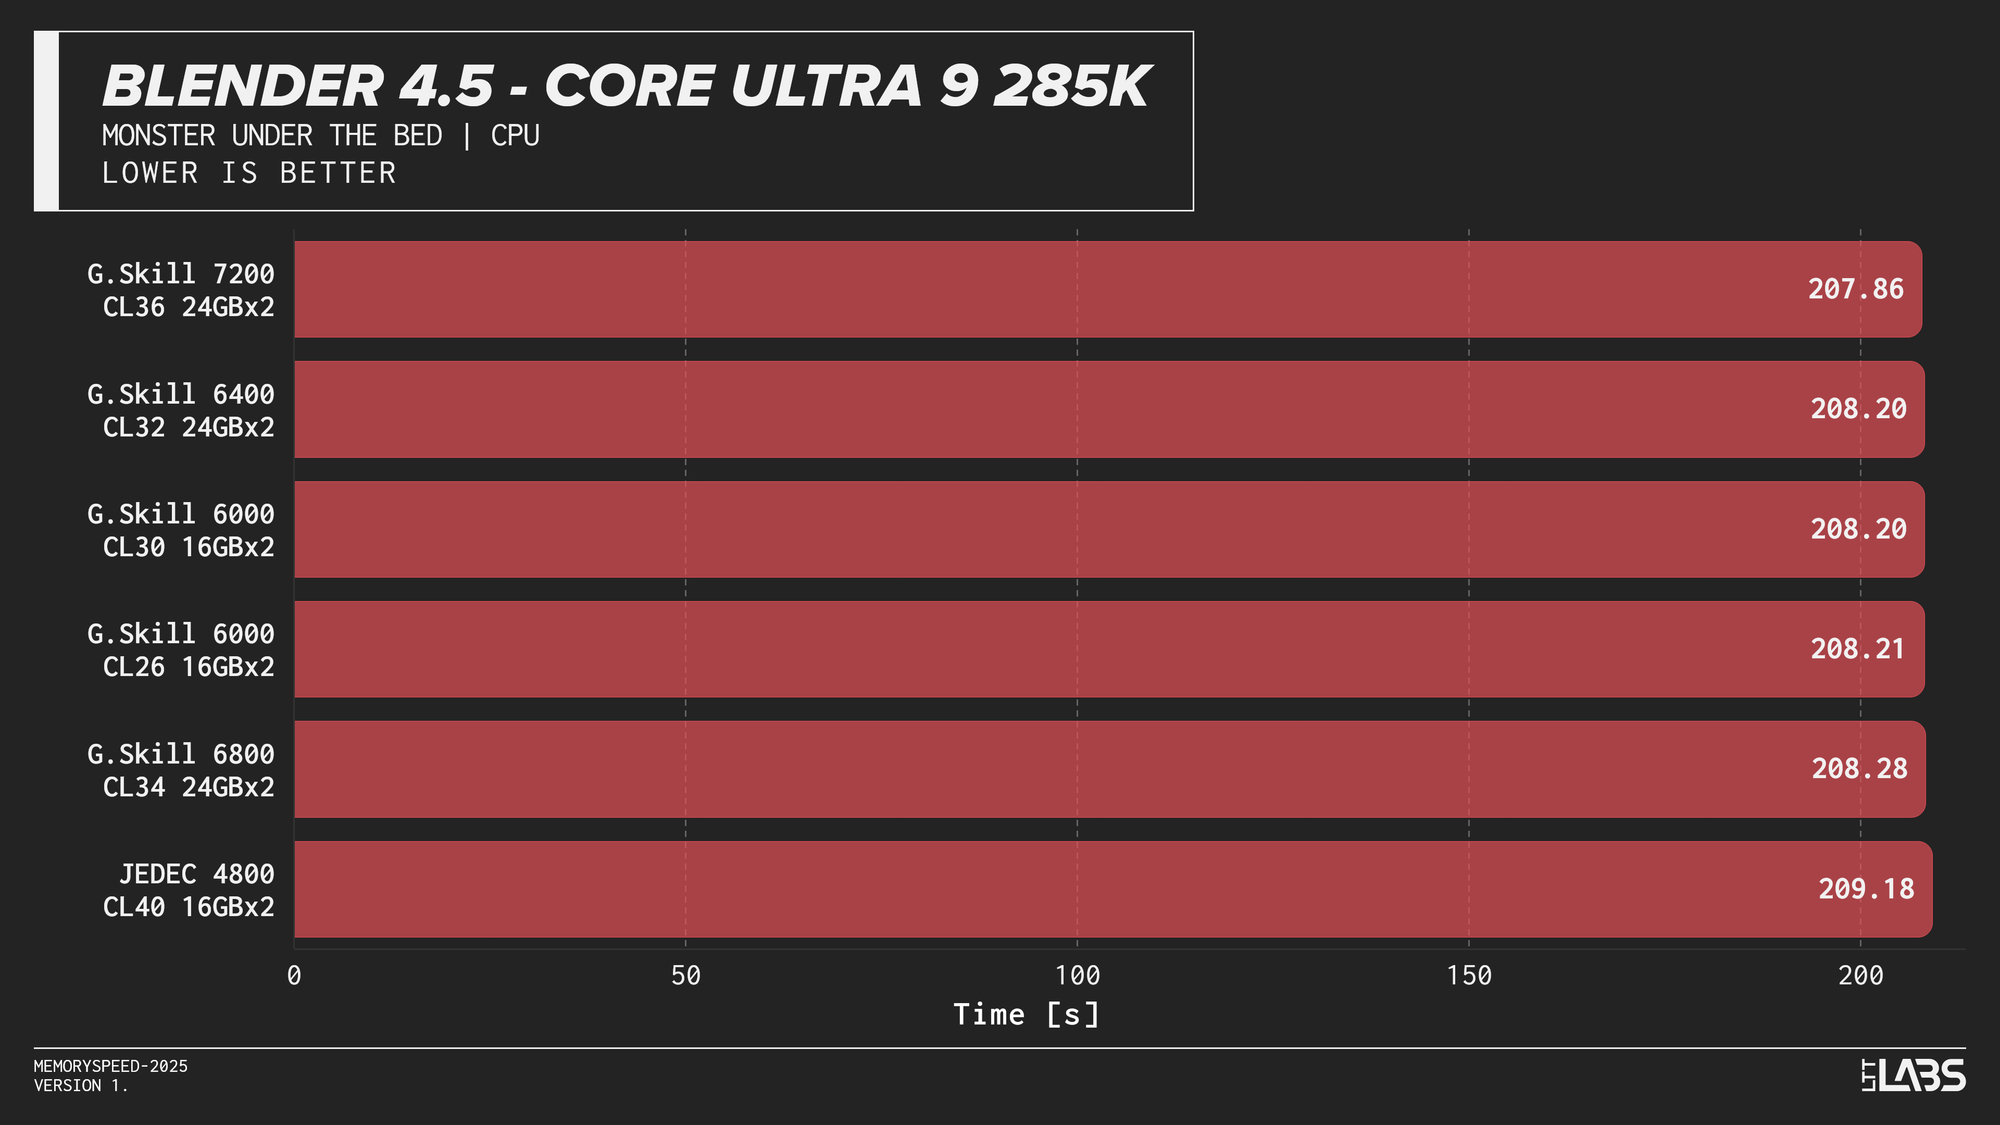
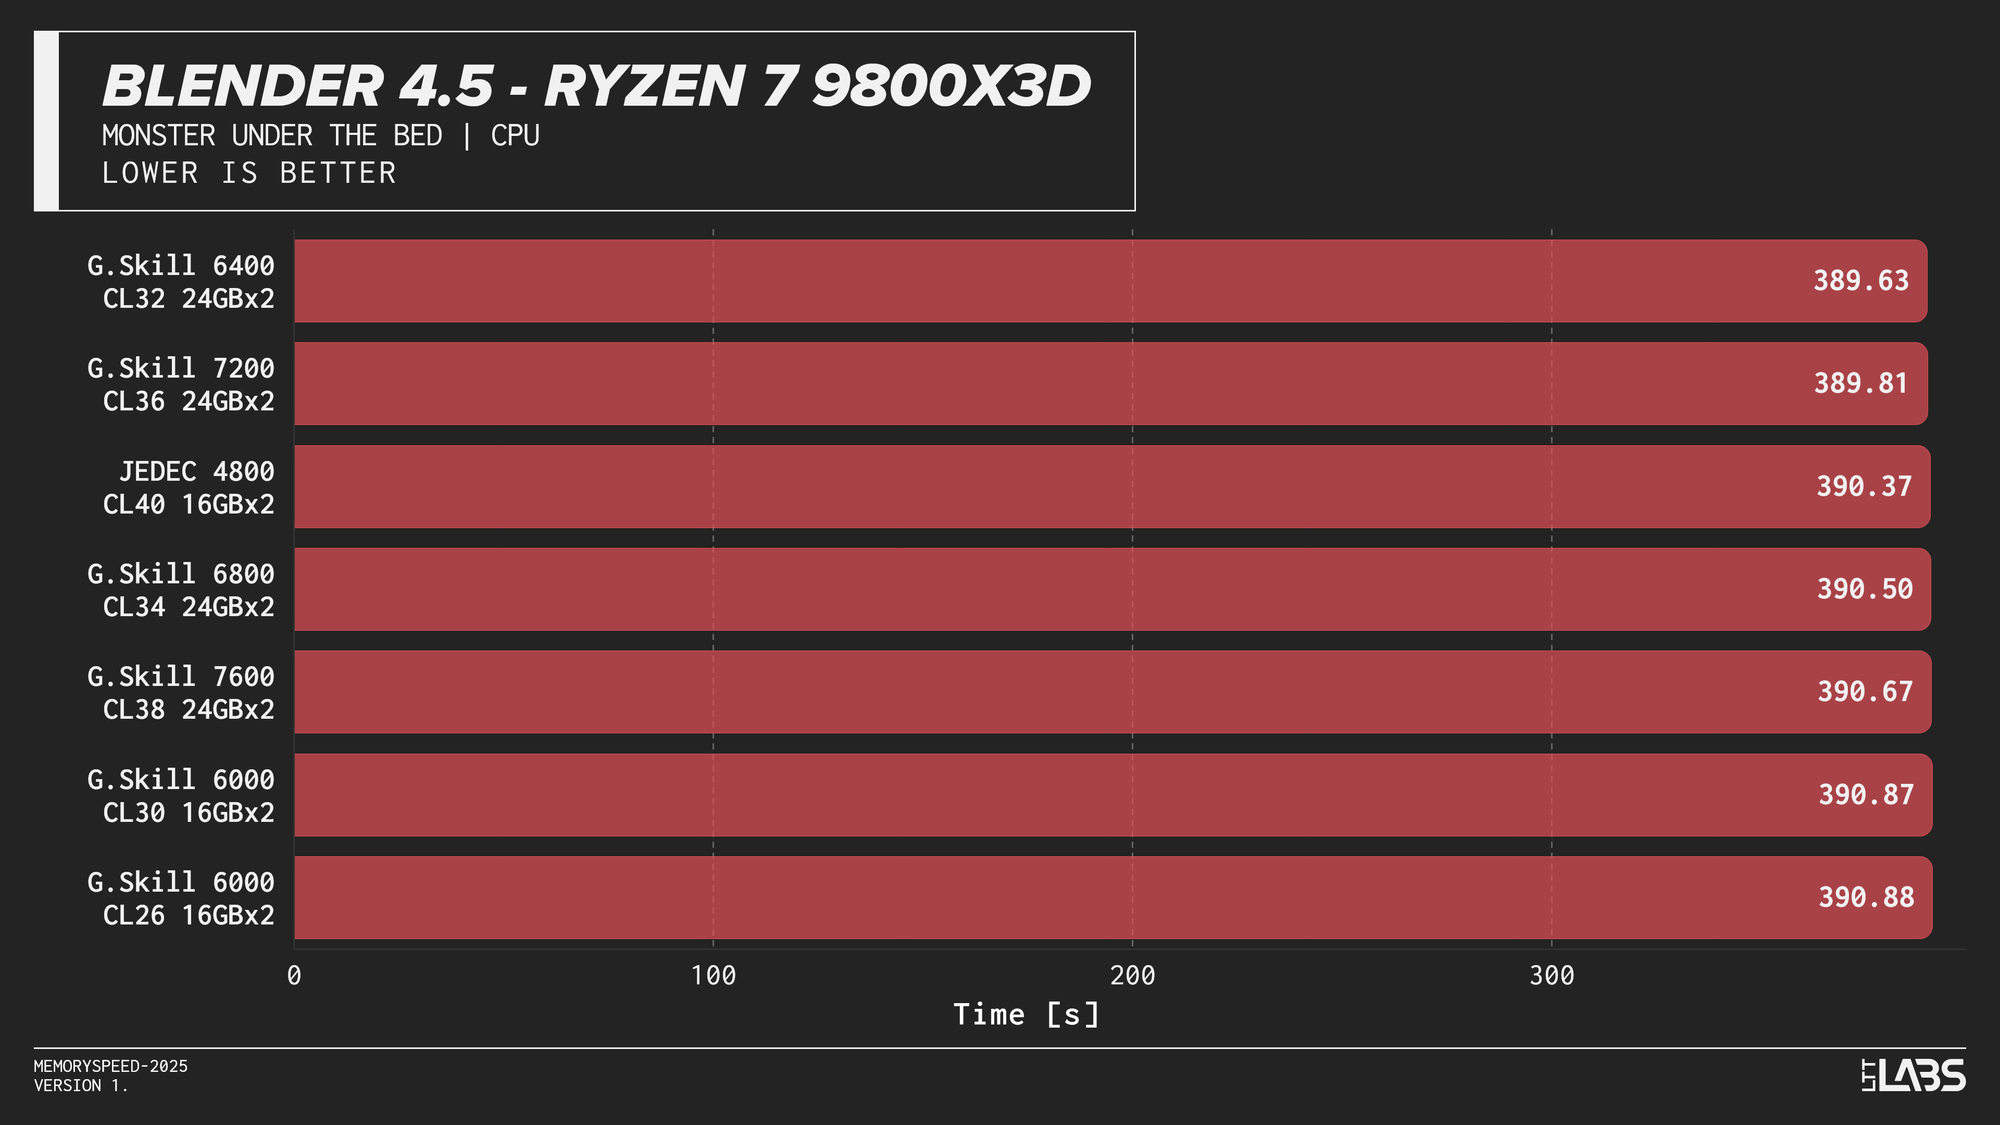
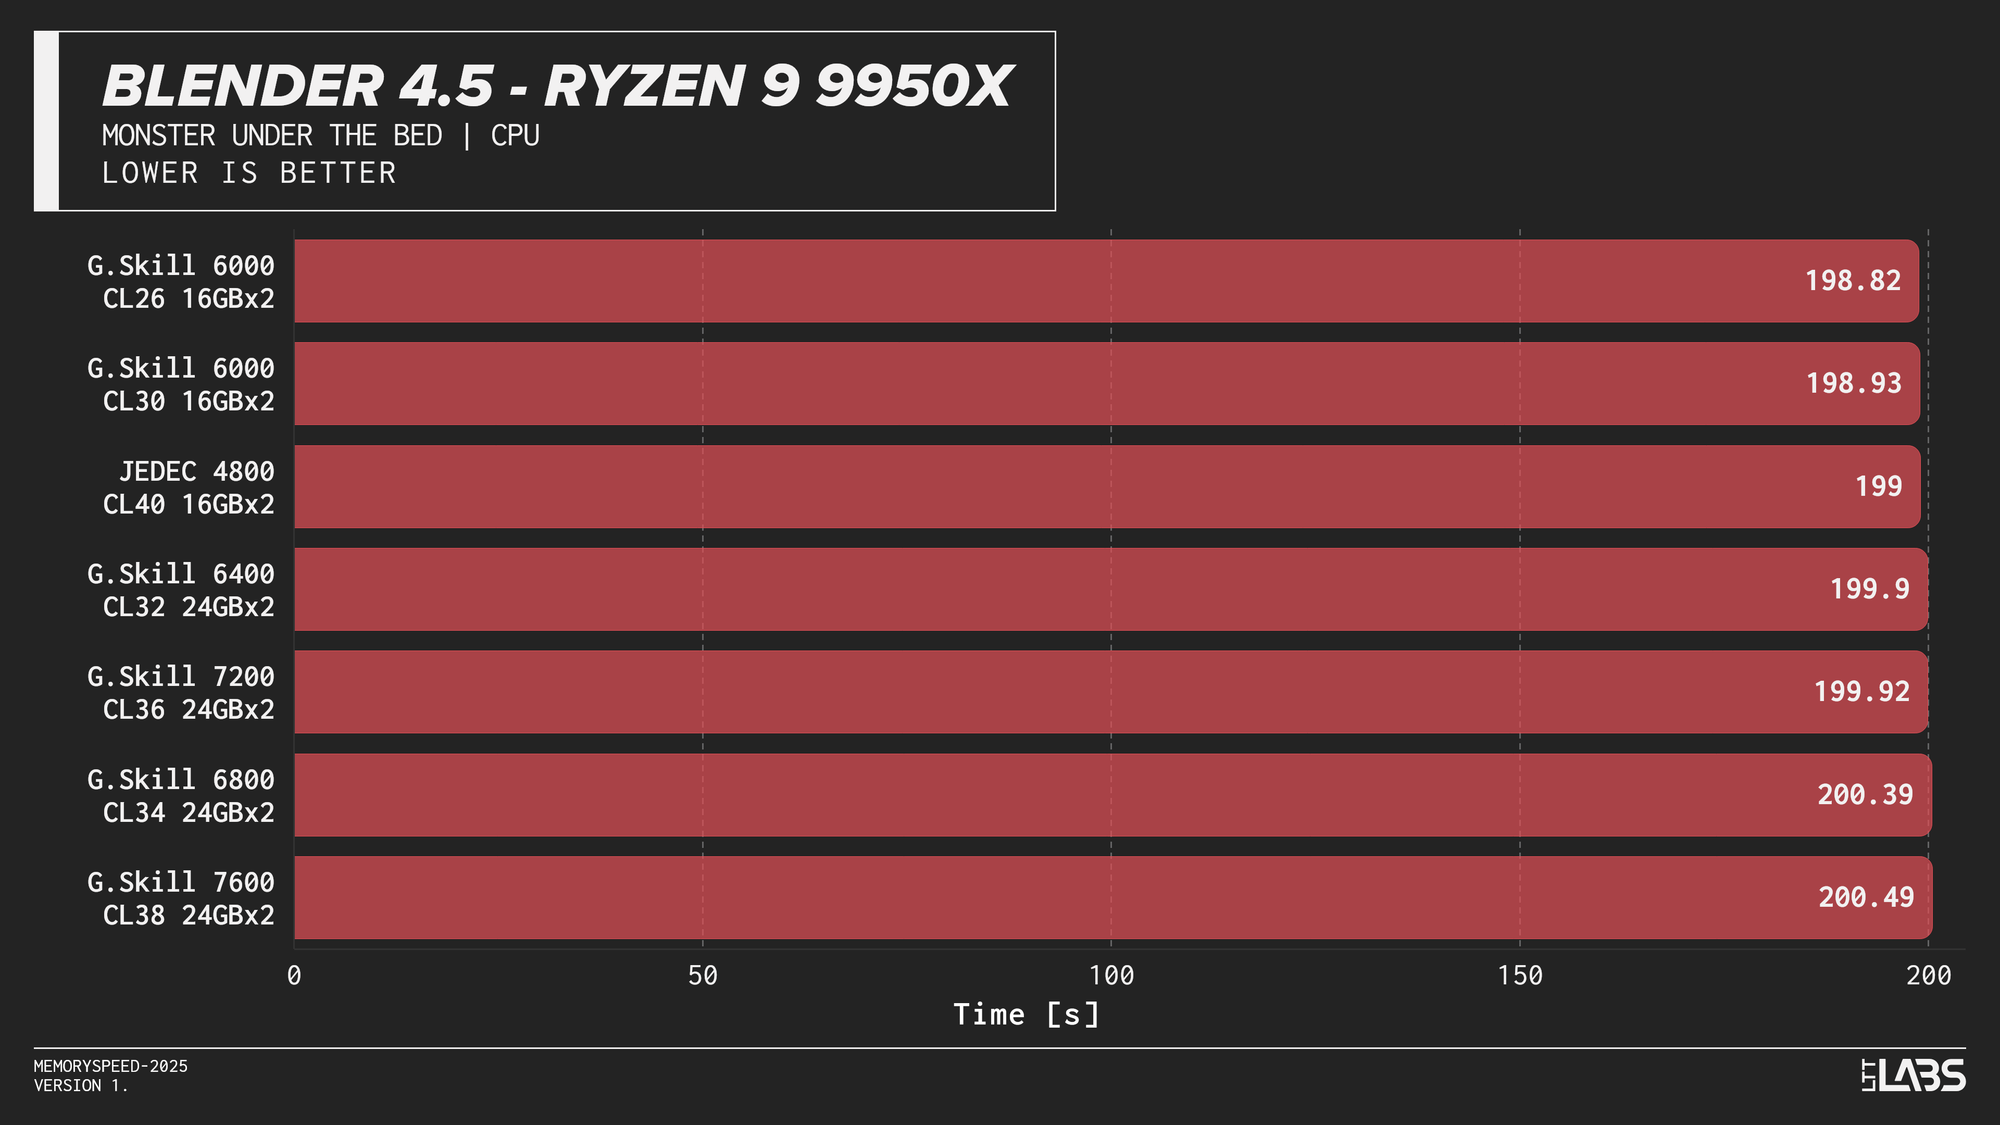
Blender 4.5 Monster CPU render
Blender showed effectively no meaningful scaling with memory speed across any platform. In several cases, mid-range configurations such as DDR5-6000 performed just as well as, or slightly better than, the highest-speed kits, indicating no performance advantage from faster memory.
Godot 4.4.1 Stable (Project compile)
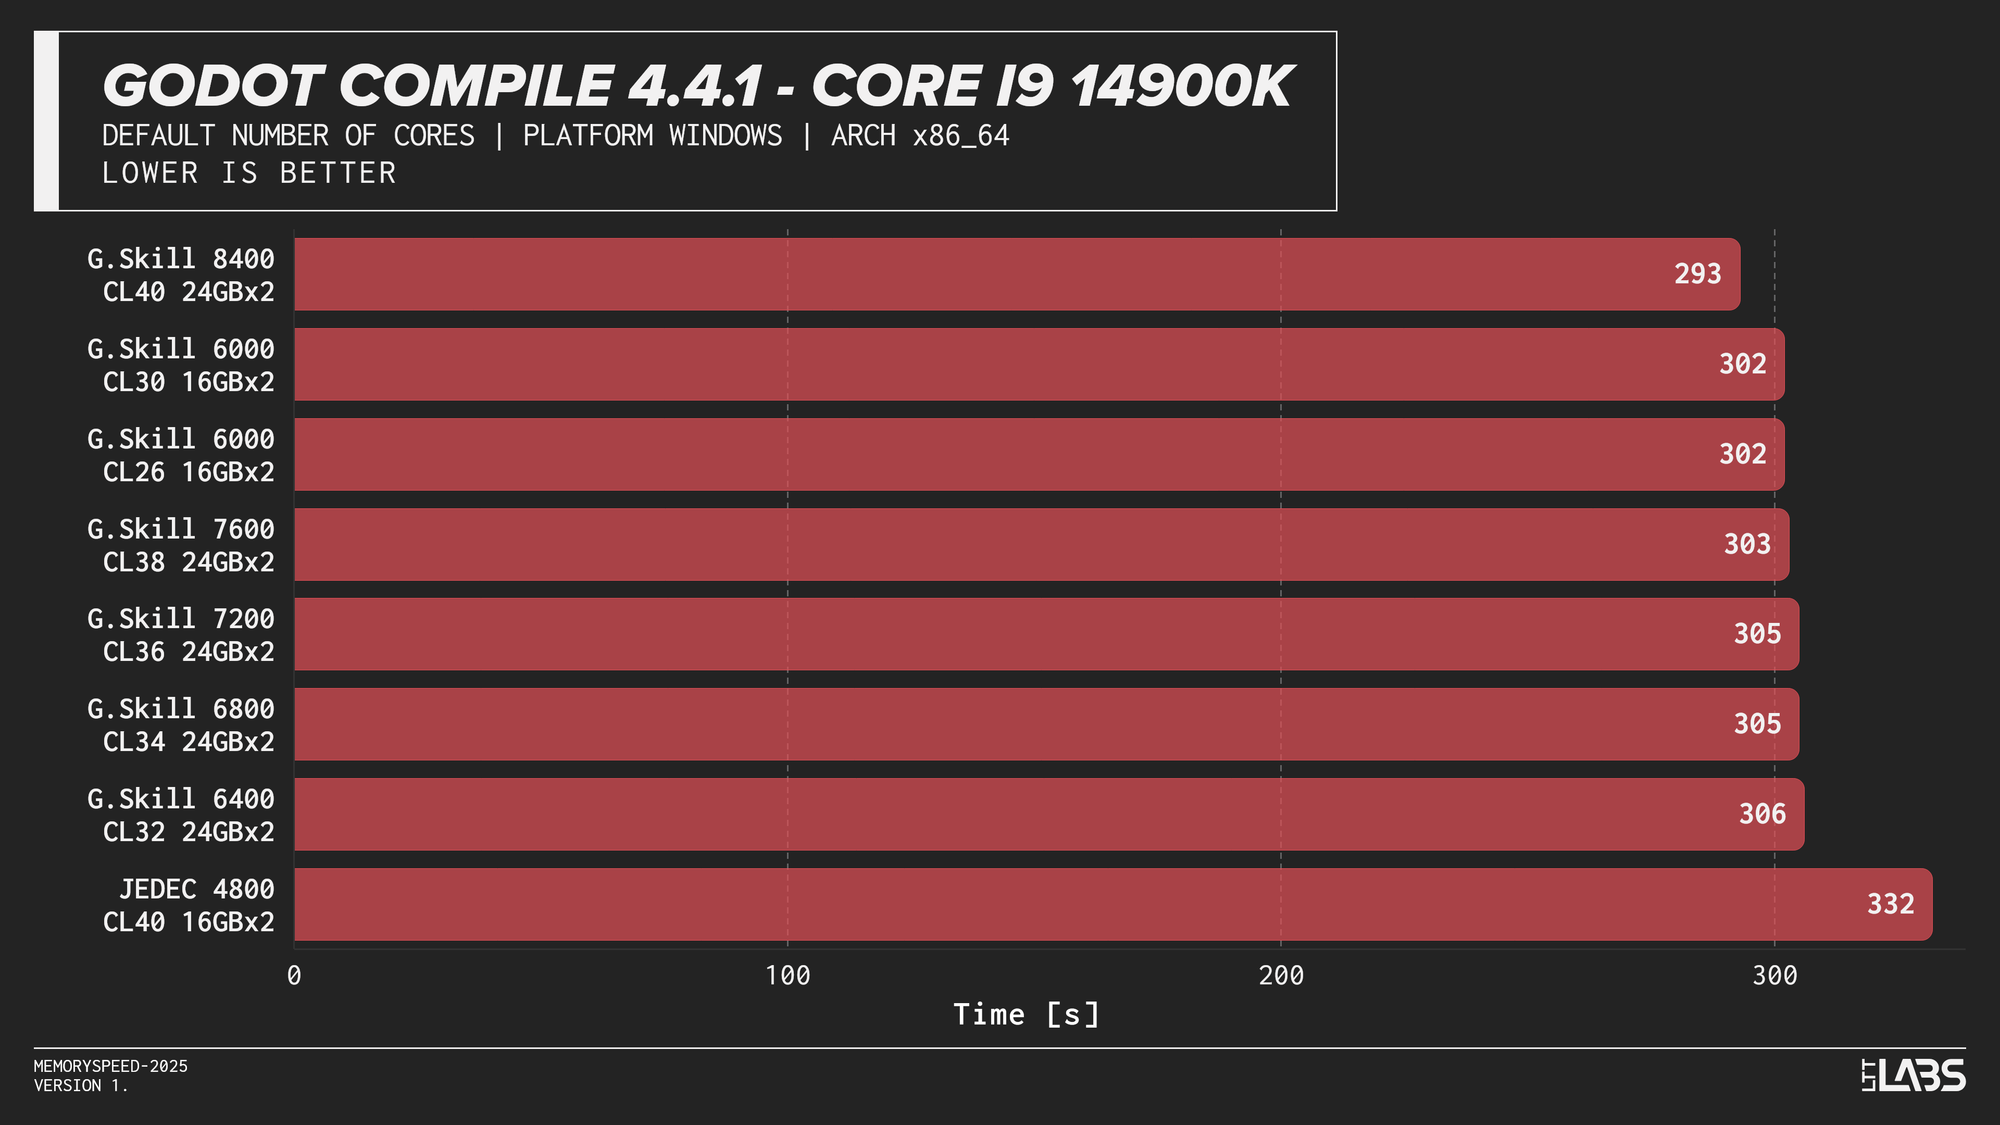
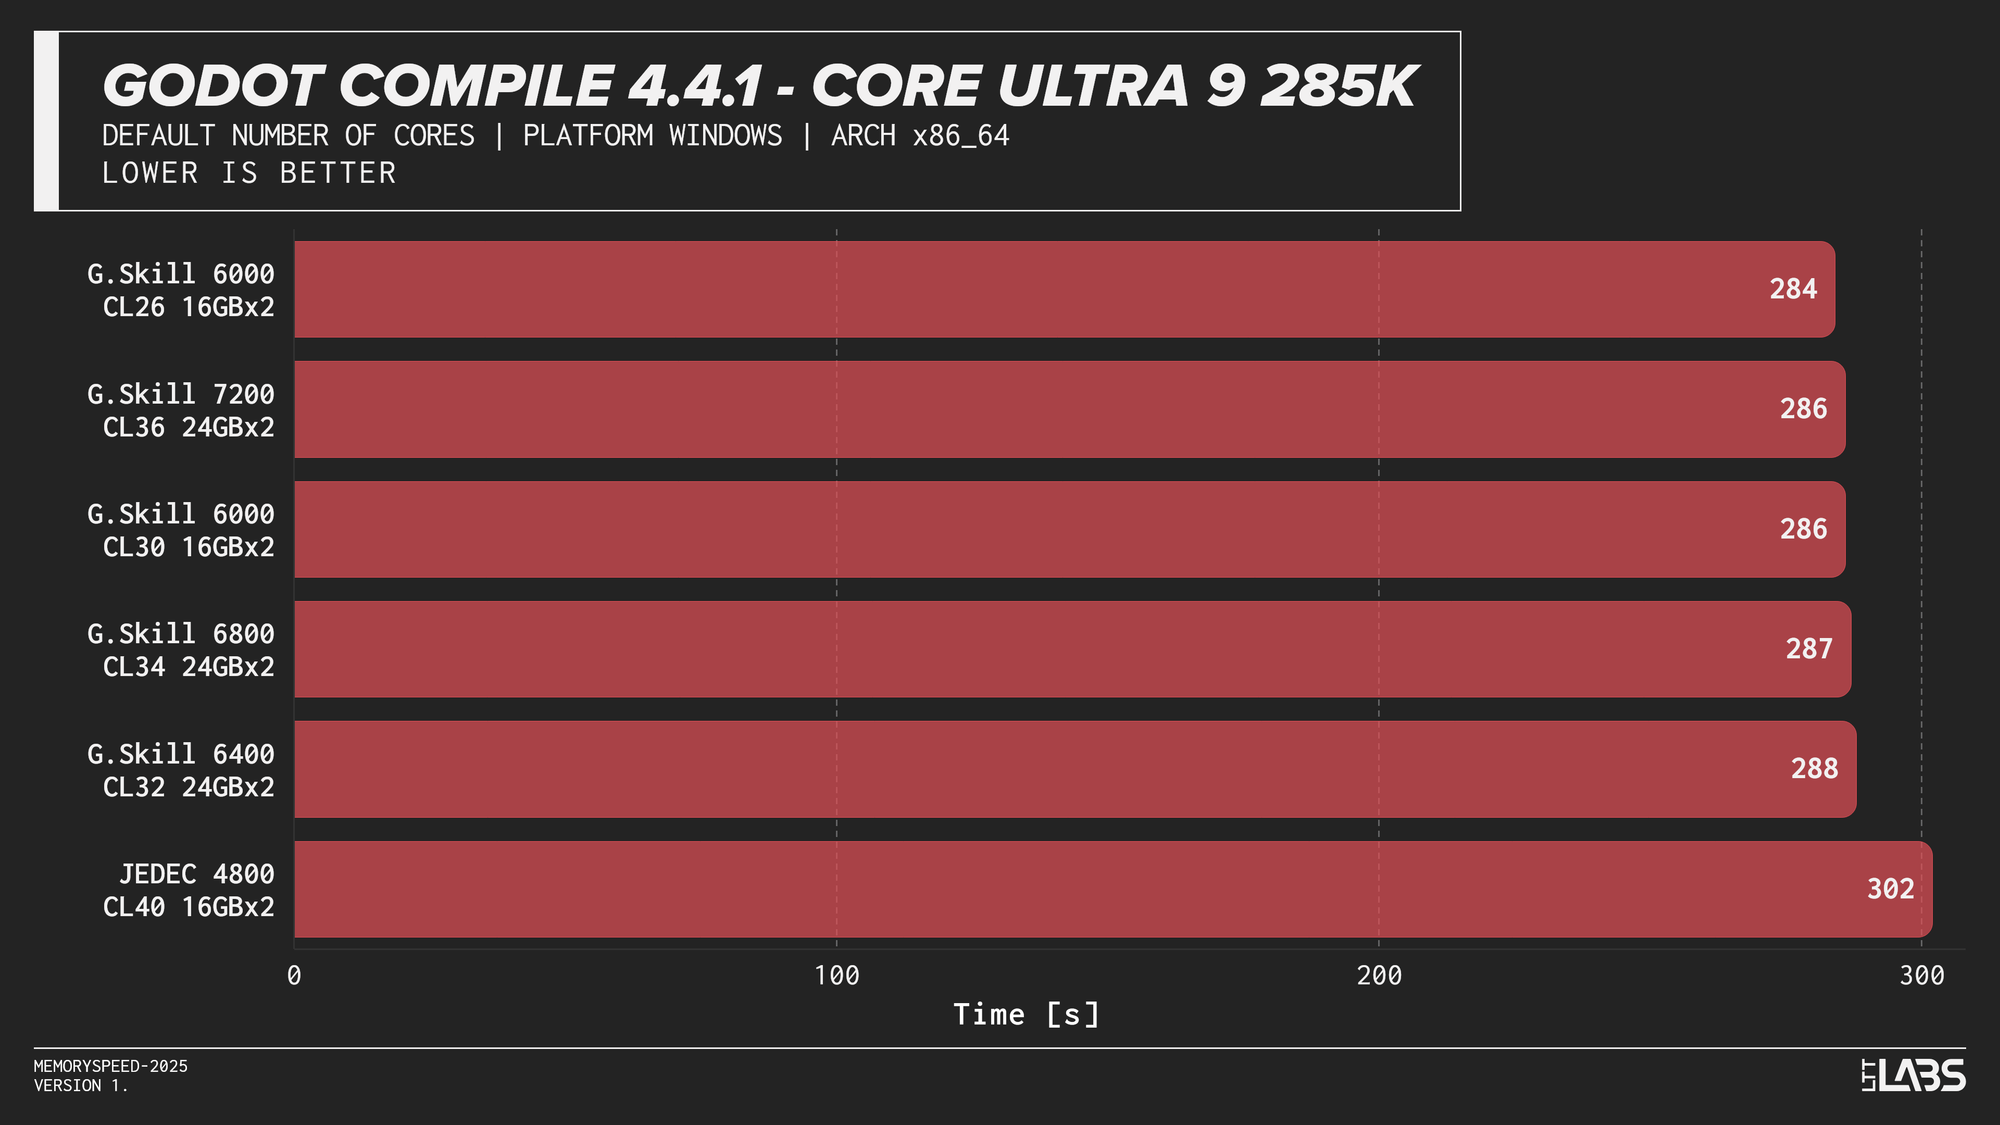
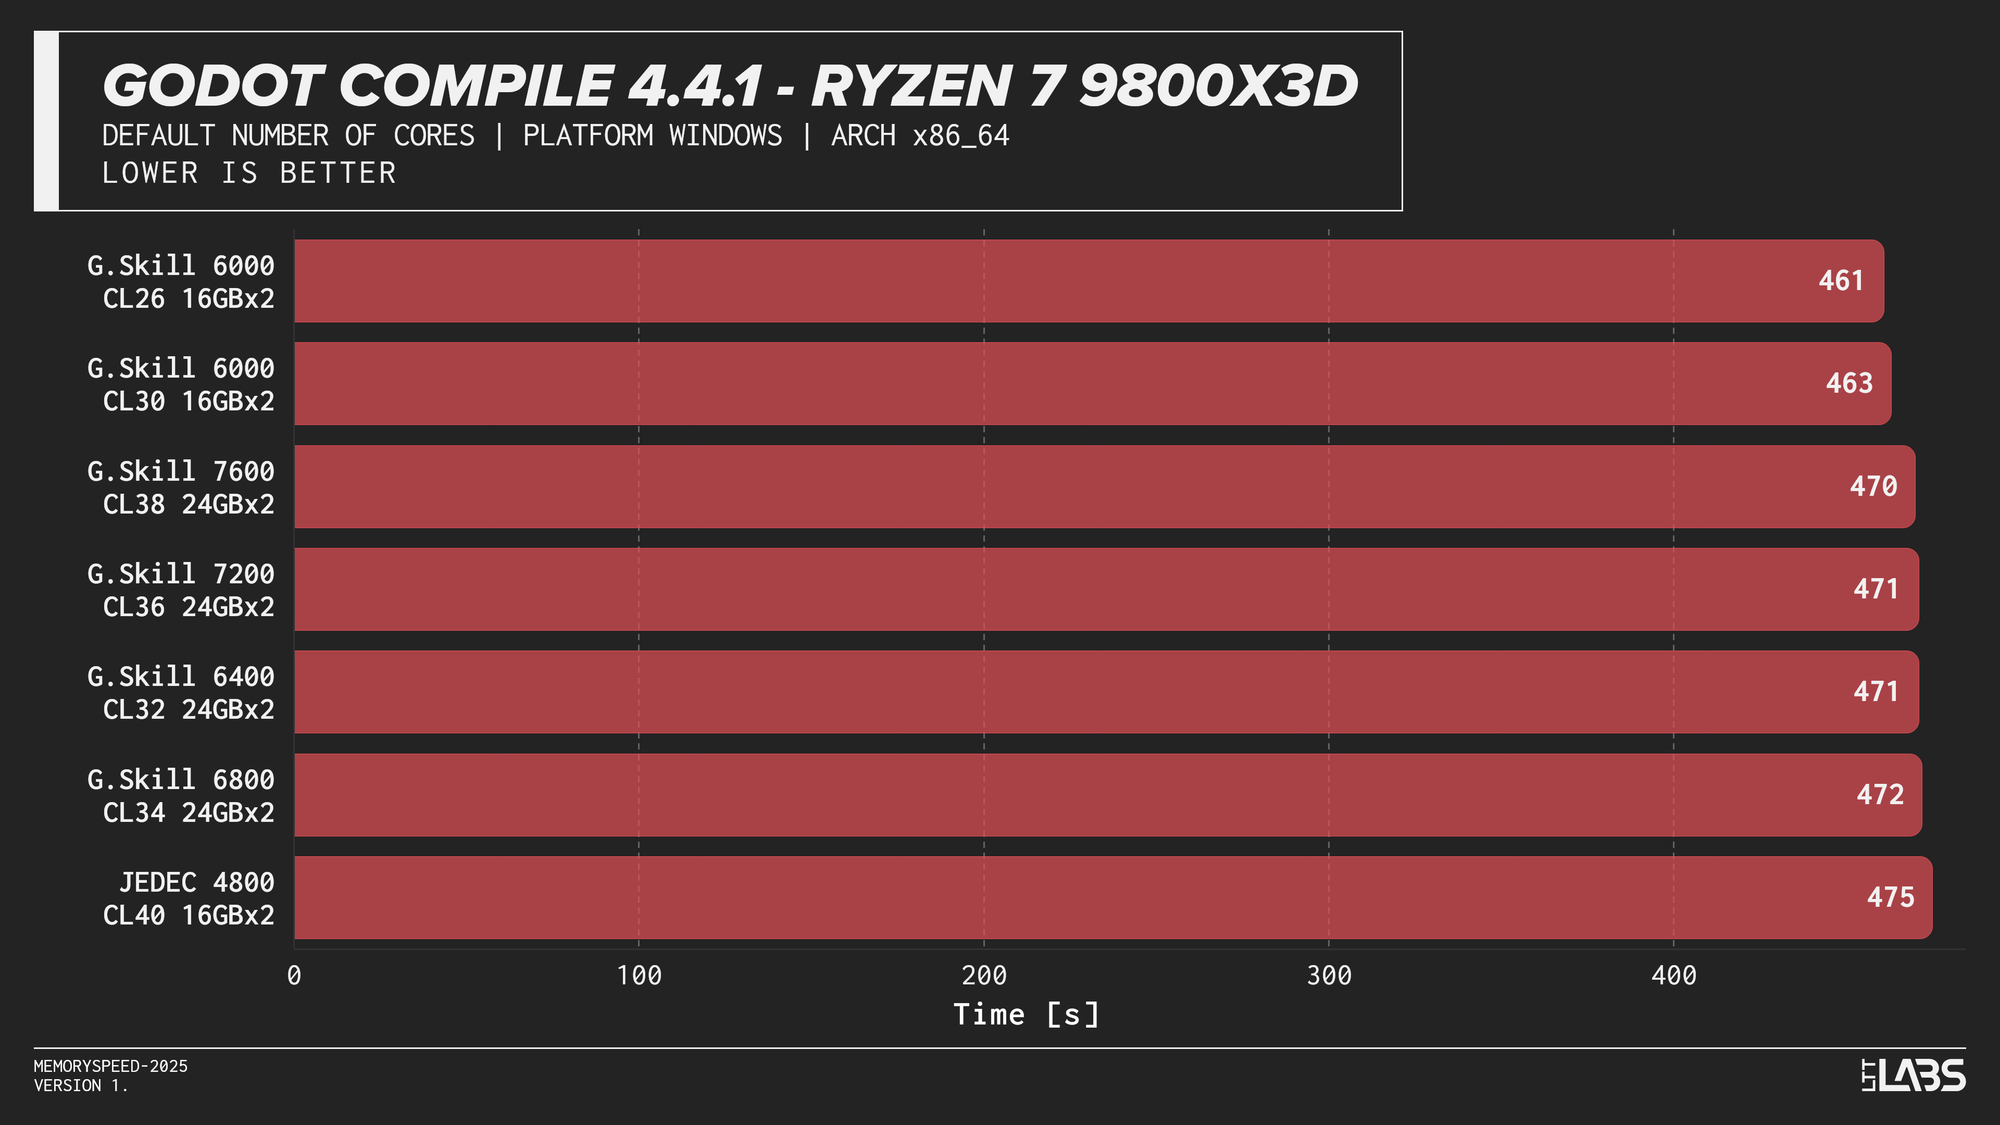
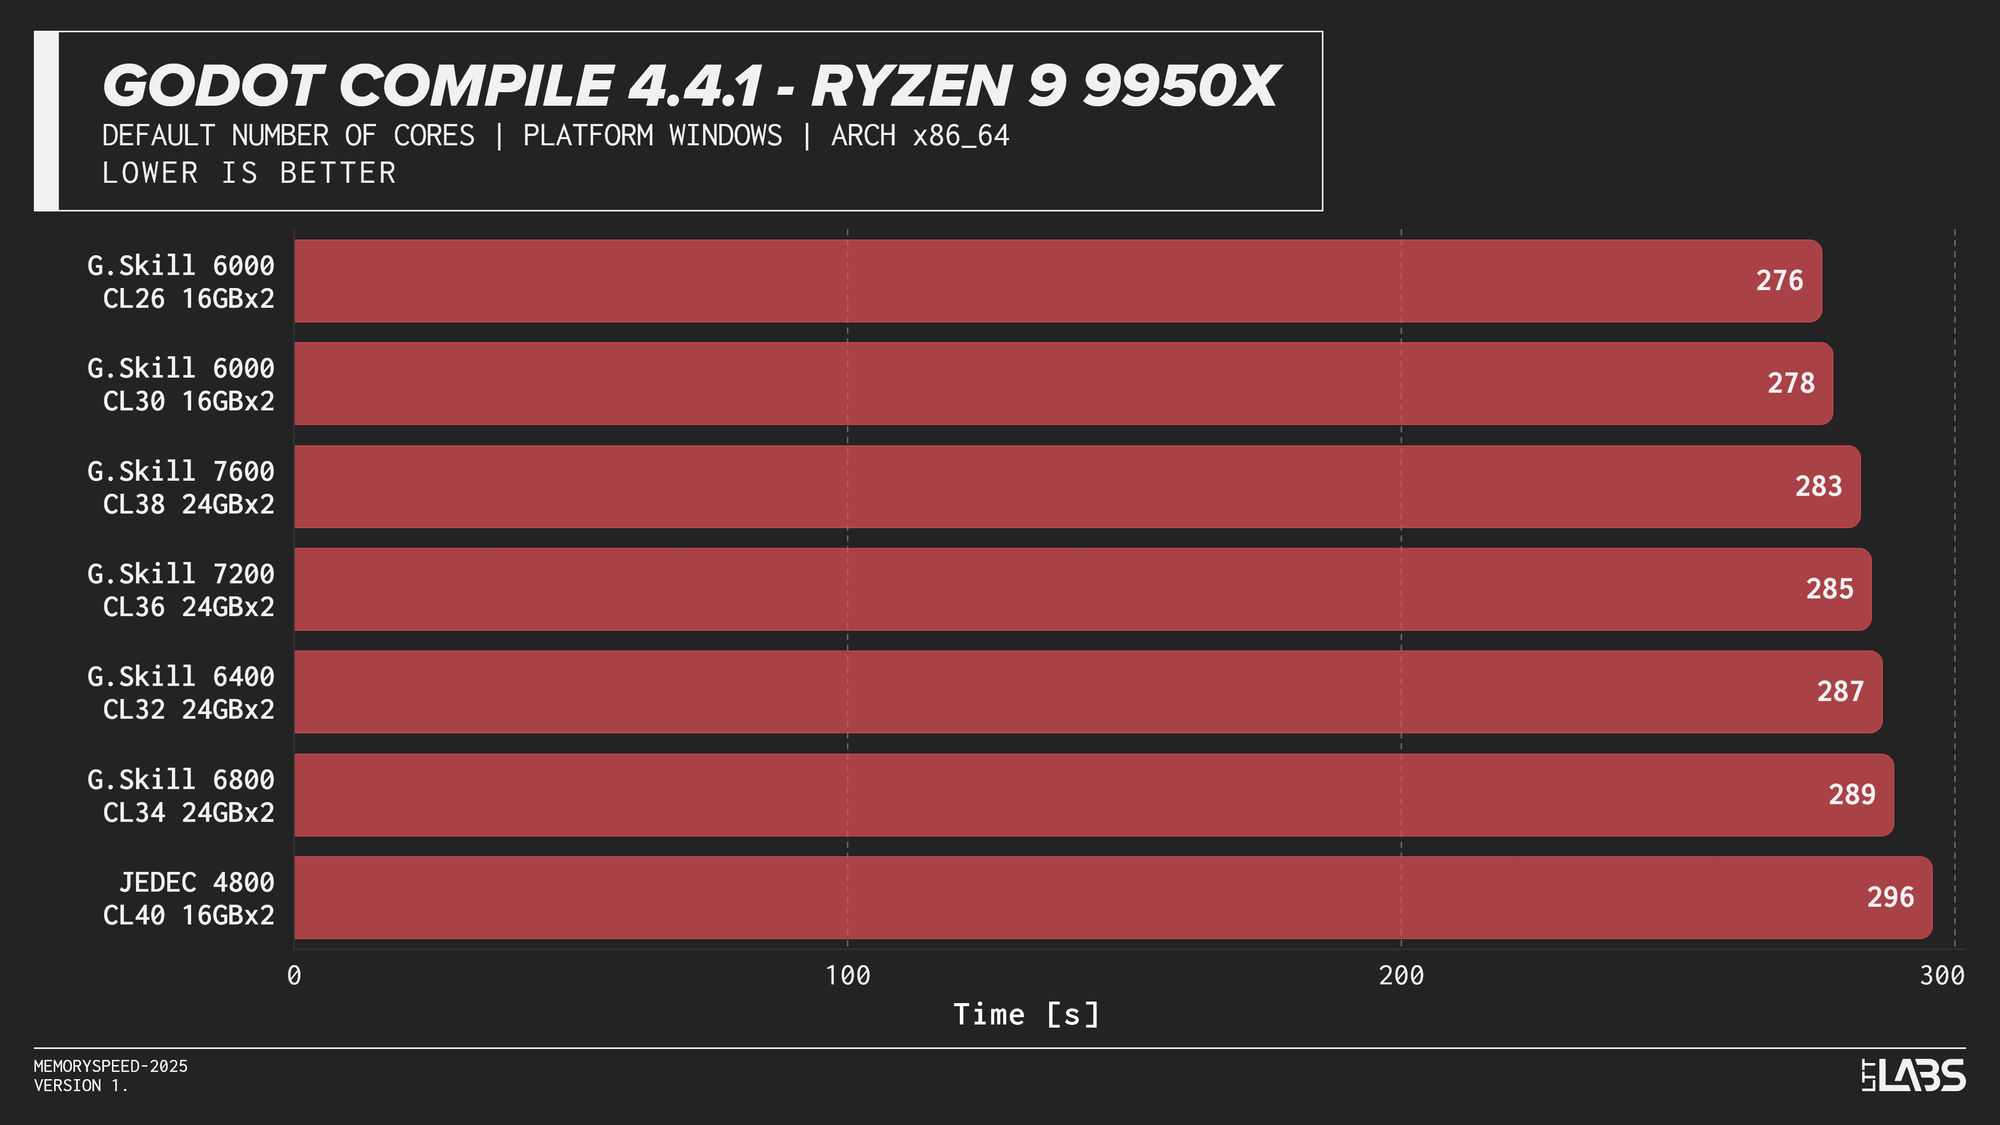
Godot 4.4.1 Stable
Compilation showed meaningful scaling with memory speed, but the effect varied by platform. The largest gains were seen on Intel, particularly the Core i9-14900K, where compile time dropped by 40 seconds going from JEDEC to 8400 MT/s and 30 seconds for every other module. The Core Ultra 9 285K showed a smaller but still noticeable reduction at about 15-18 seconds difference between JEDEC and XMP profiles. However, we could not run the 7600 or 8400 kit, so we cannot say whether those kits would provide any additional gains.
AMD systems showed moderate sensitivity, but performance generally peaked around DDR5-6000, which is the sweet spot for AMD's Infinity Fabric, with lesser benefit from higher speeds.
This trend reflects the nature of compilation workloads, which involve large working sets and frequent memory access beyond cache. They benefit from lower latency and higher bandwidth, but once a balanced configuration is reached, additional memory speed provides diminishing returns.
HandBrake 1.9.1 (AV1 and x264 encoding)
AV1
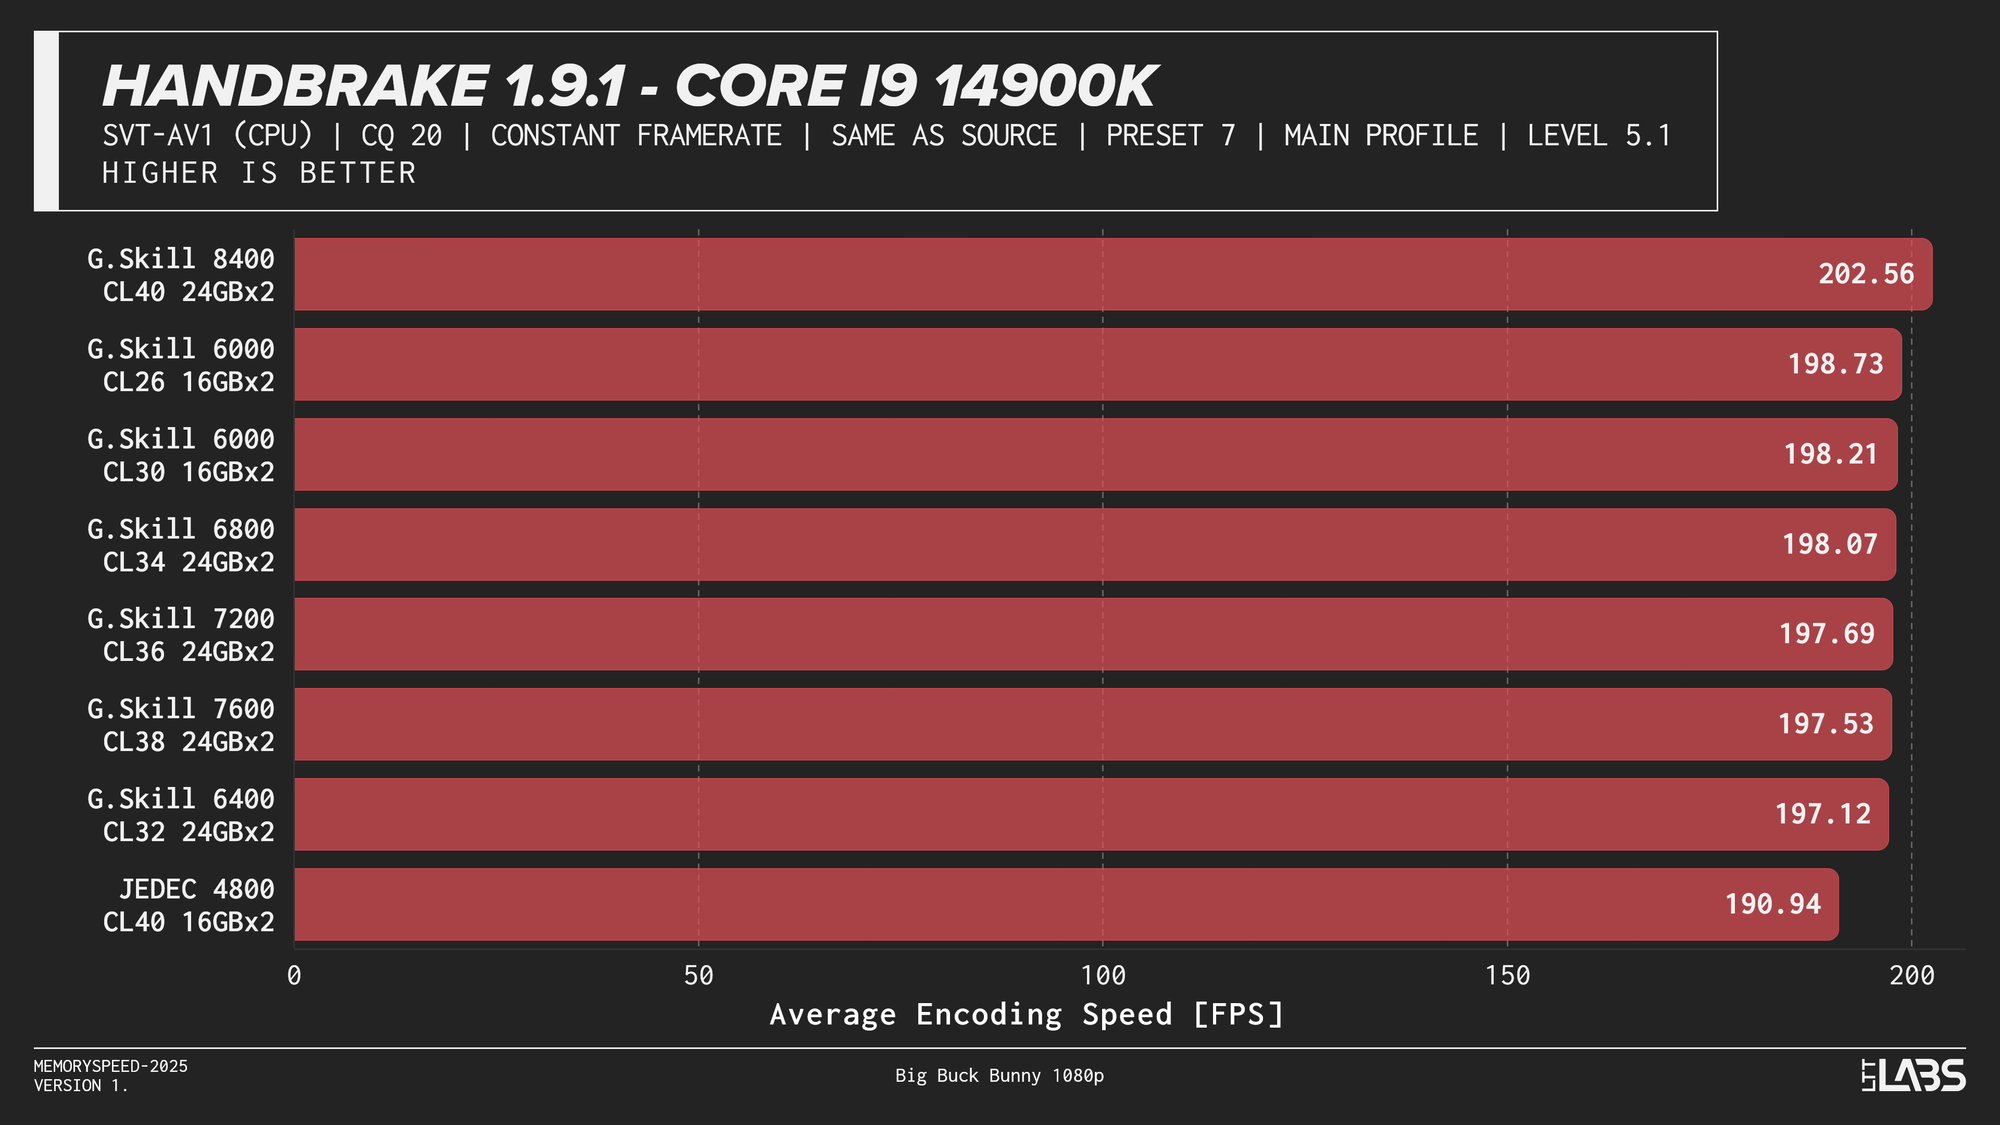

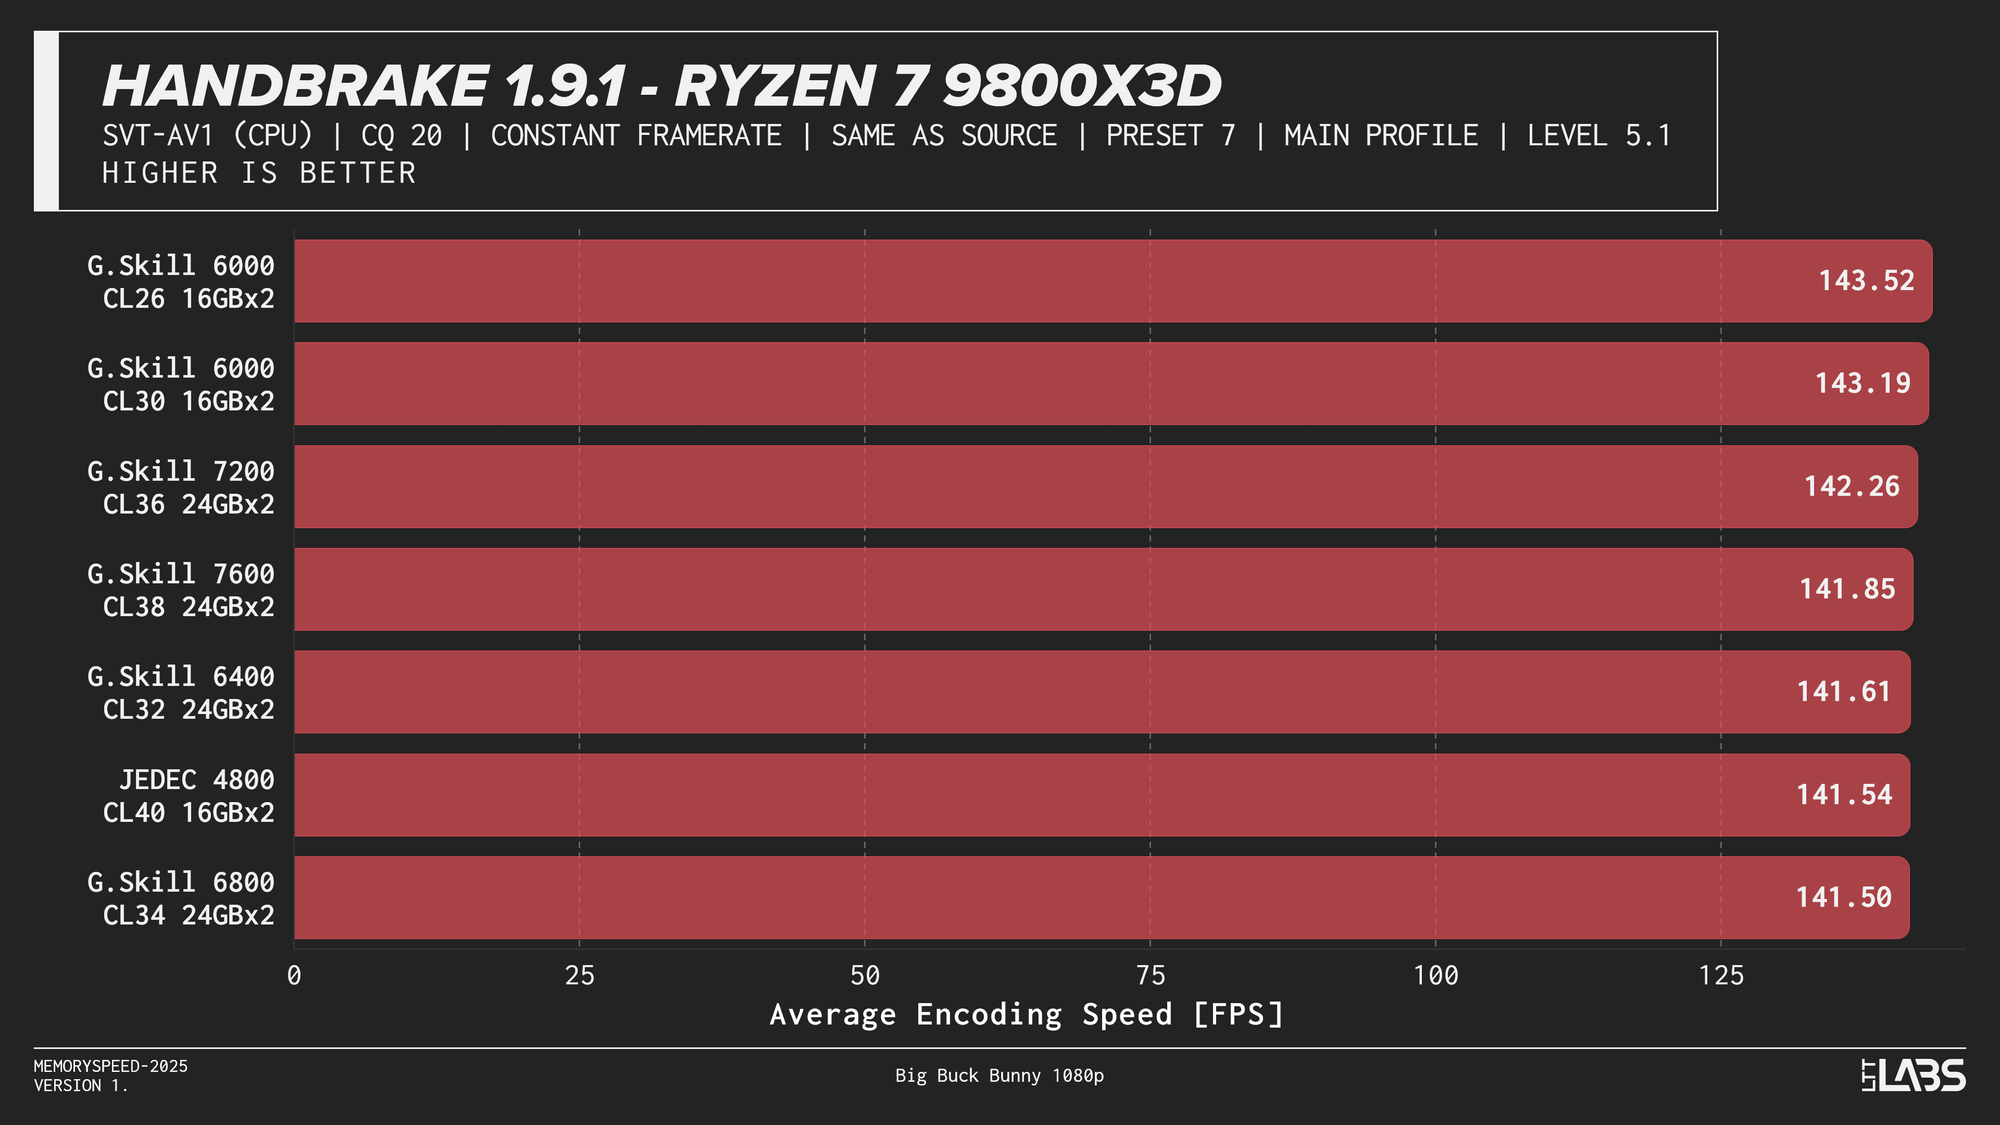
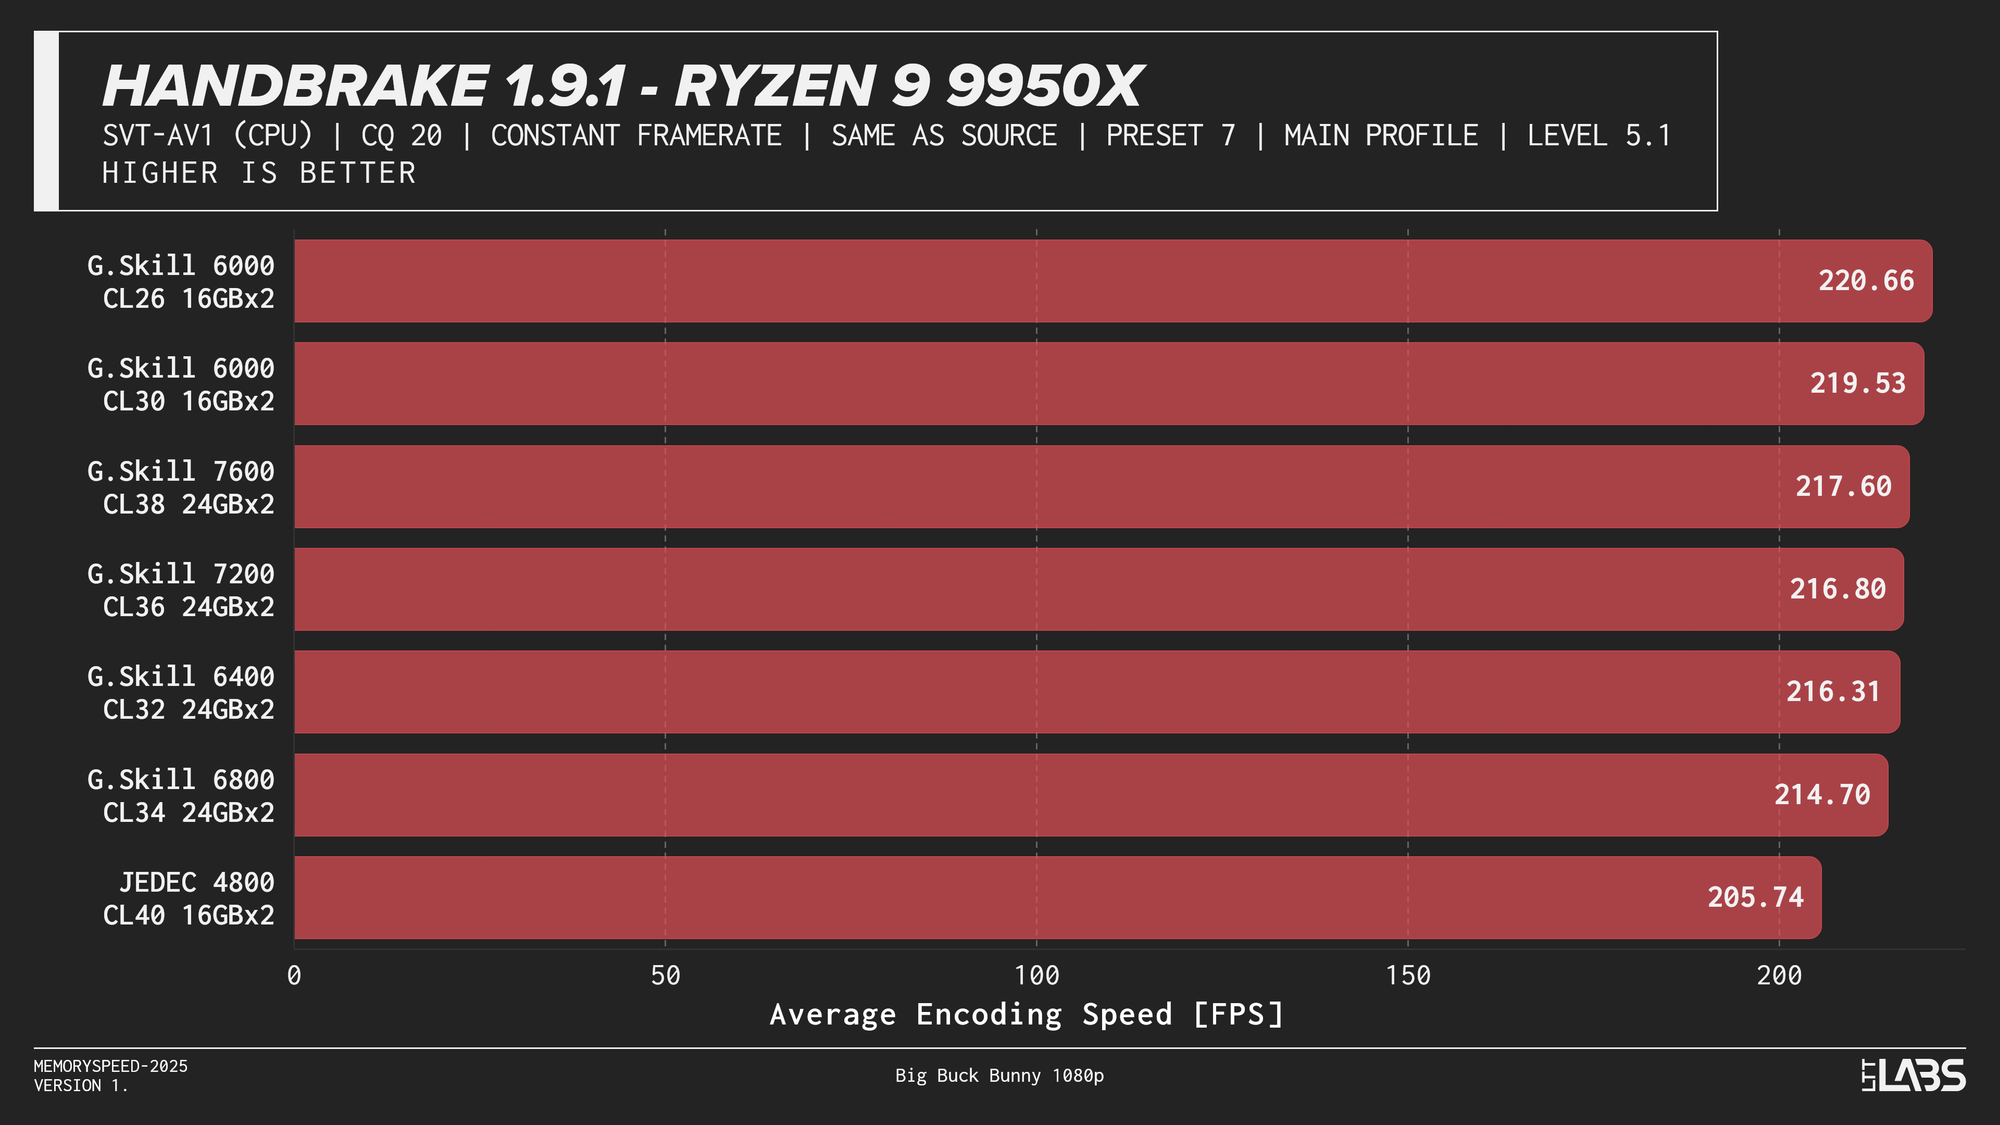
HandBrake 1.9.1 AV1
AV1 showed the most memory sensitivity in the encoding tests. JEDEC configurations consistently performed the worst across all platforms except on the X3D chip where the difference was insignificant. AMD systems generally peaked near the sweet spot of 6000MT/s. Intel showed slightly broader scaling, with the Core i9-14900K achieving its highest throughput at the top memory speeds, though gains beyond 6000–6800 MT/s were limited. While the frame rate differences appear small, even a few FPS can translate into meaningful time savings when encoding really long videos.
H264
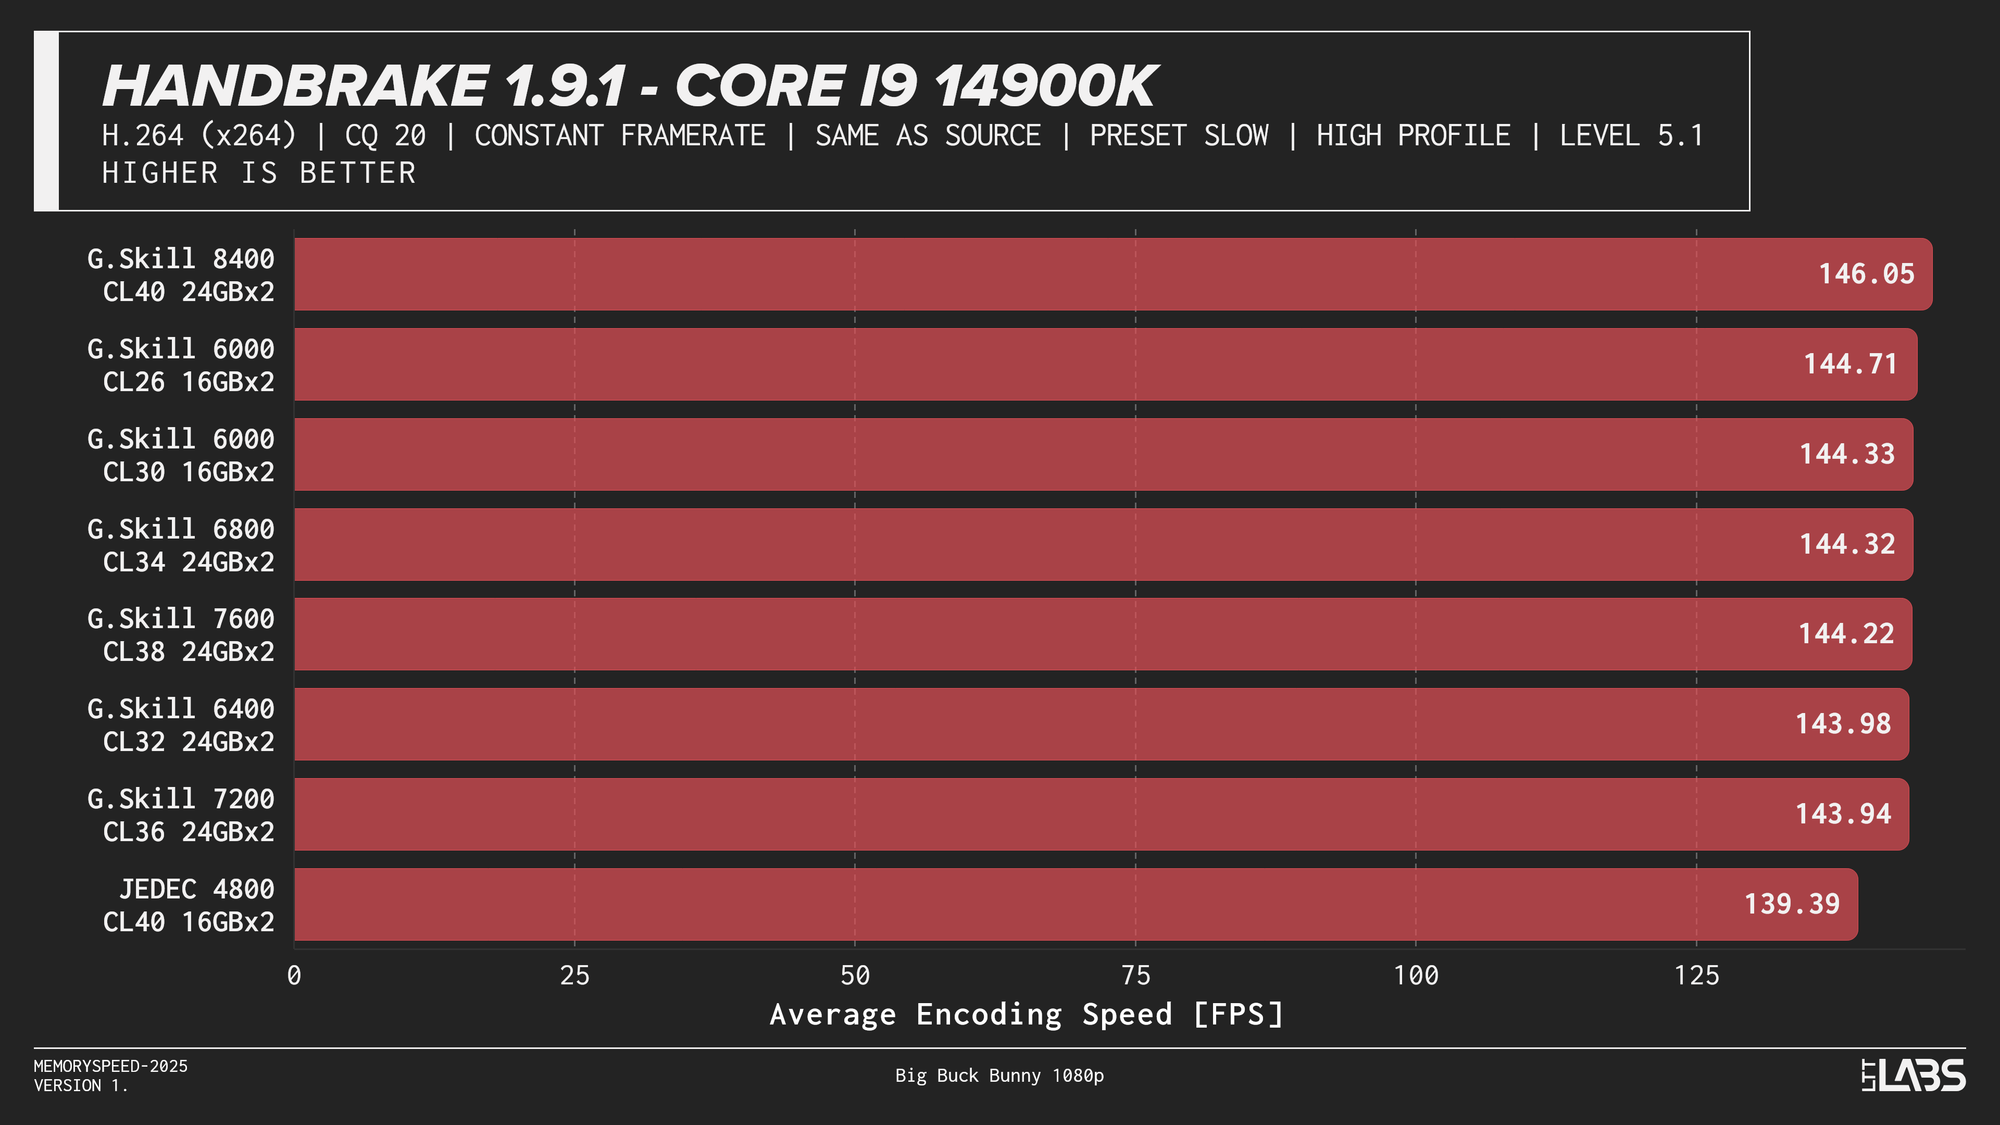
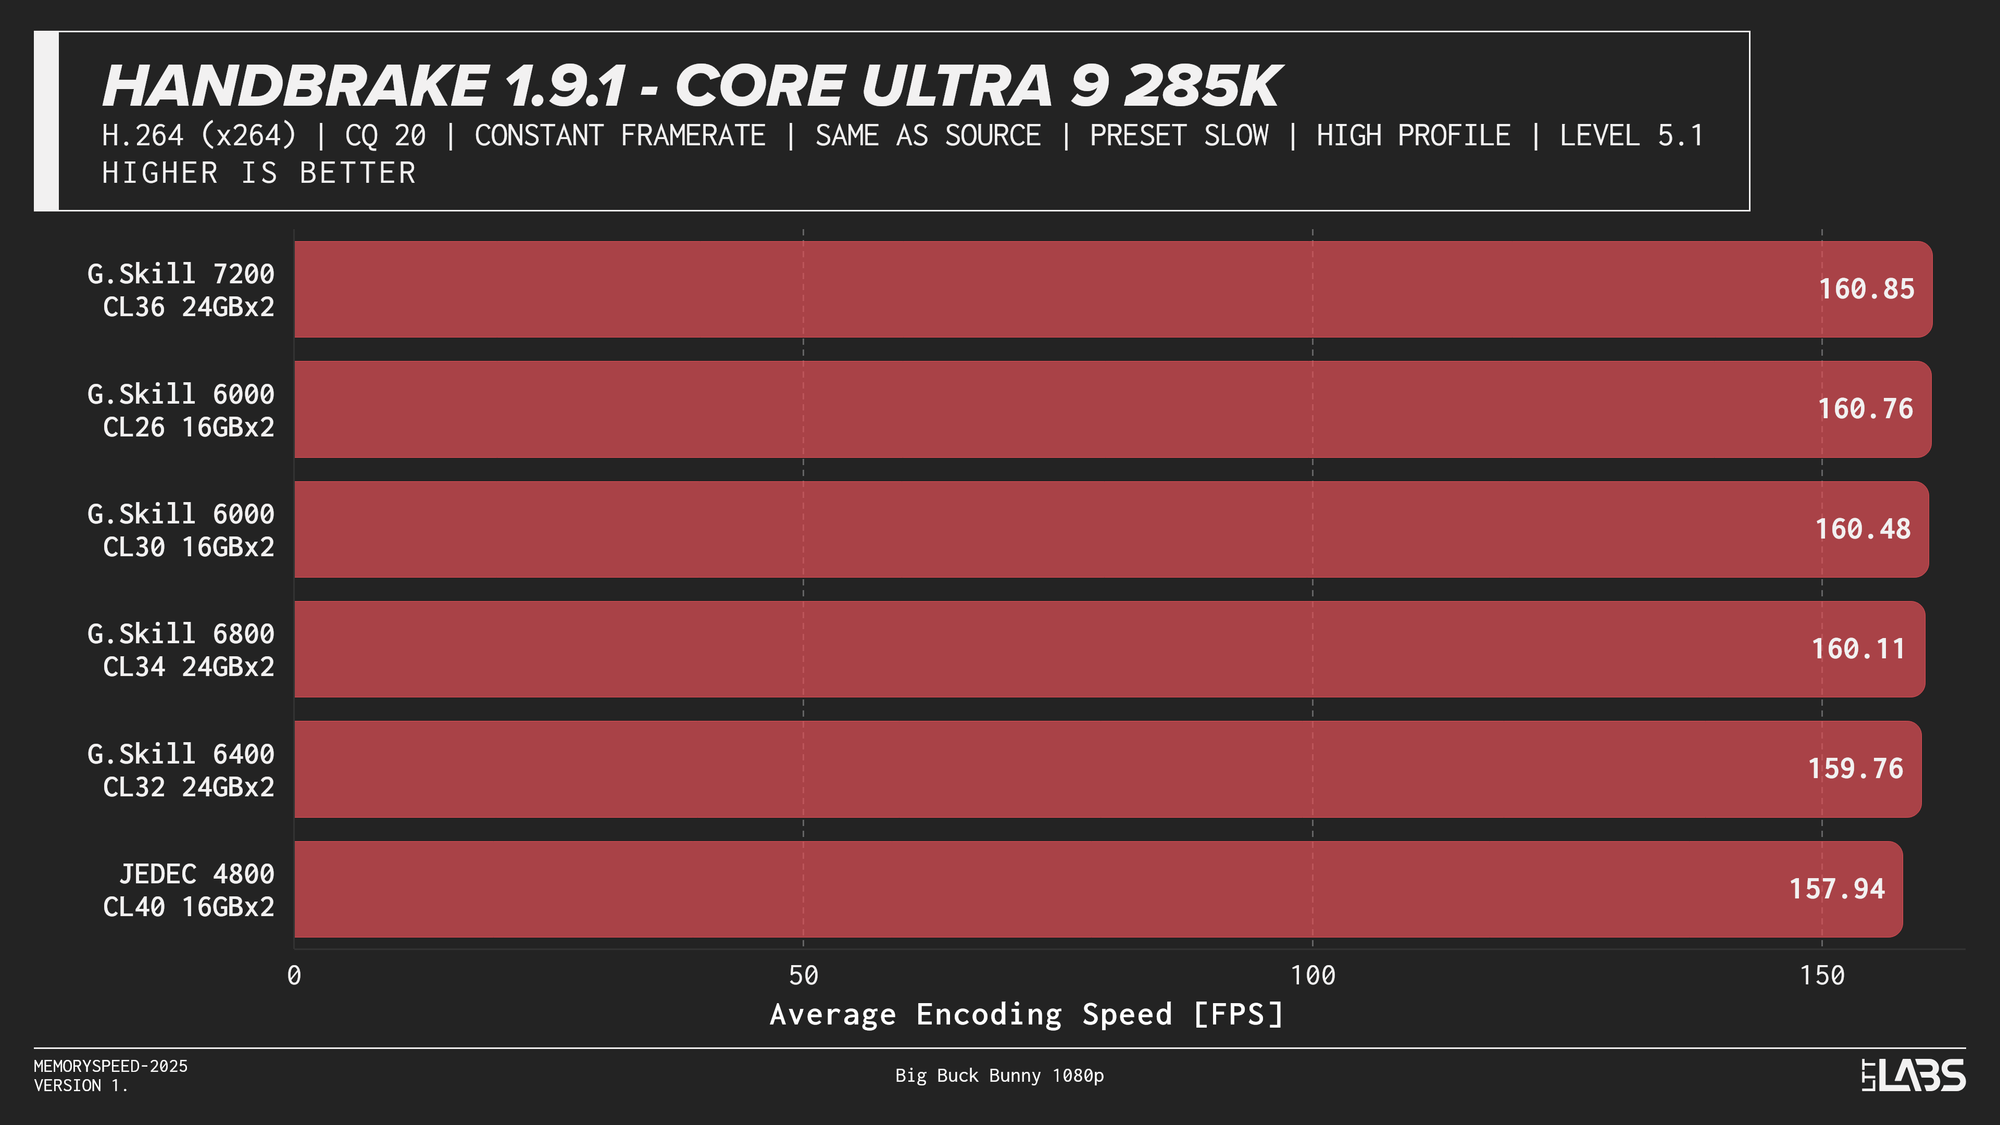
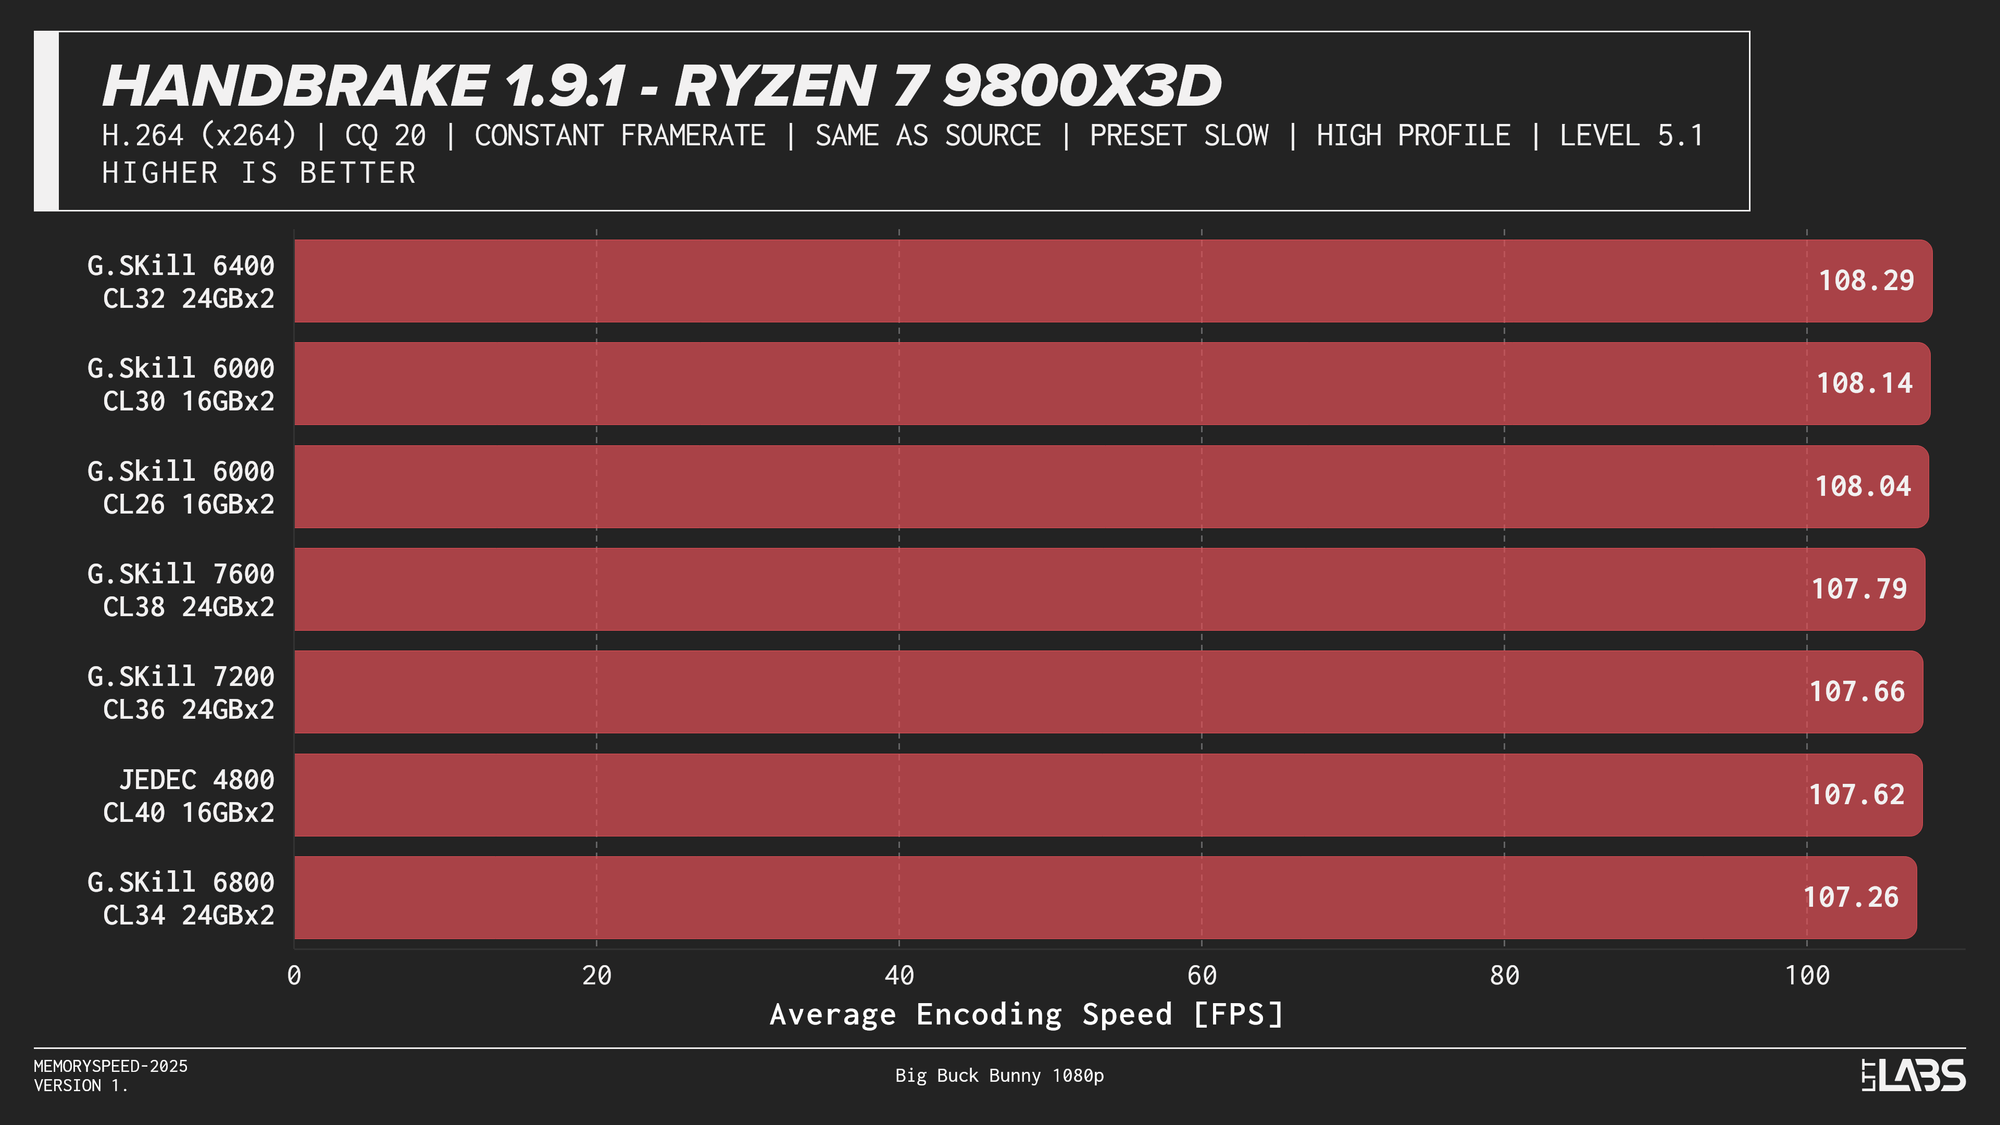
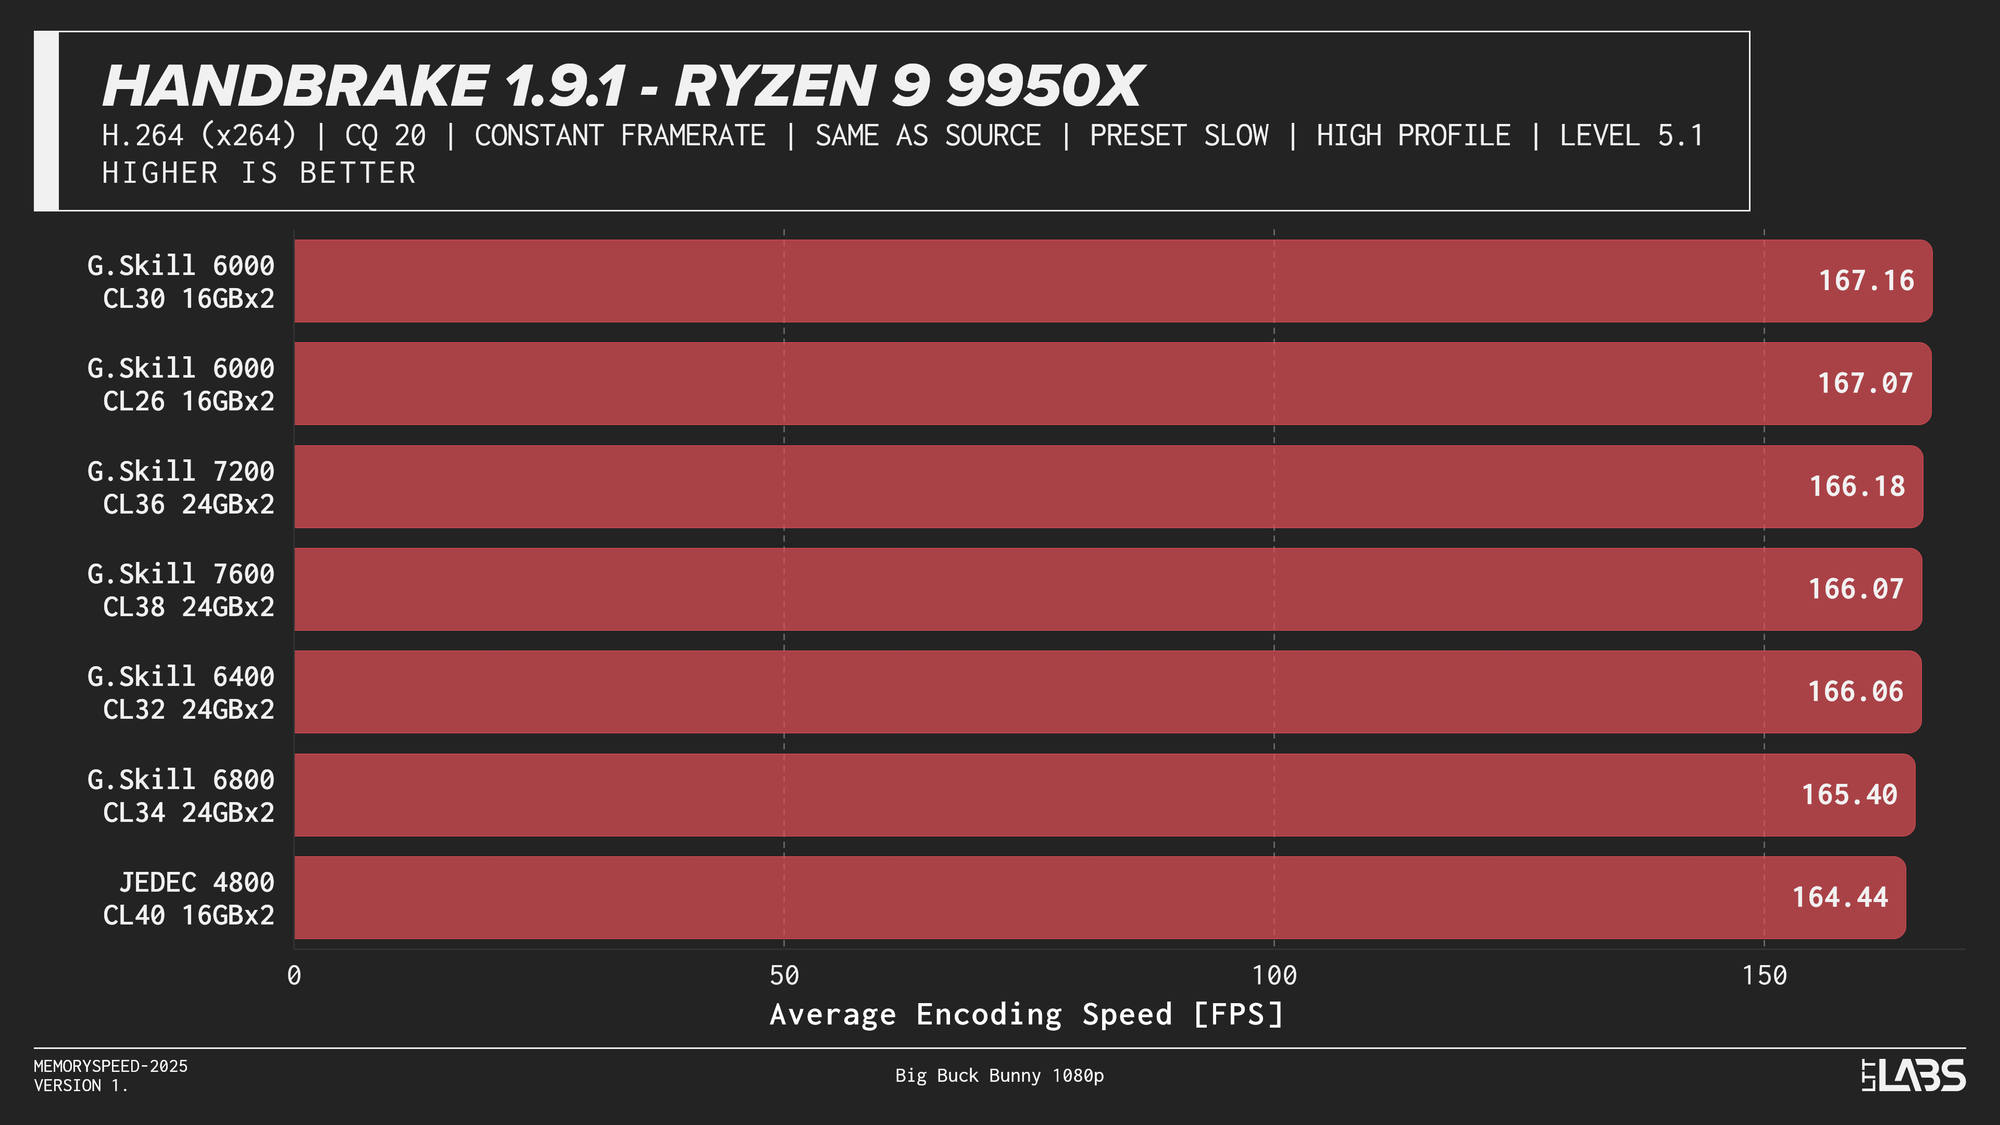
HandBrake 1.9.1 H264
x264 showed much tighter clustering overall, but JEDEC still trailed tuned configurations by a small margin on most platforms. Once moving to tuned memory, performance differences between higher speeds were minimal, with AMD systems again leveling off around DDR5-6000 and the Ryzen 7 9800X3D showing virtually no sensitivity to memory speed. Intel followed a similar diminishing-returns pattern, with little benefit beyond mid-range tuned memory.
If time is money for you, memory speed could be beneficial if you're encoding a really long project on a codec that responds well to memory speed differences. However for the average consumer, as long as you stay away from JEDEC there's not a huge difference between most tuned kits.
PugetBench for Adobe Photoshop (Photo Editing)
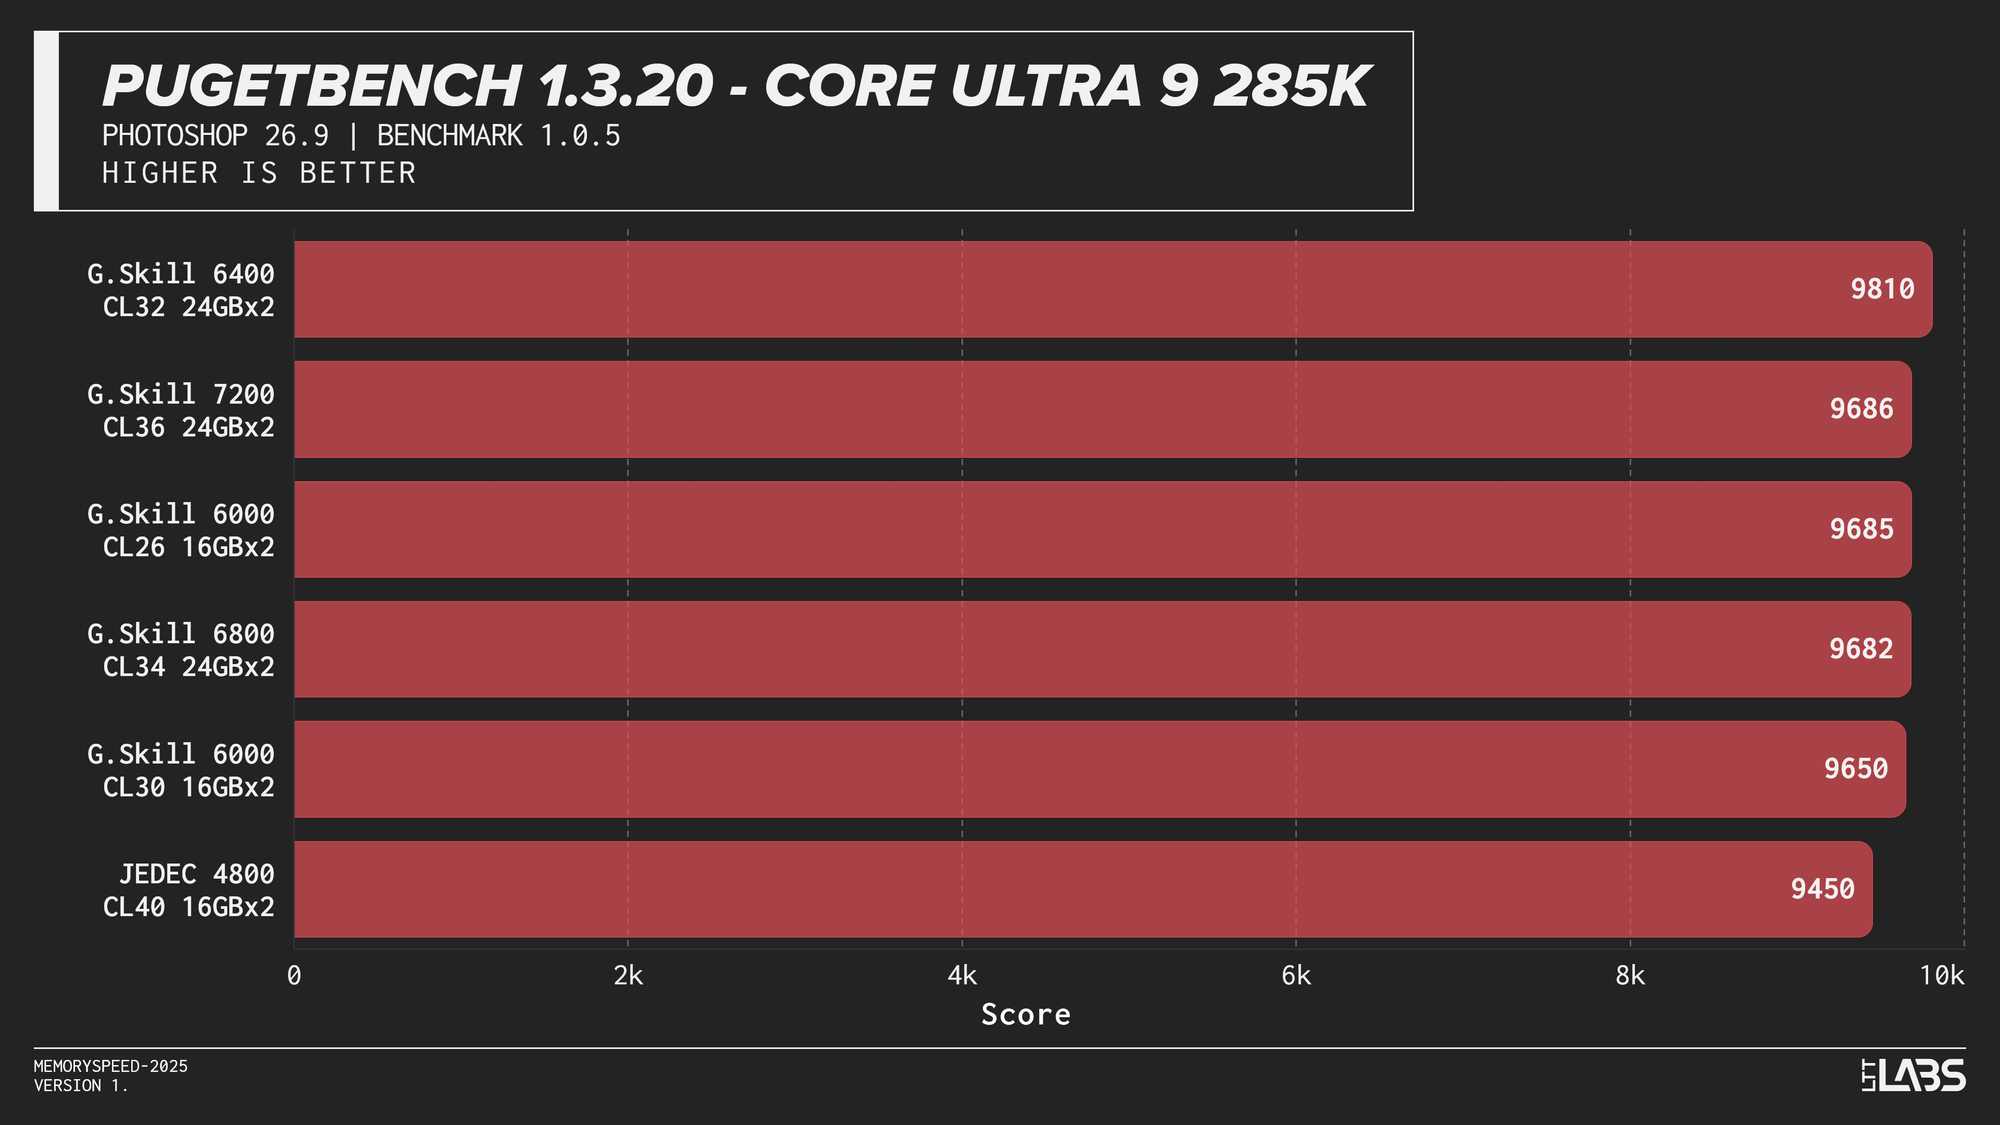
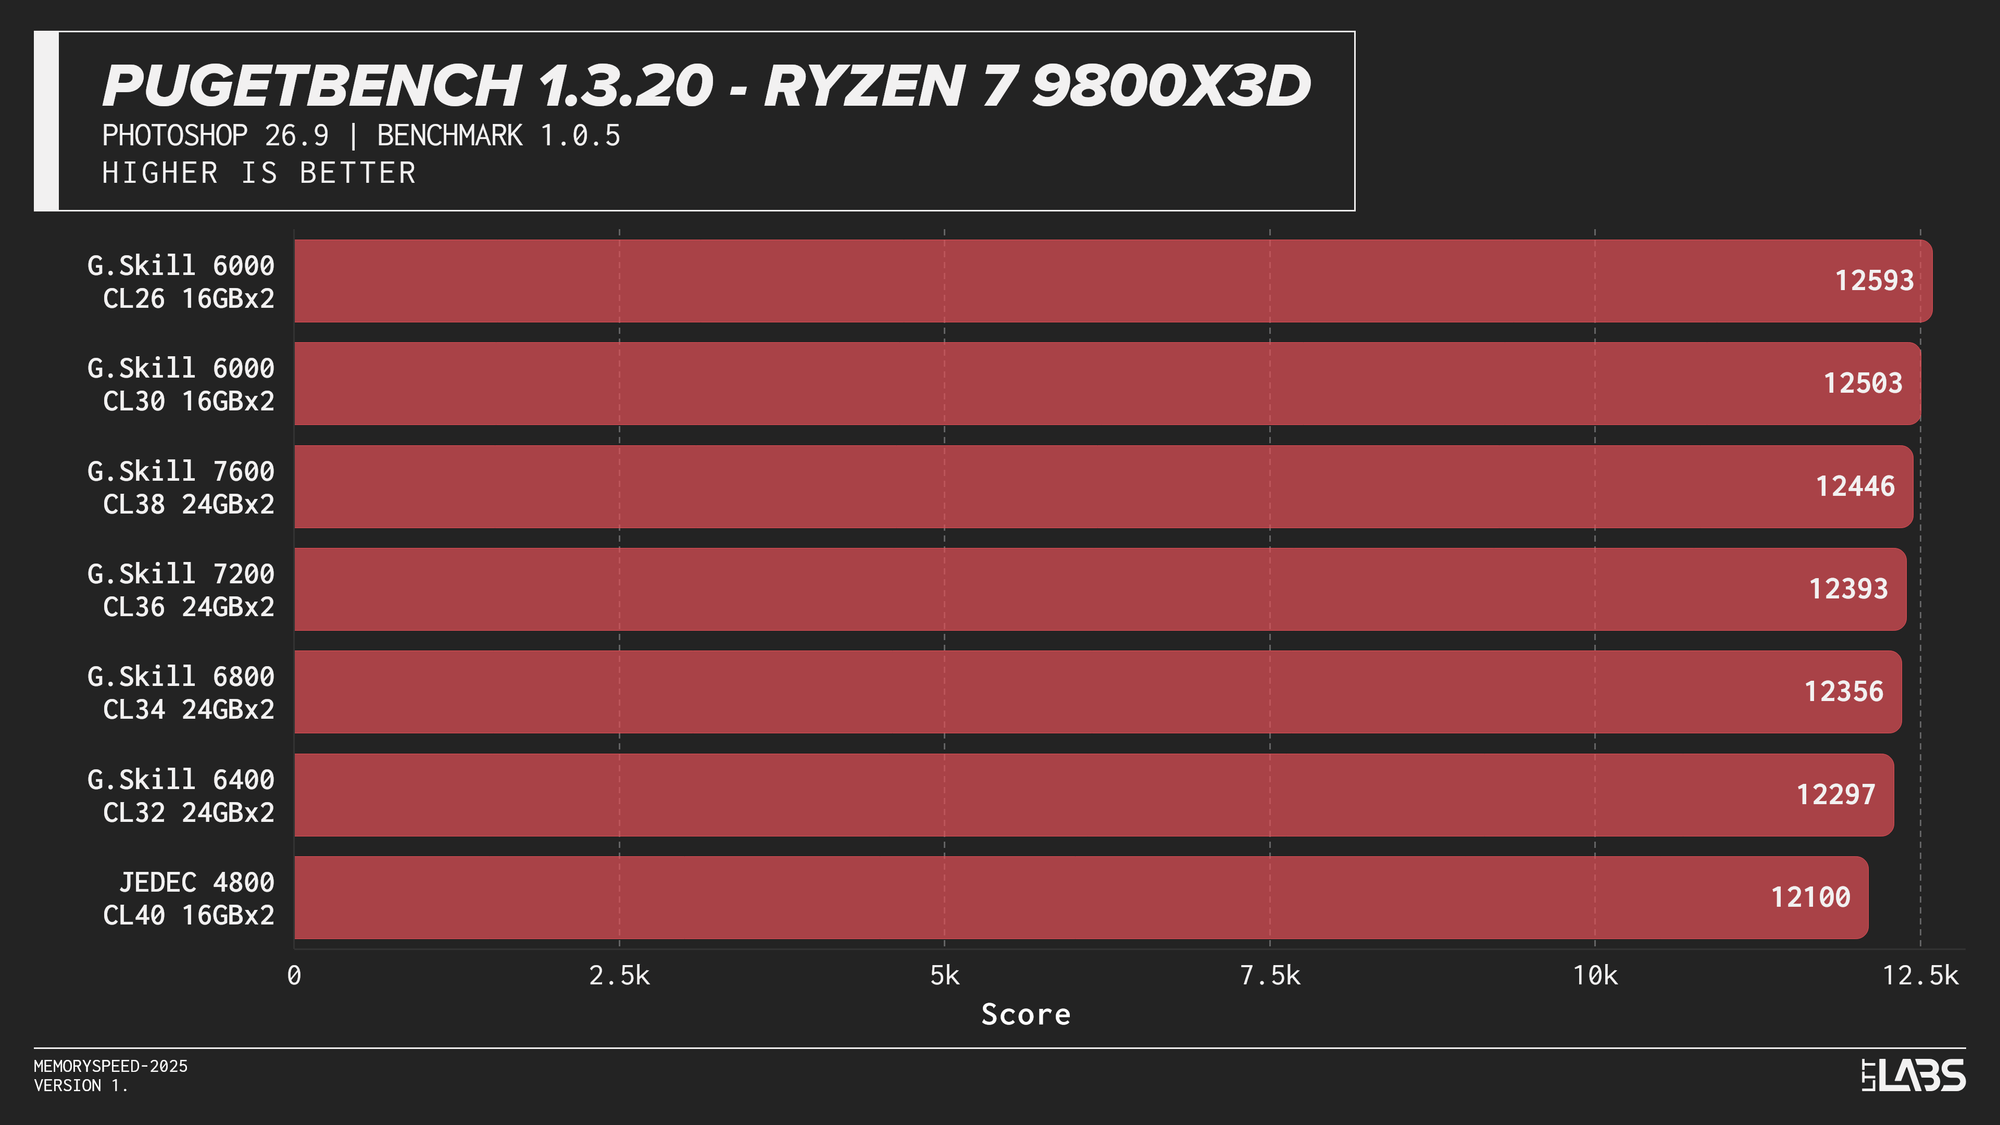
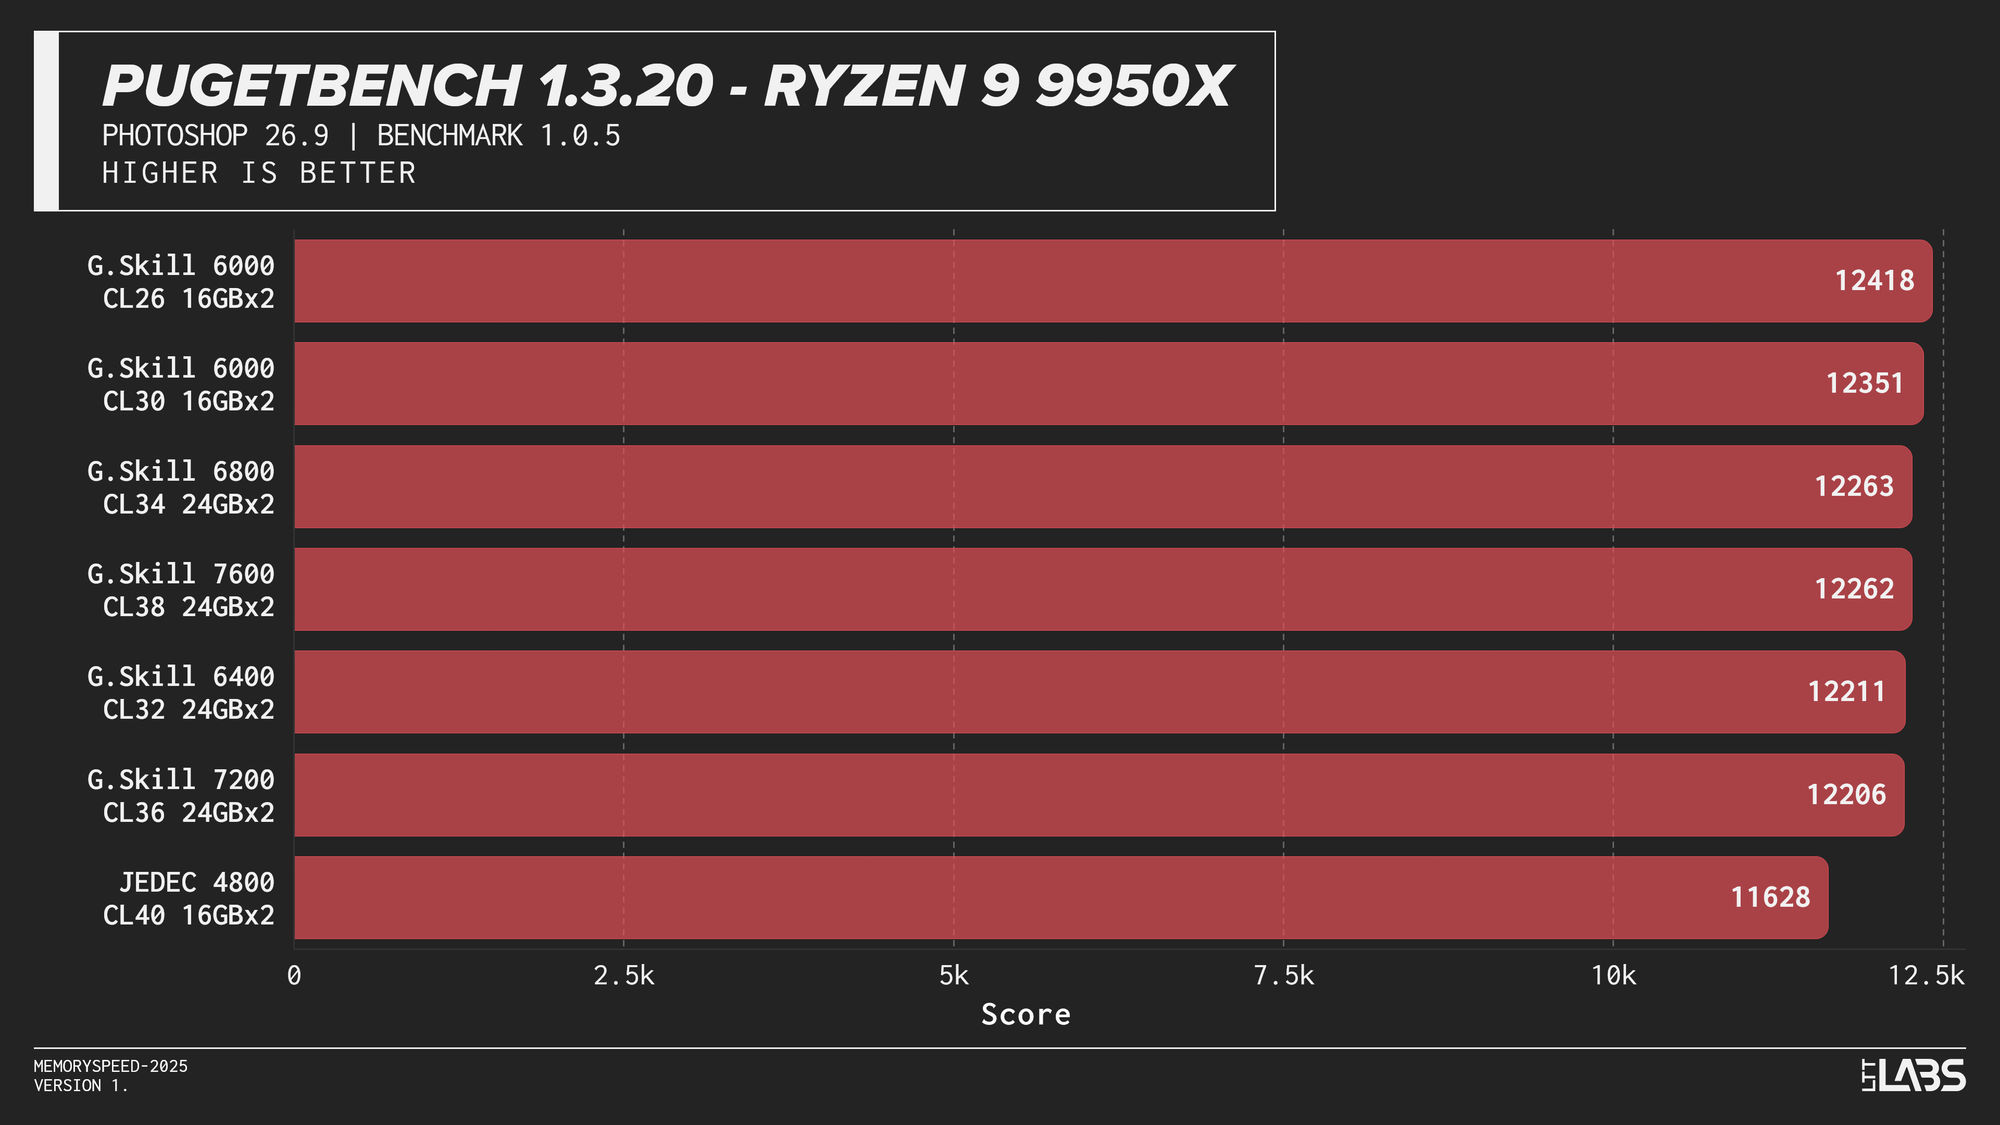
PugetBench for Adobe Photoshop
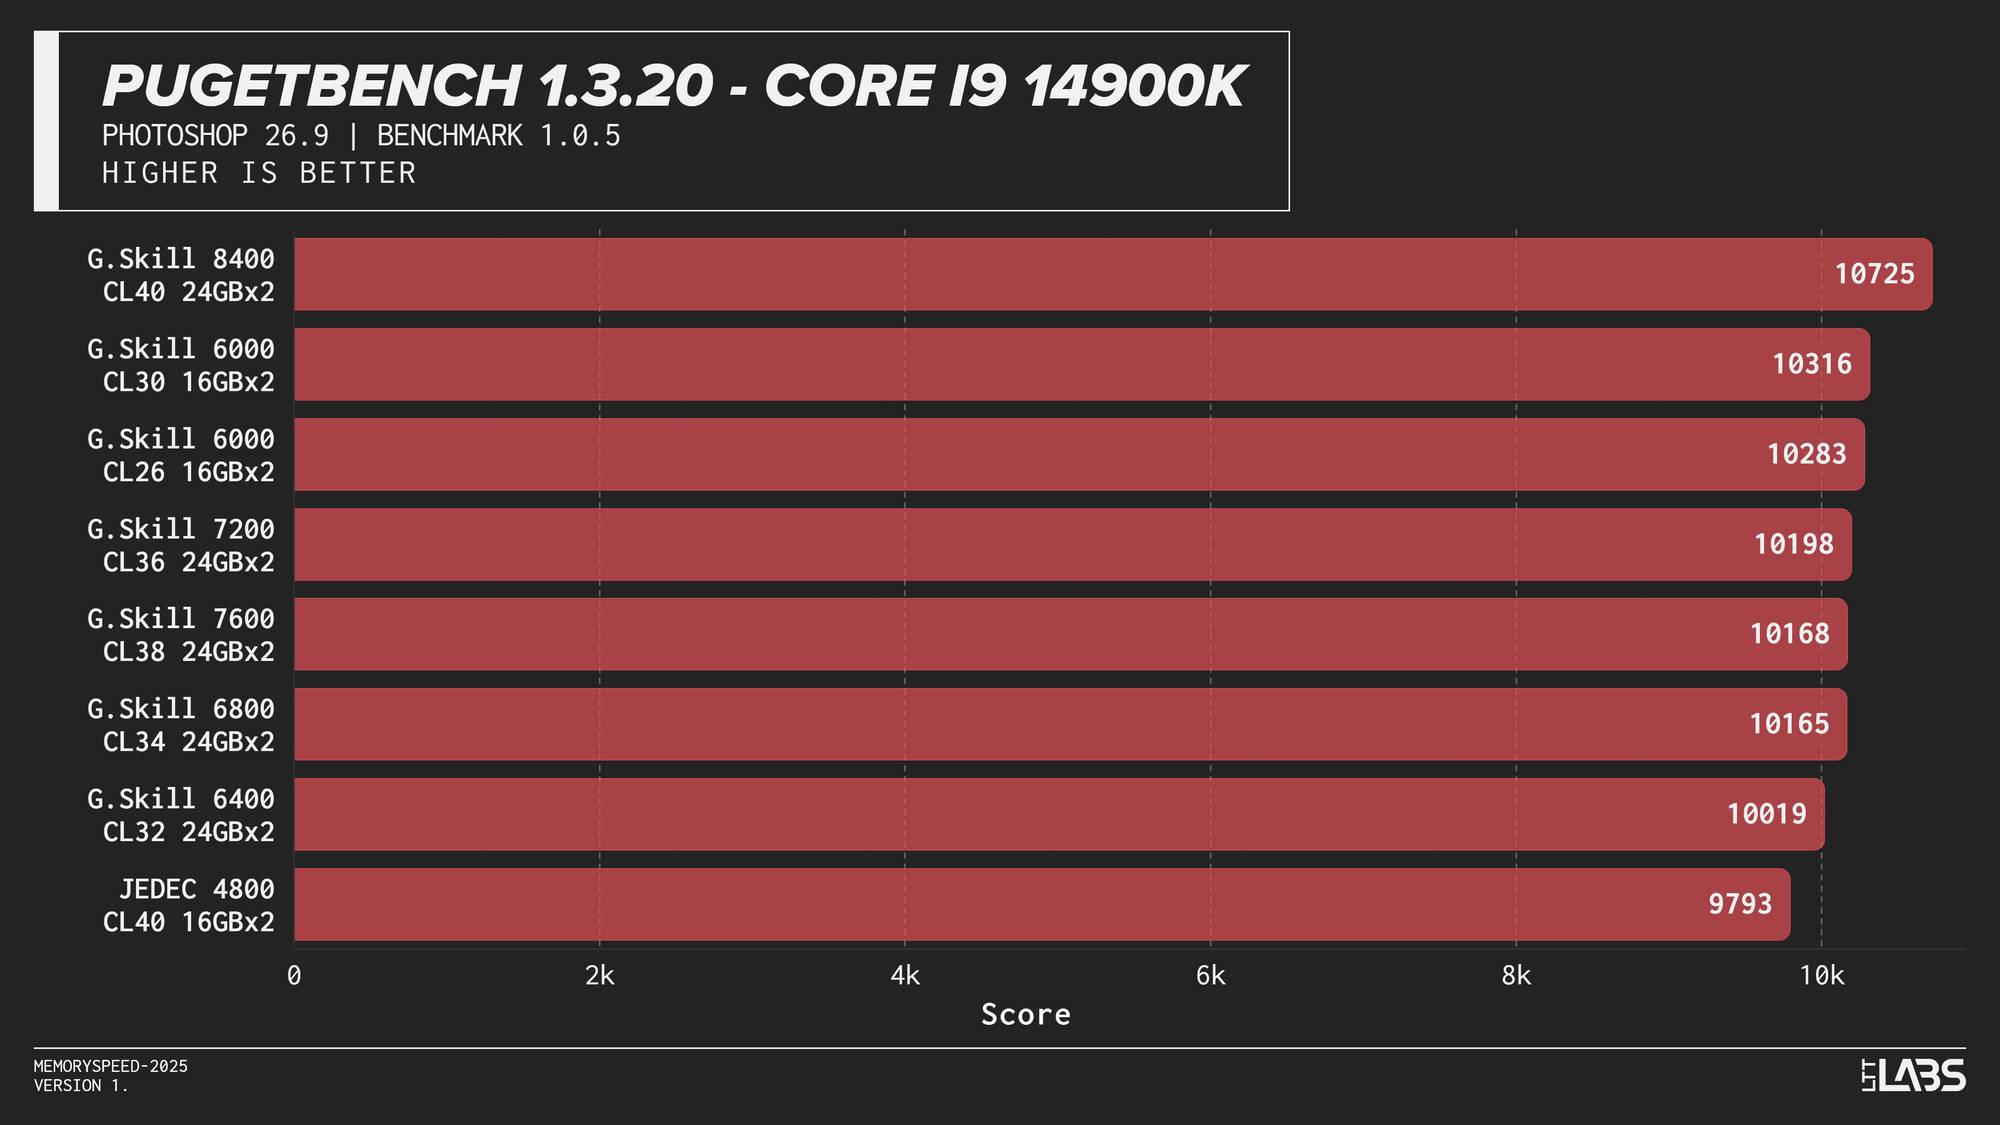
In the PugetBench Photoshop benchmark, JEDEC performance was consistently lower across all platforms.JEDEC performance was consistently lower across all platforms. Beyond that, there was some modest scaling. The Ryzen 7 9800X3D showed some sensitivity, peaking at 6000 MT/s again followed by the faster memory speeds. The Ryzen 9 9950X behaved similarly but to a lesser extent than the 3D V-cache equipped chip. Again, the sweet spot here of 6000 MT/s remains king.
Intel showed slightly more separation. The Core i9-14900K sees a good increase going from JEDEC to any XMP based kit by at least 200 points, with the 8400 MT/s kit crushing all of the other overclocked kits by at least 400 points. The Core Ultra 9 285K again grouped most tuned configurations closely together once moving past JEDEC, seeing not much benefit from one kit to another. Interestingly, the 6400 kit tops the chart by over 200 points, but this should not be taken as typical behaviour.
Subsequently, photo editing professionals will likely not see a large benefit from going much faster unless the most premium of kits is within reach. It would be better to upgrade your CPU and GPU for significant gains.
PugetBench for Adobe Premiere Pro (Video Editing)
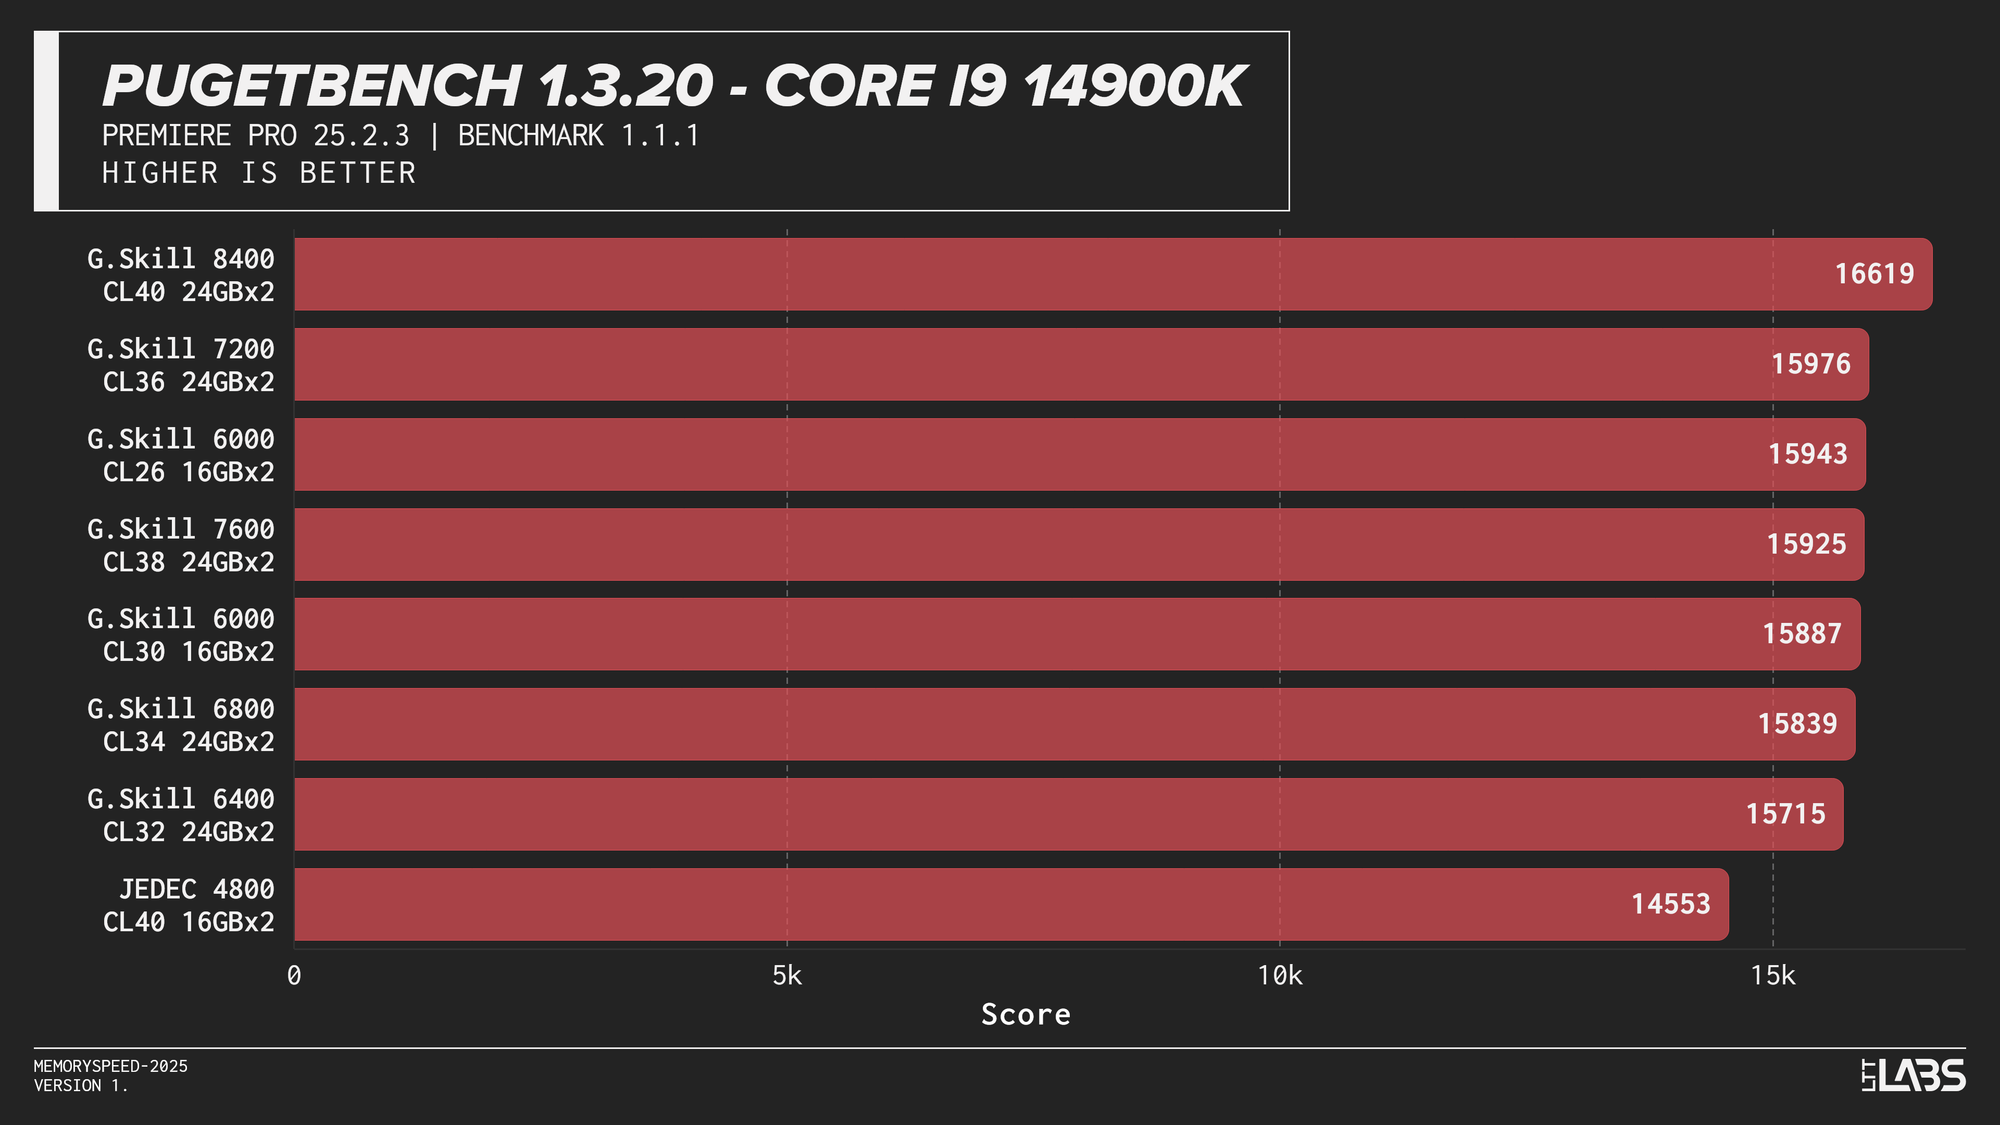
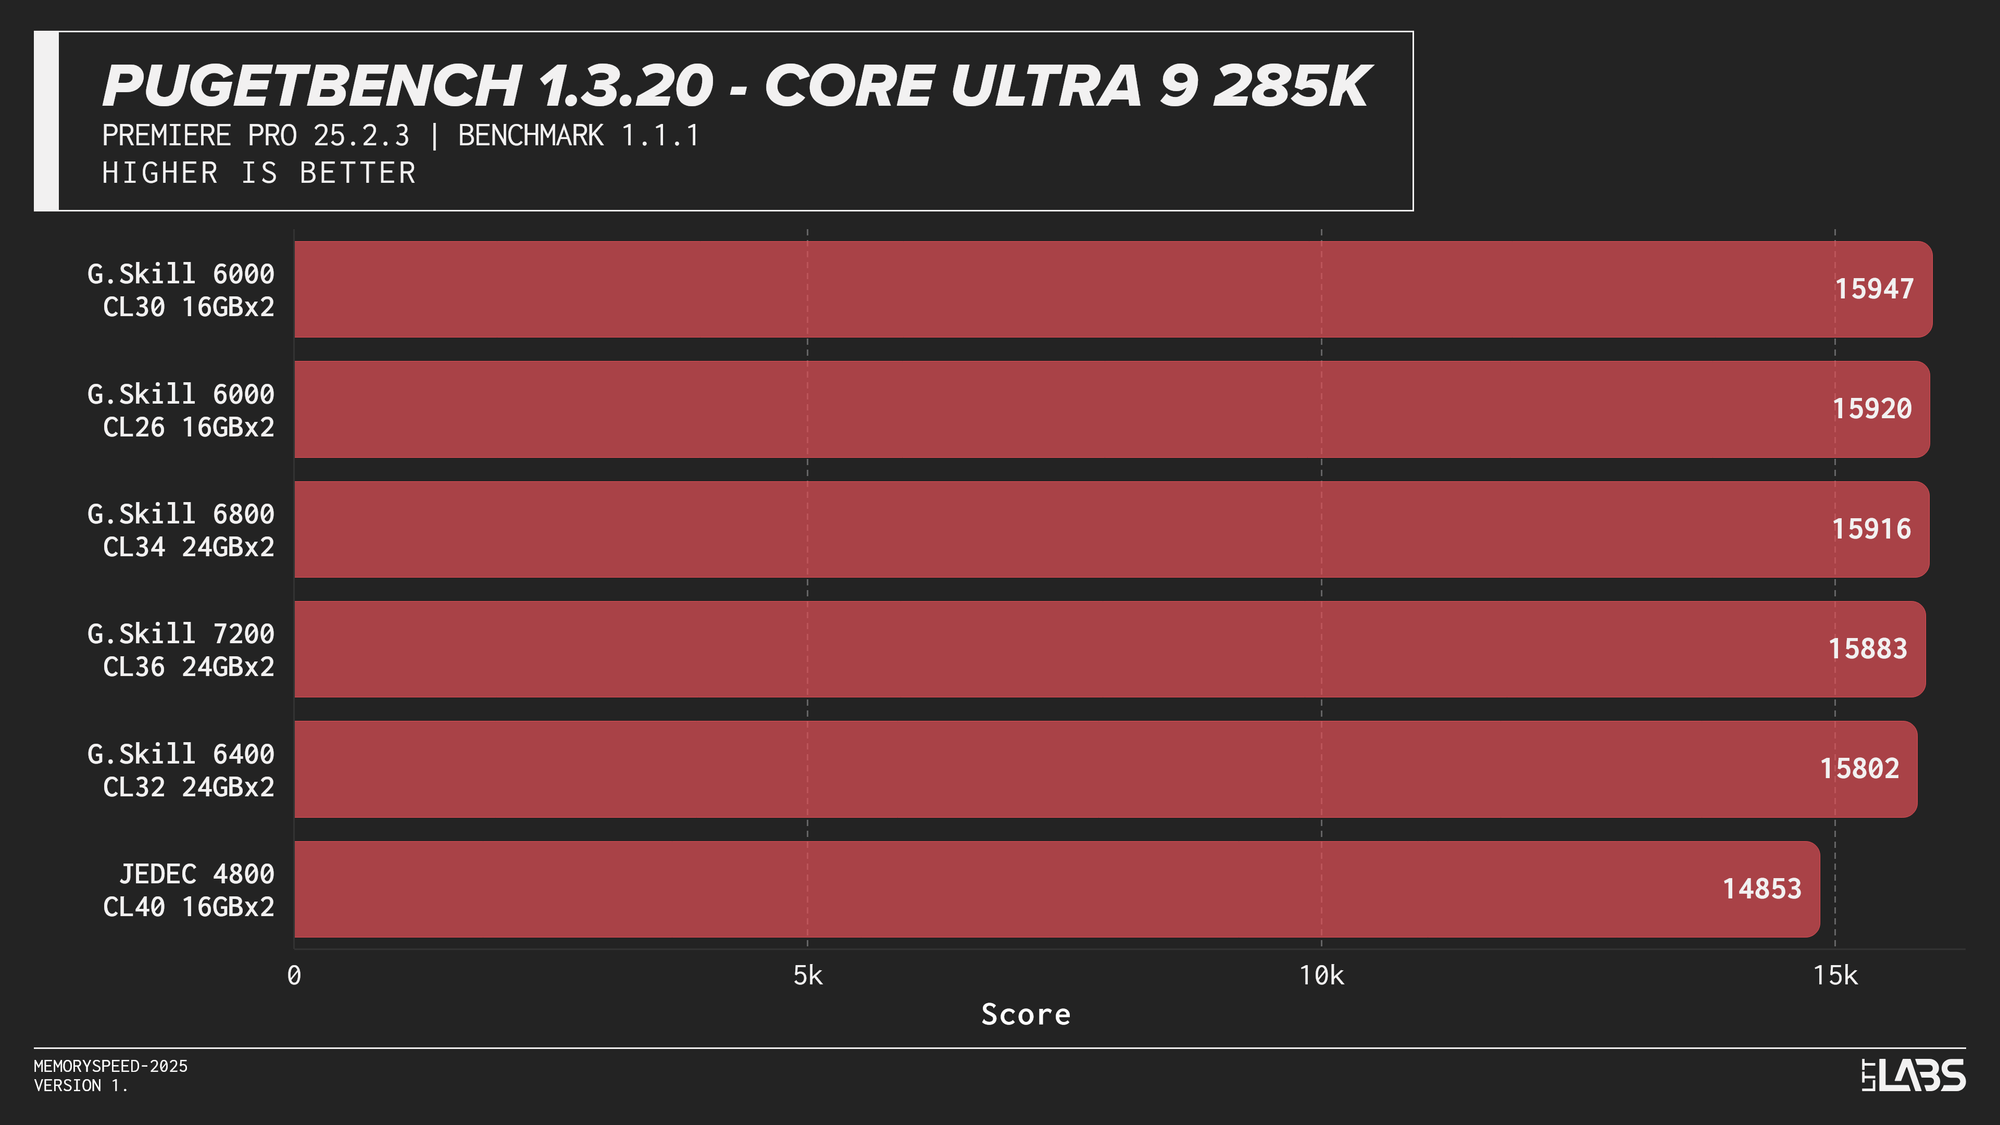
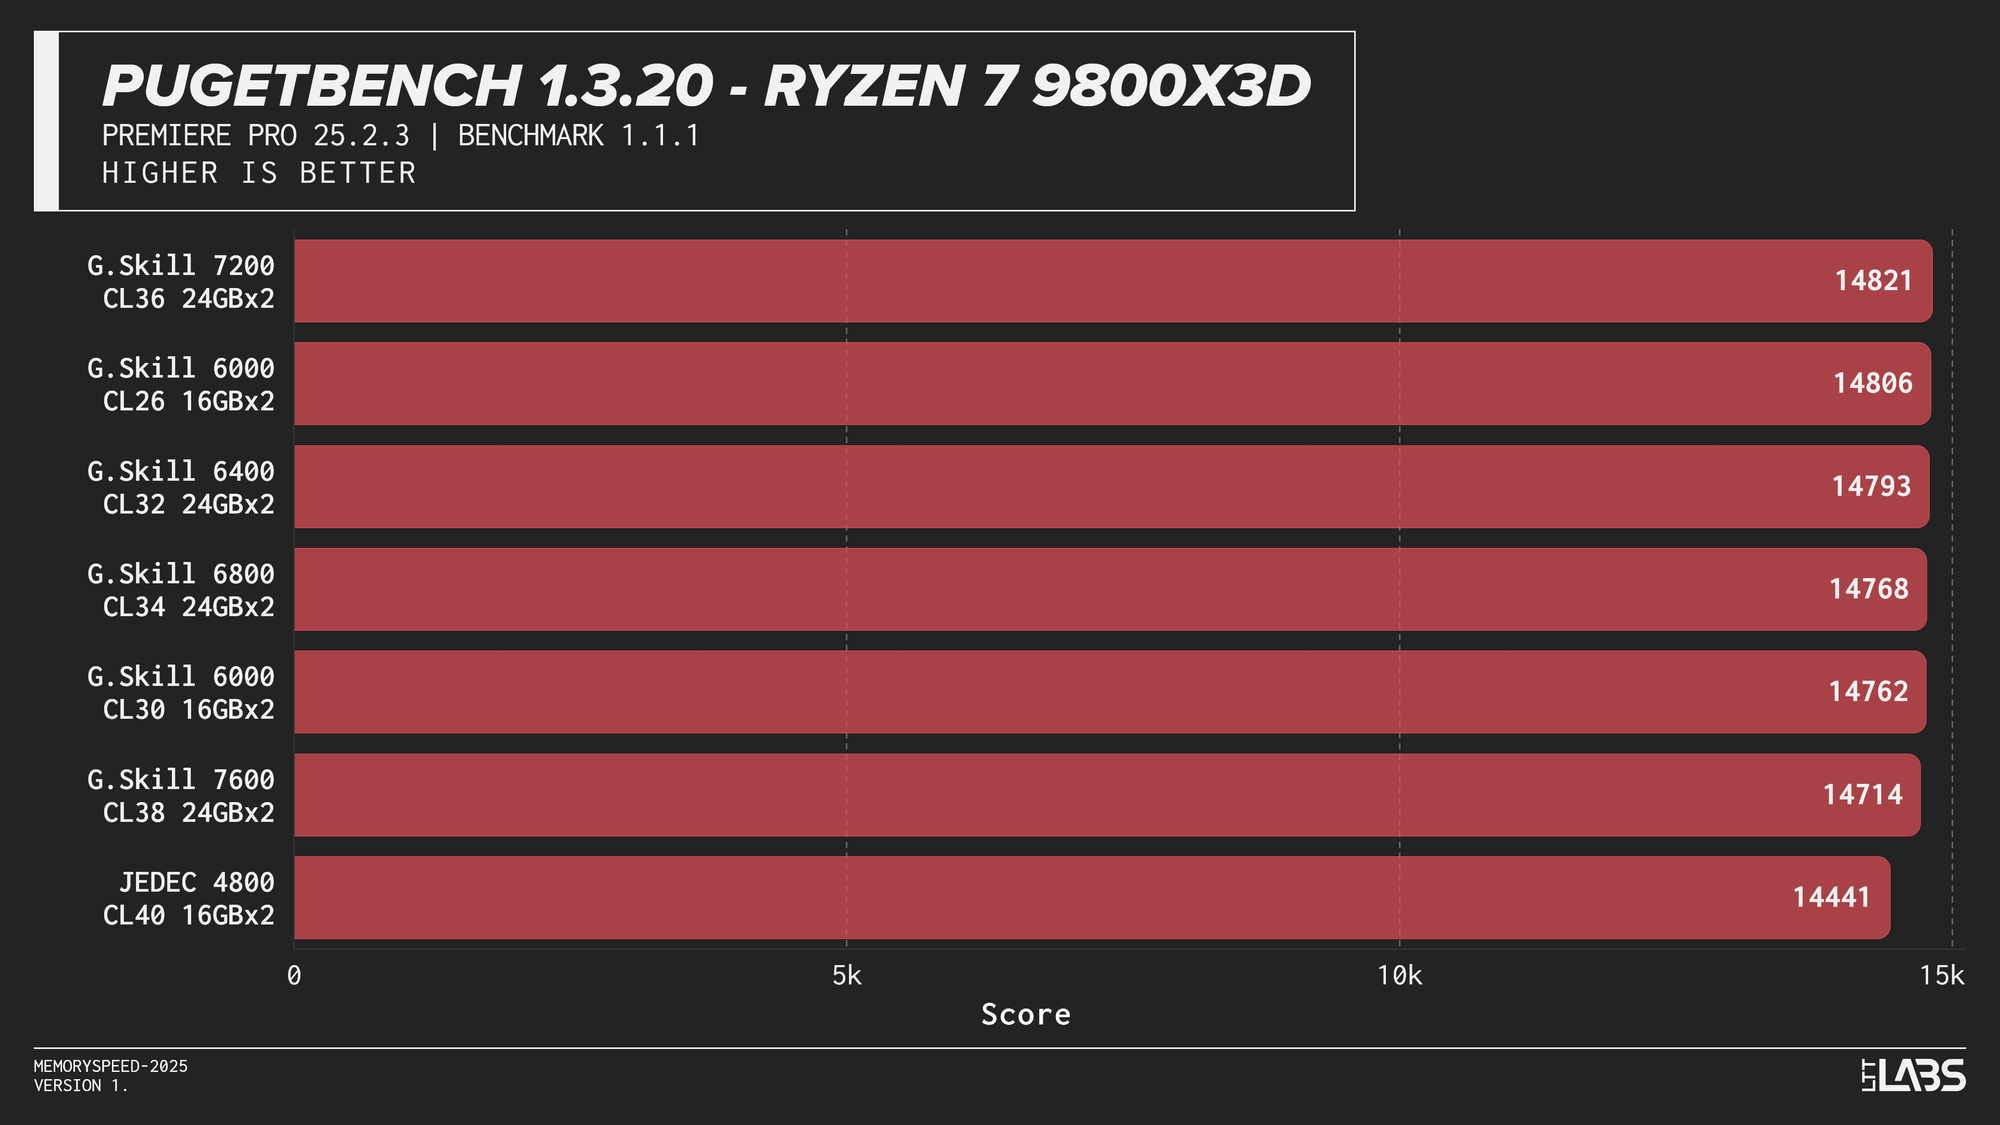
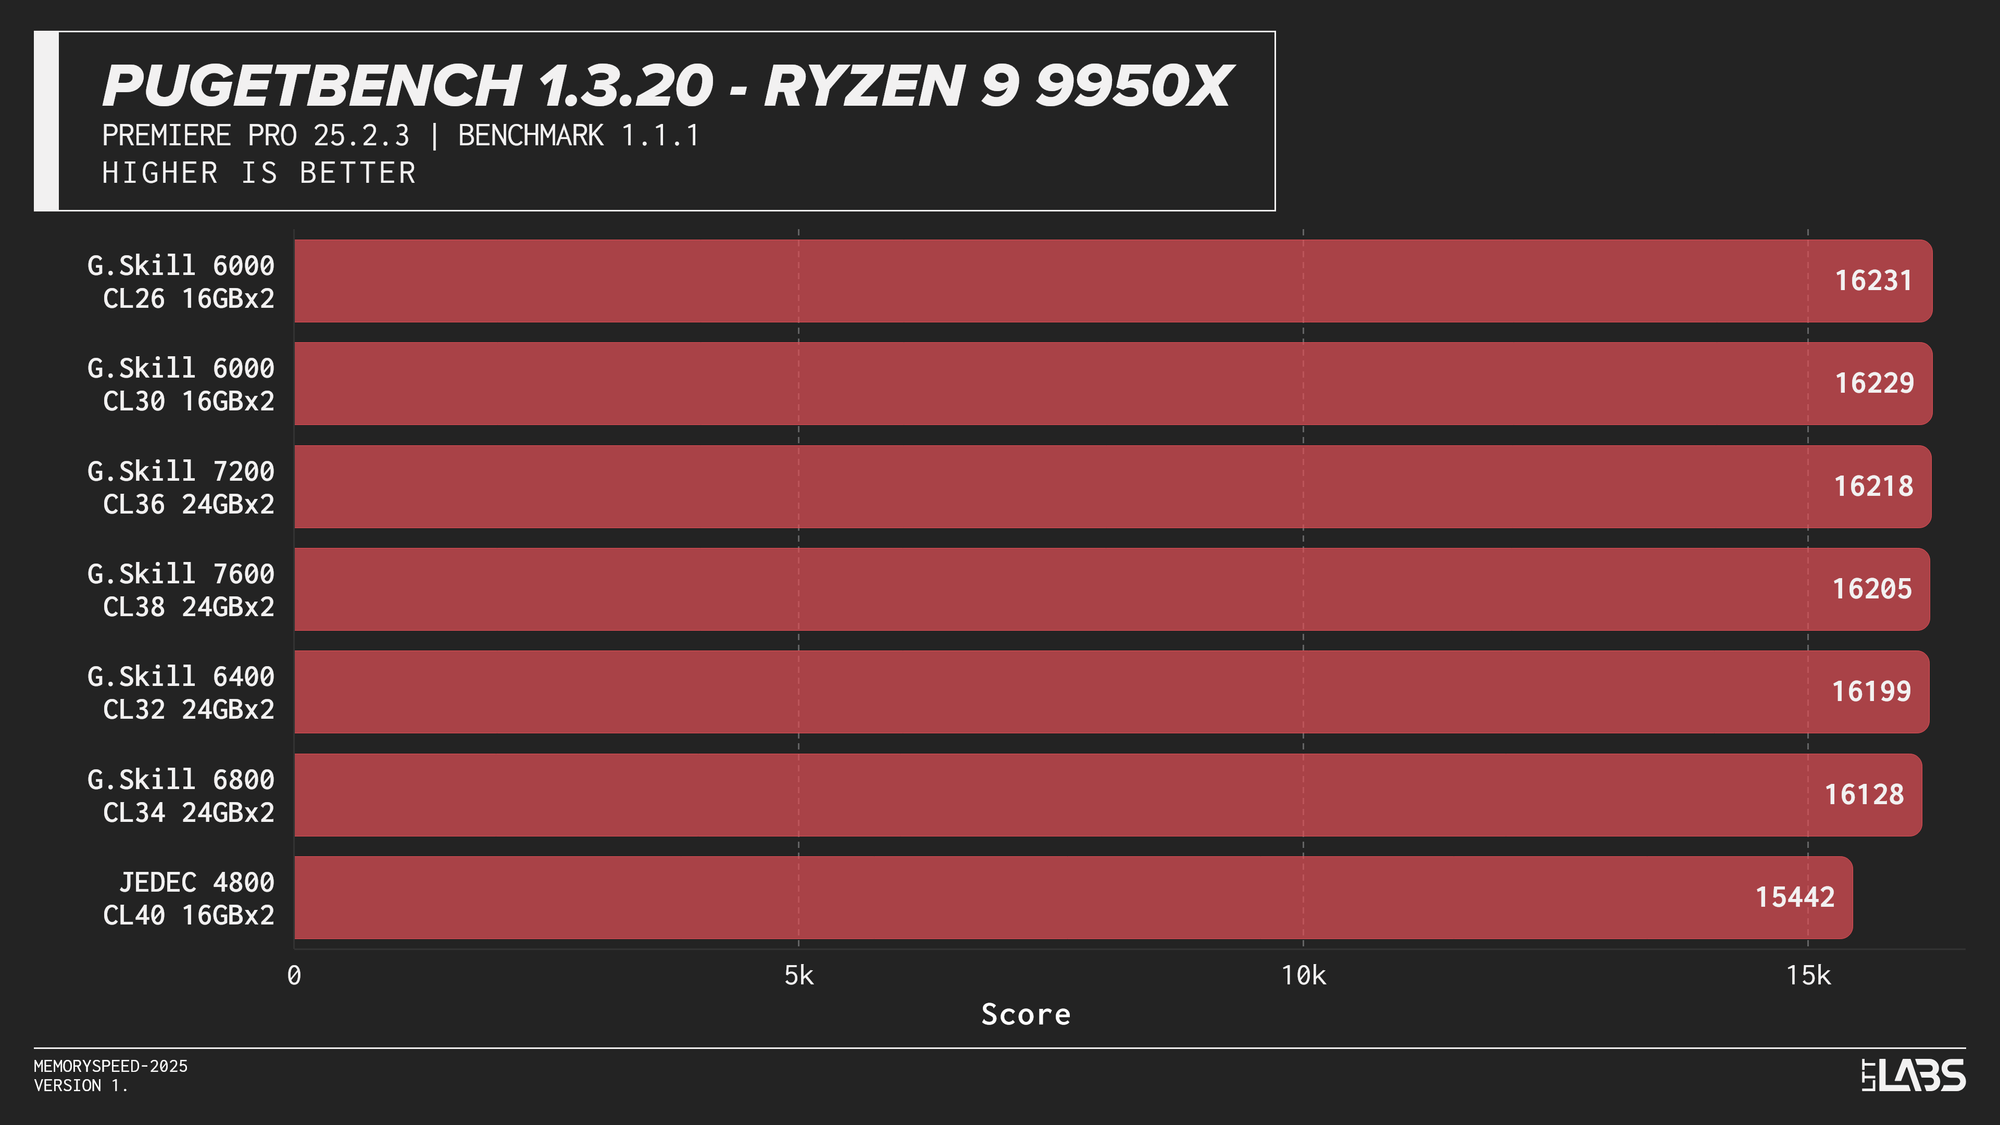
PugetBench for Adobe Premiere Pro
The Premier Pro Benchmark performance was largely unchanged across memory configurations on all platforms. Once moving away from JEDEC, most results clustered tightly together, with differences small enough to fall within normal benchmark variance. The 8400 MT/s kit on the 14900K continues to impress however, showing significant gains over all the other kits.
This clustered behavior is expected. Premiere Pro workloads have a larger amount of GPU-accelerated tasks, so performance is driven far more by GPU compute and media engine throughput than by system memory bandwidth or latency. However, the benchmark still includes a small amount of CPU bound tasks. This likely explains why the 8400 MT/s kit occasionally scored slightly higher, similar to the HandBrake tests we just explored.
Much like photo editing, it would be far more beneficial to get a CPU or GPU upgrade for video editing tasks. At current pricing, the cost of stepping up to 8400 MT/s is large enough that the same budget could justify a GPU upgrade instead, which in most cases will have a far greater impact on performance. Make sure you ask your boss for a 5090 instead of an 8400 MT/s kit.
UL Procyon AI Text Generation (Llama 2 13B, Llama 3.1 8B, Mistral 7B, Phi 3.5 Mini)
Llama 2 13B
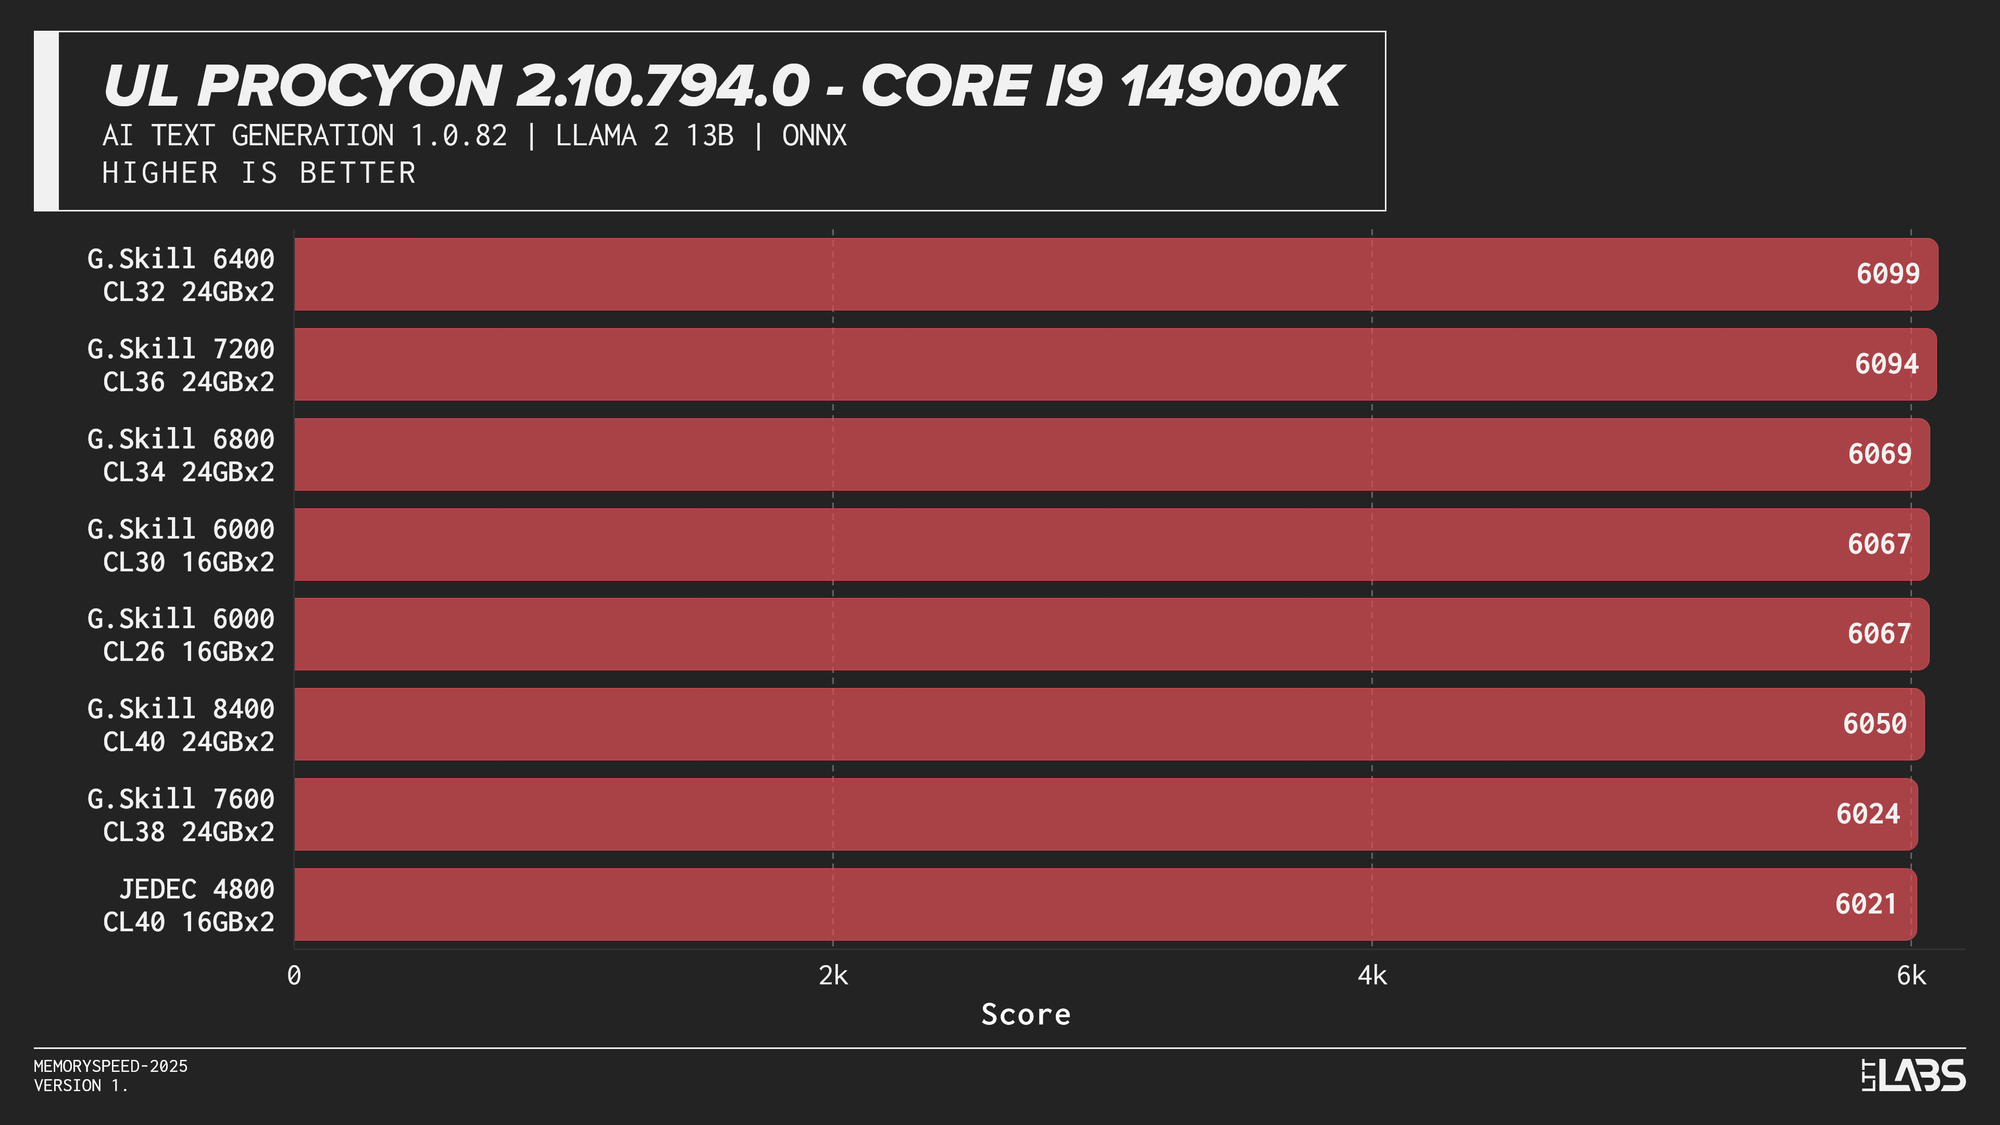
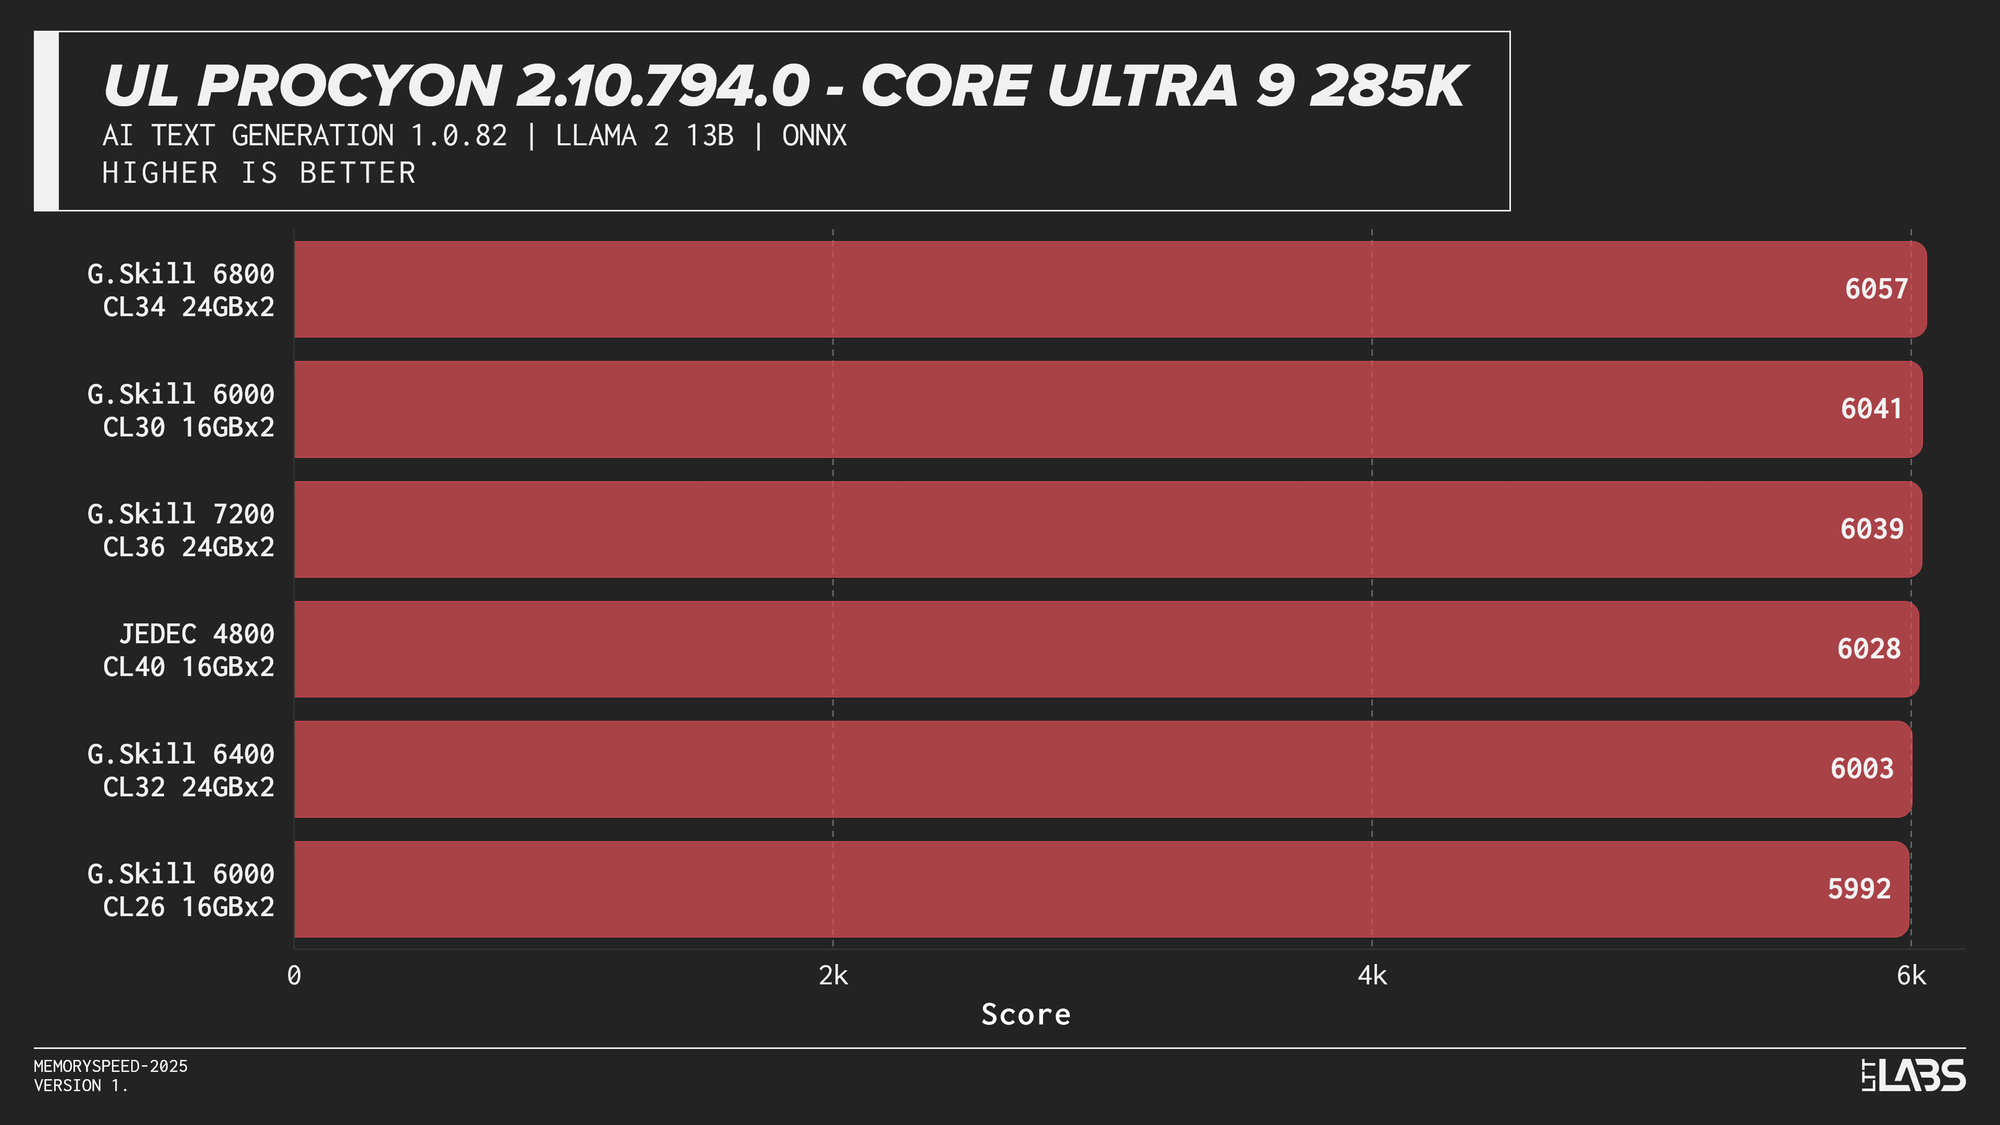
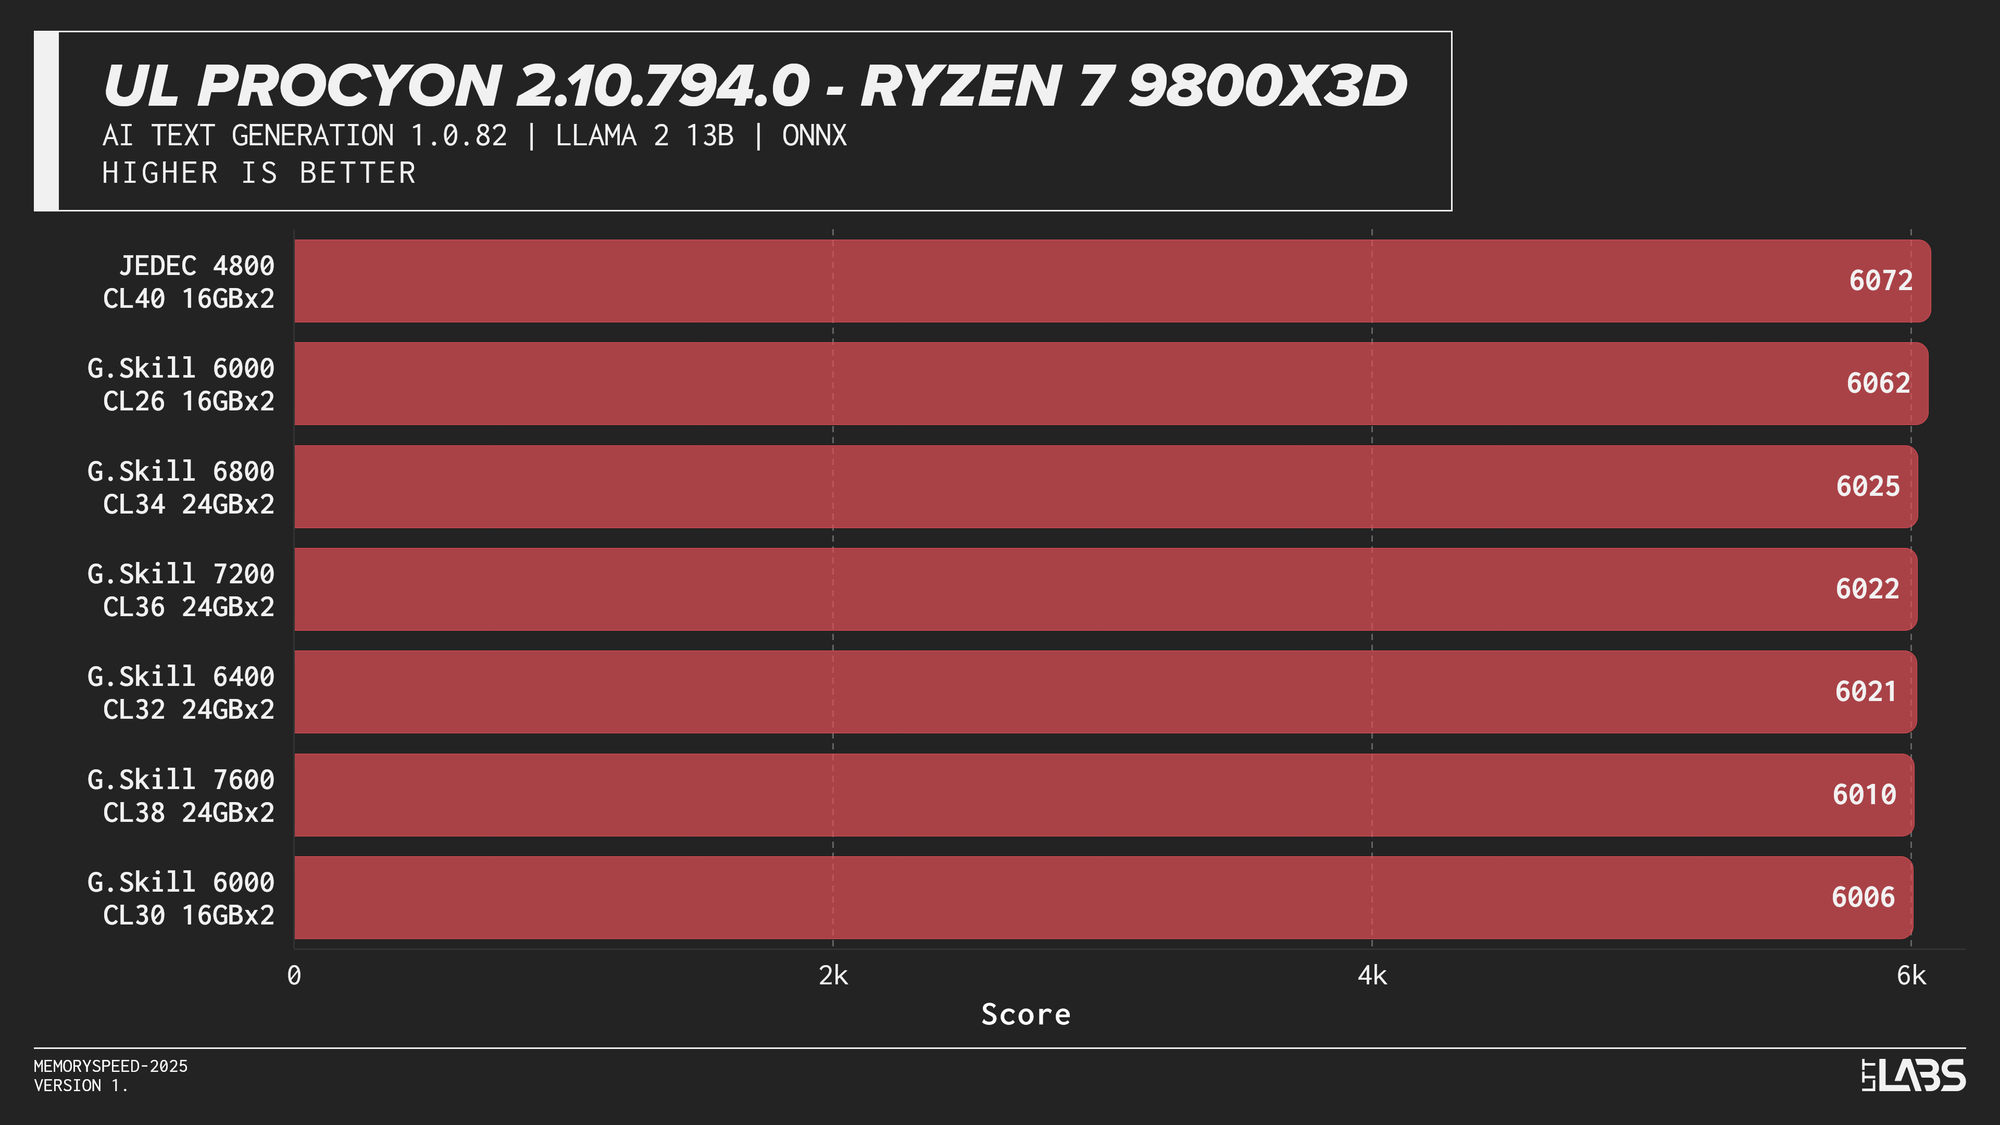
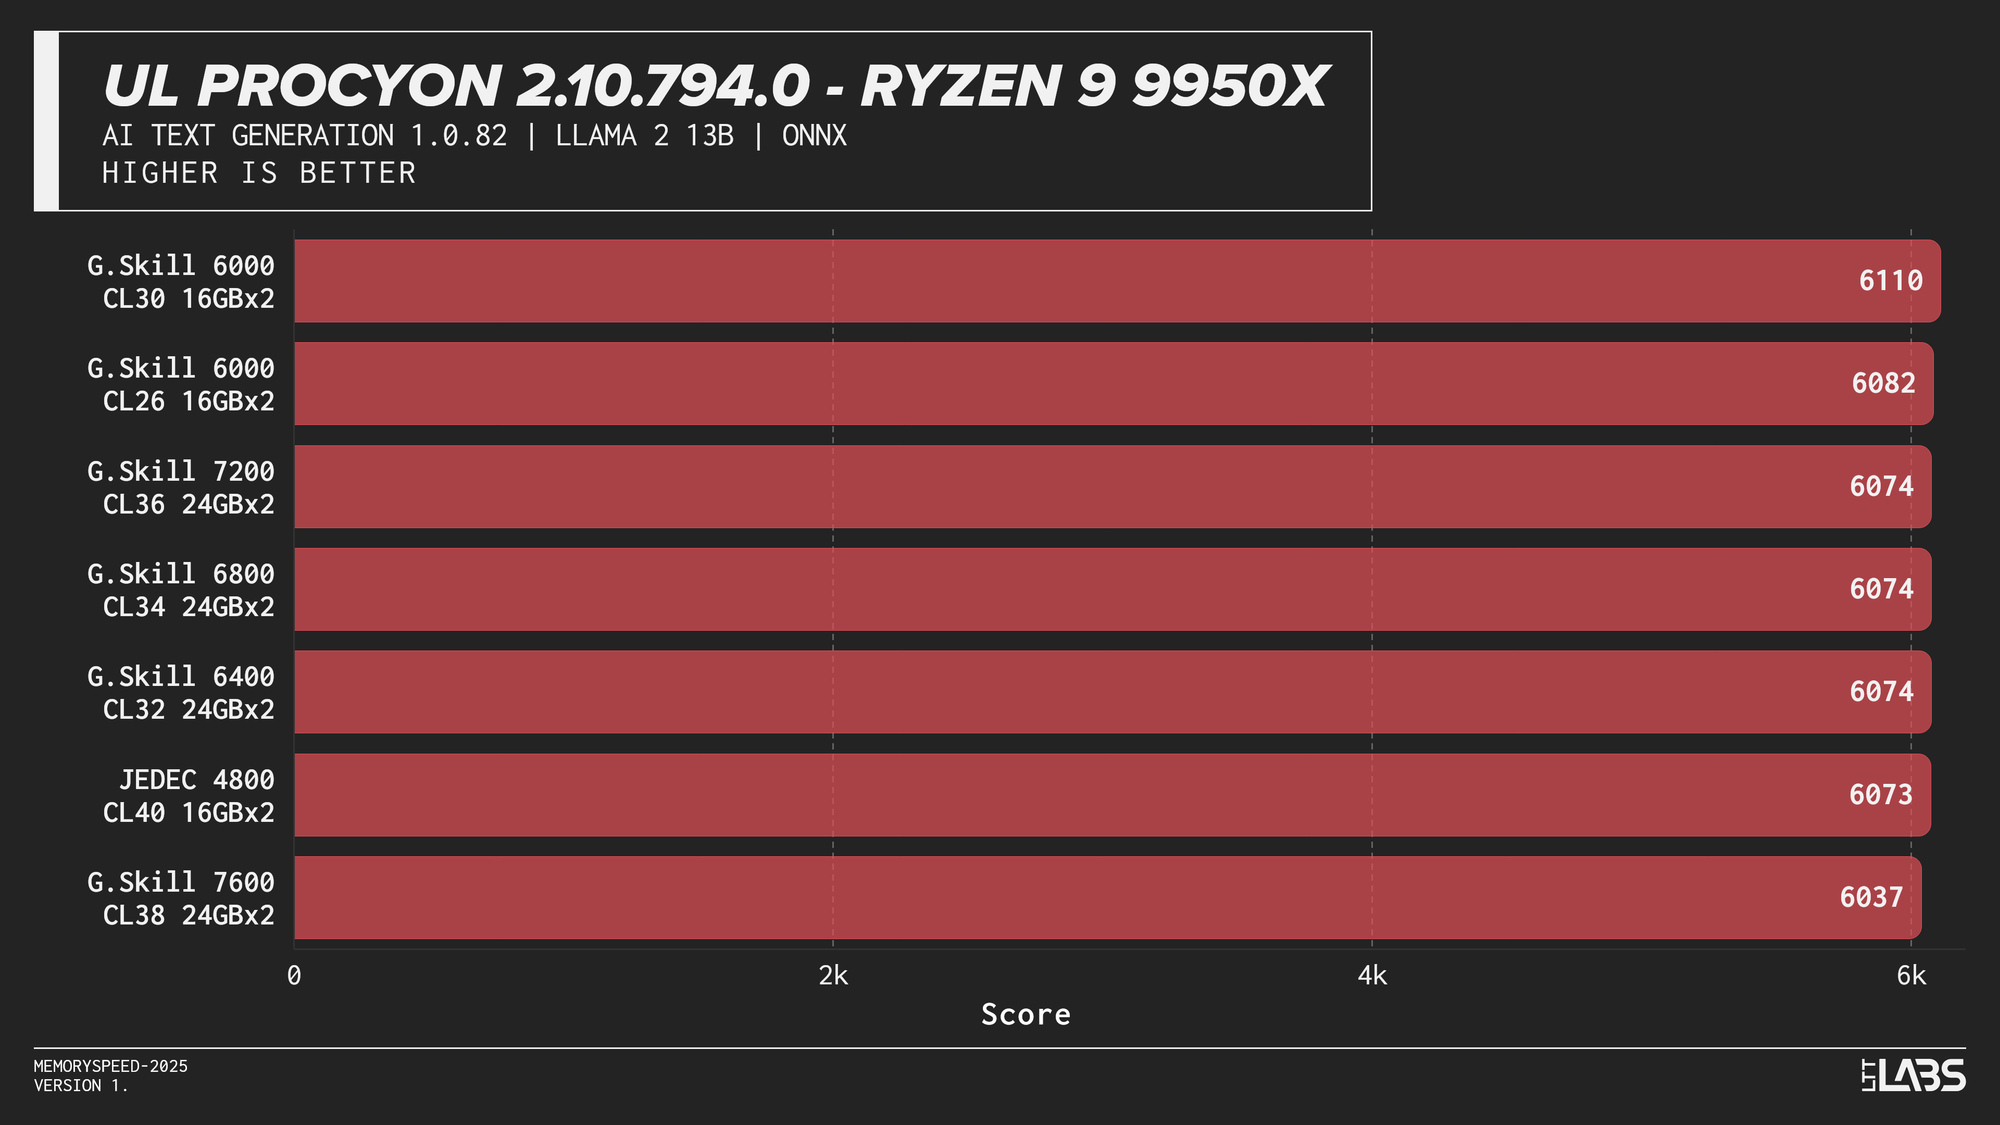
Llama 2 13B
Llama 3.1 8B
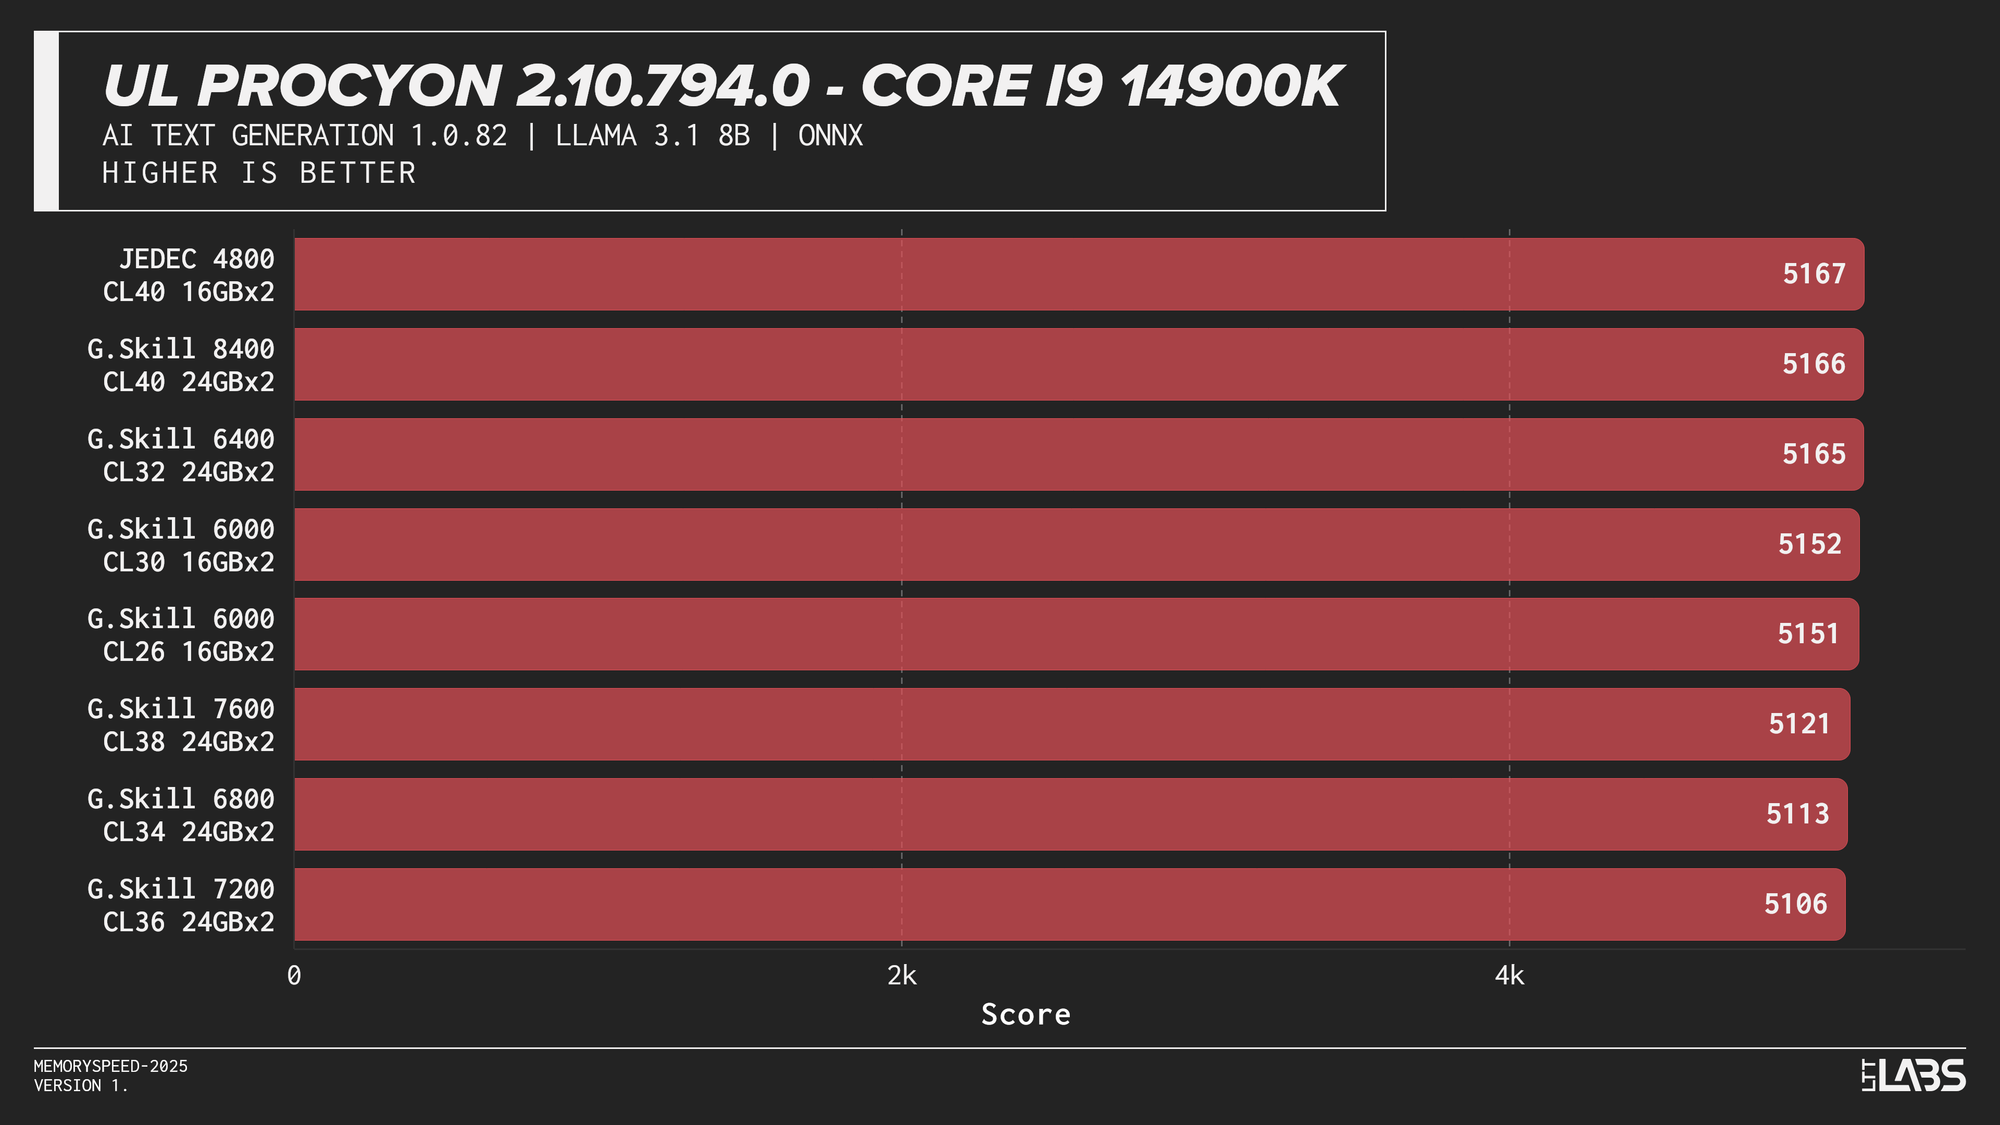
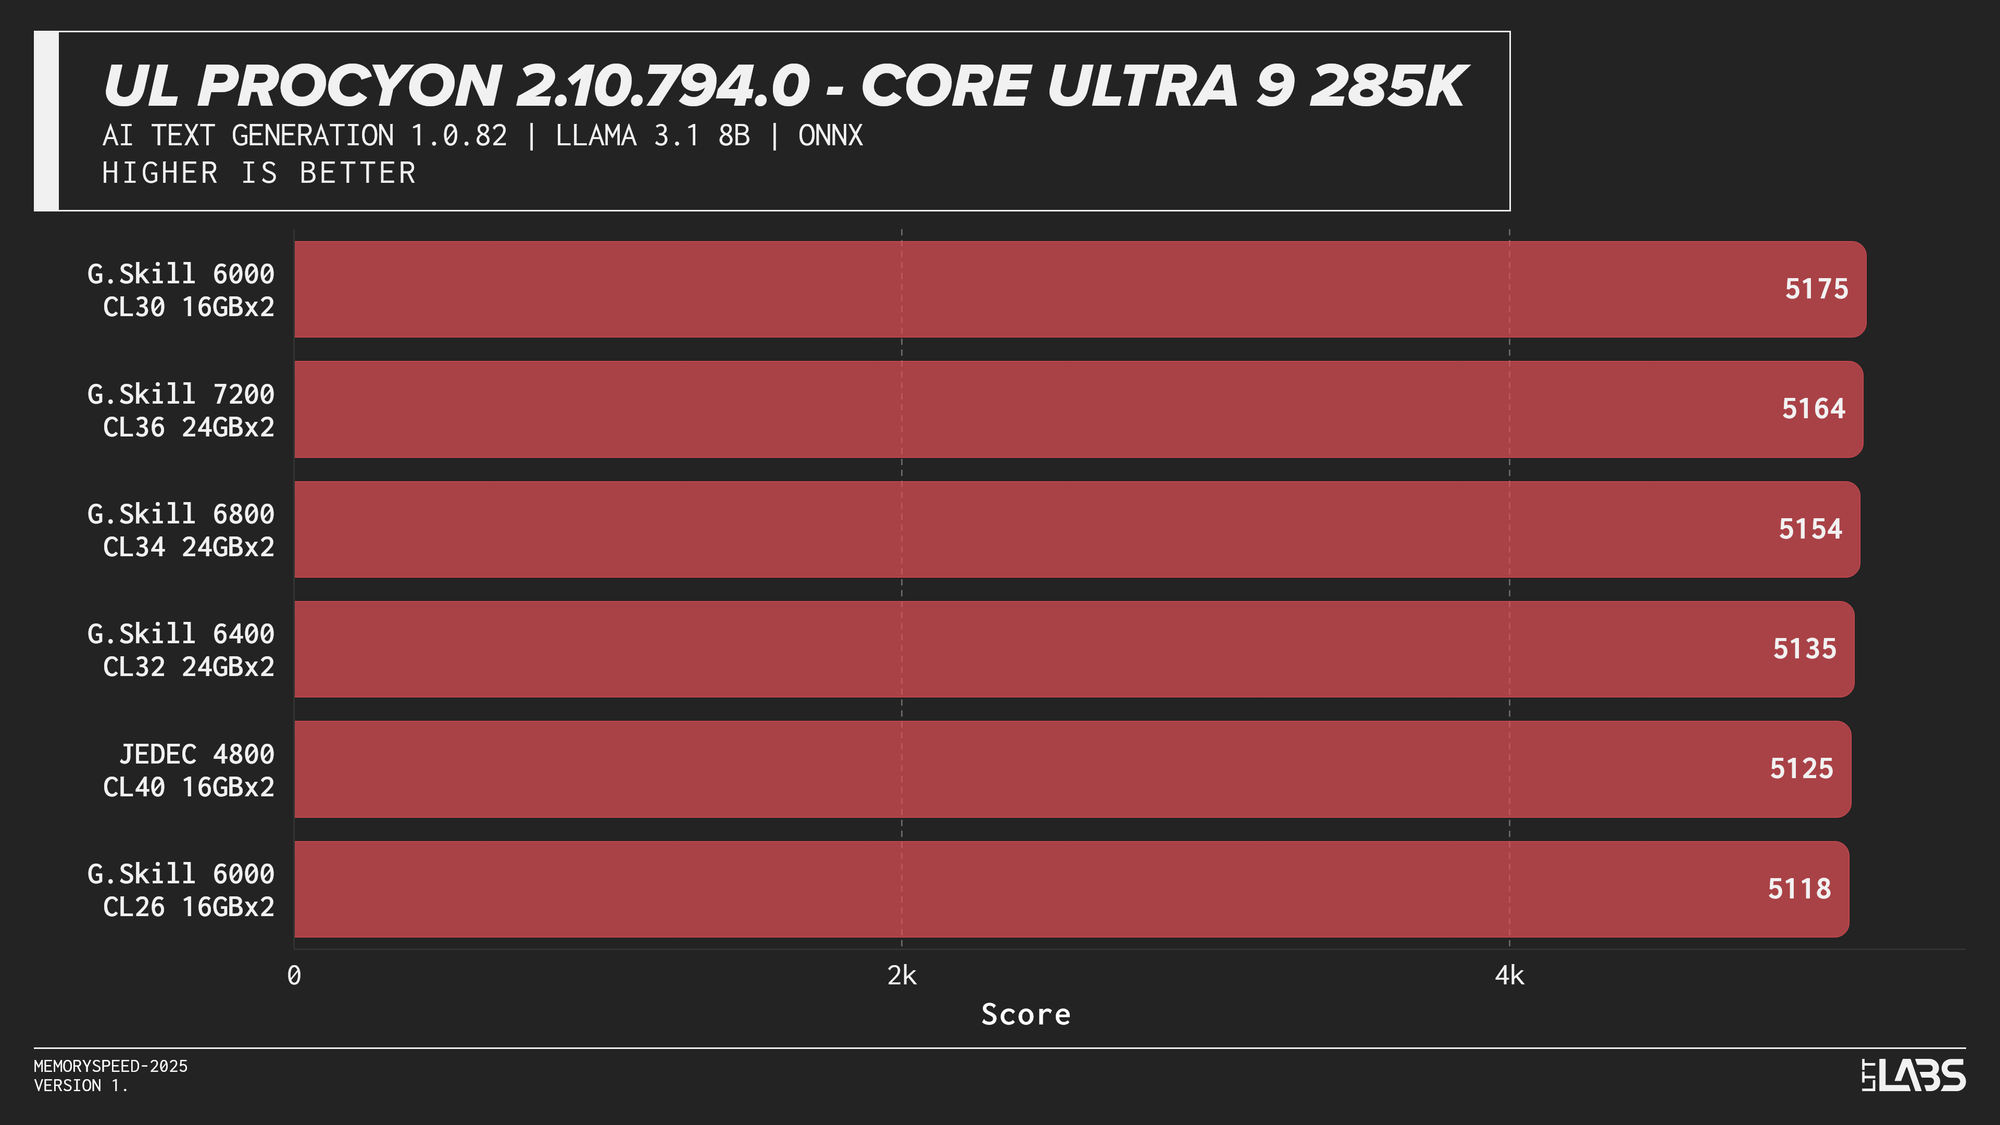
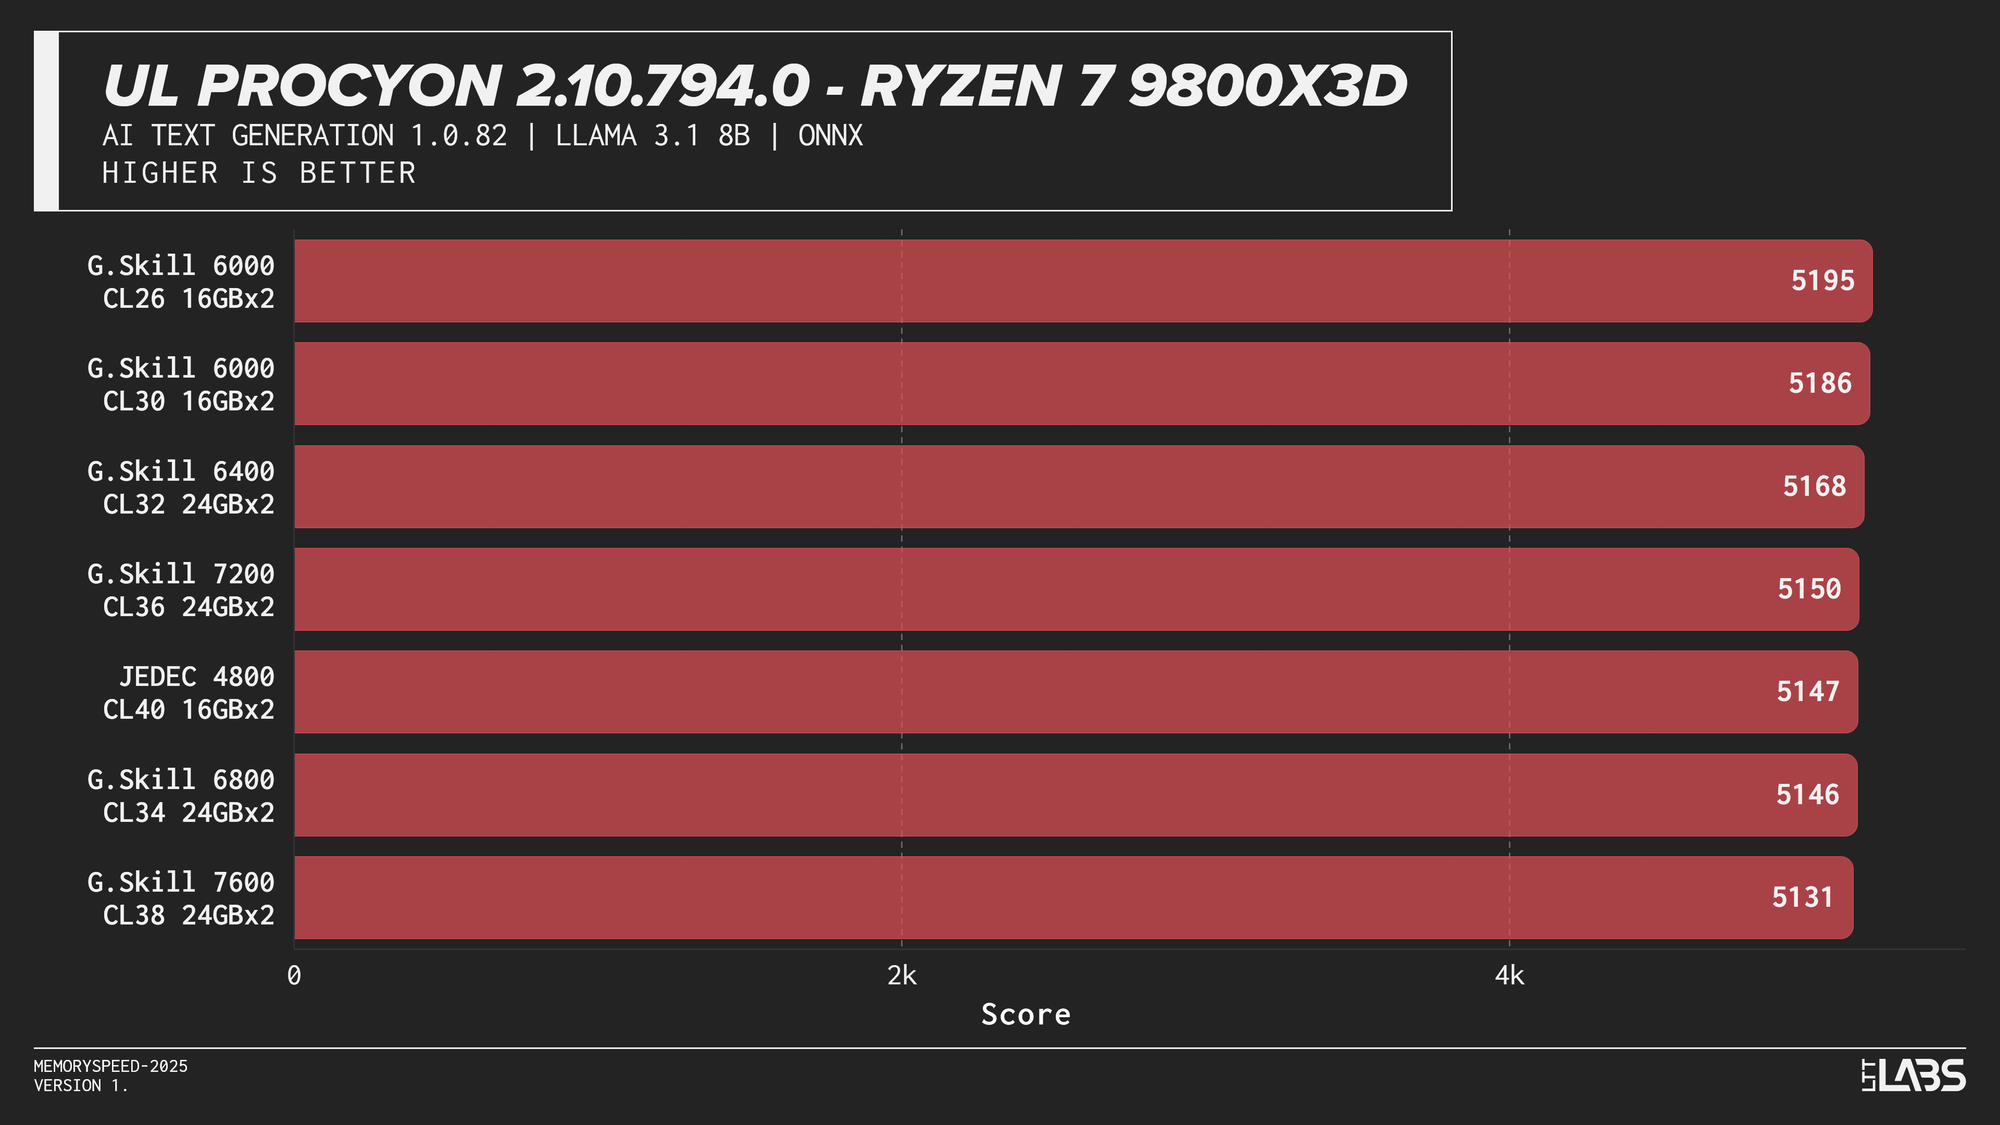
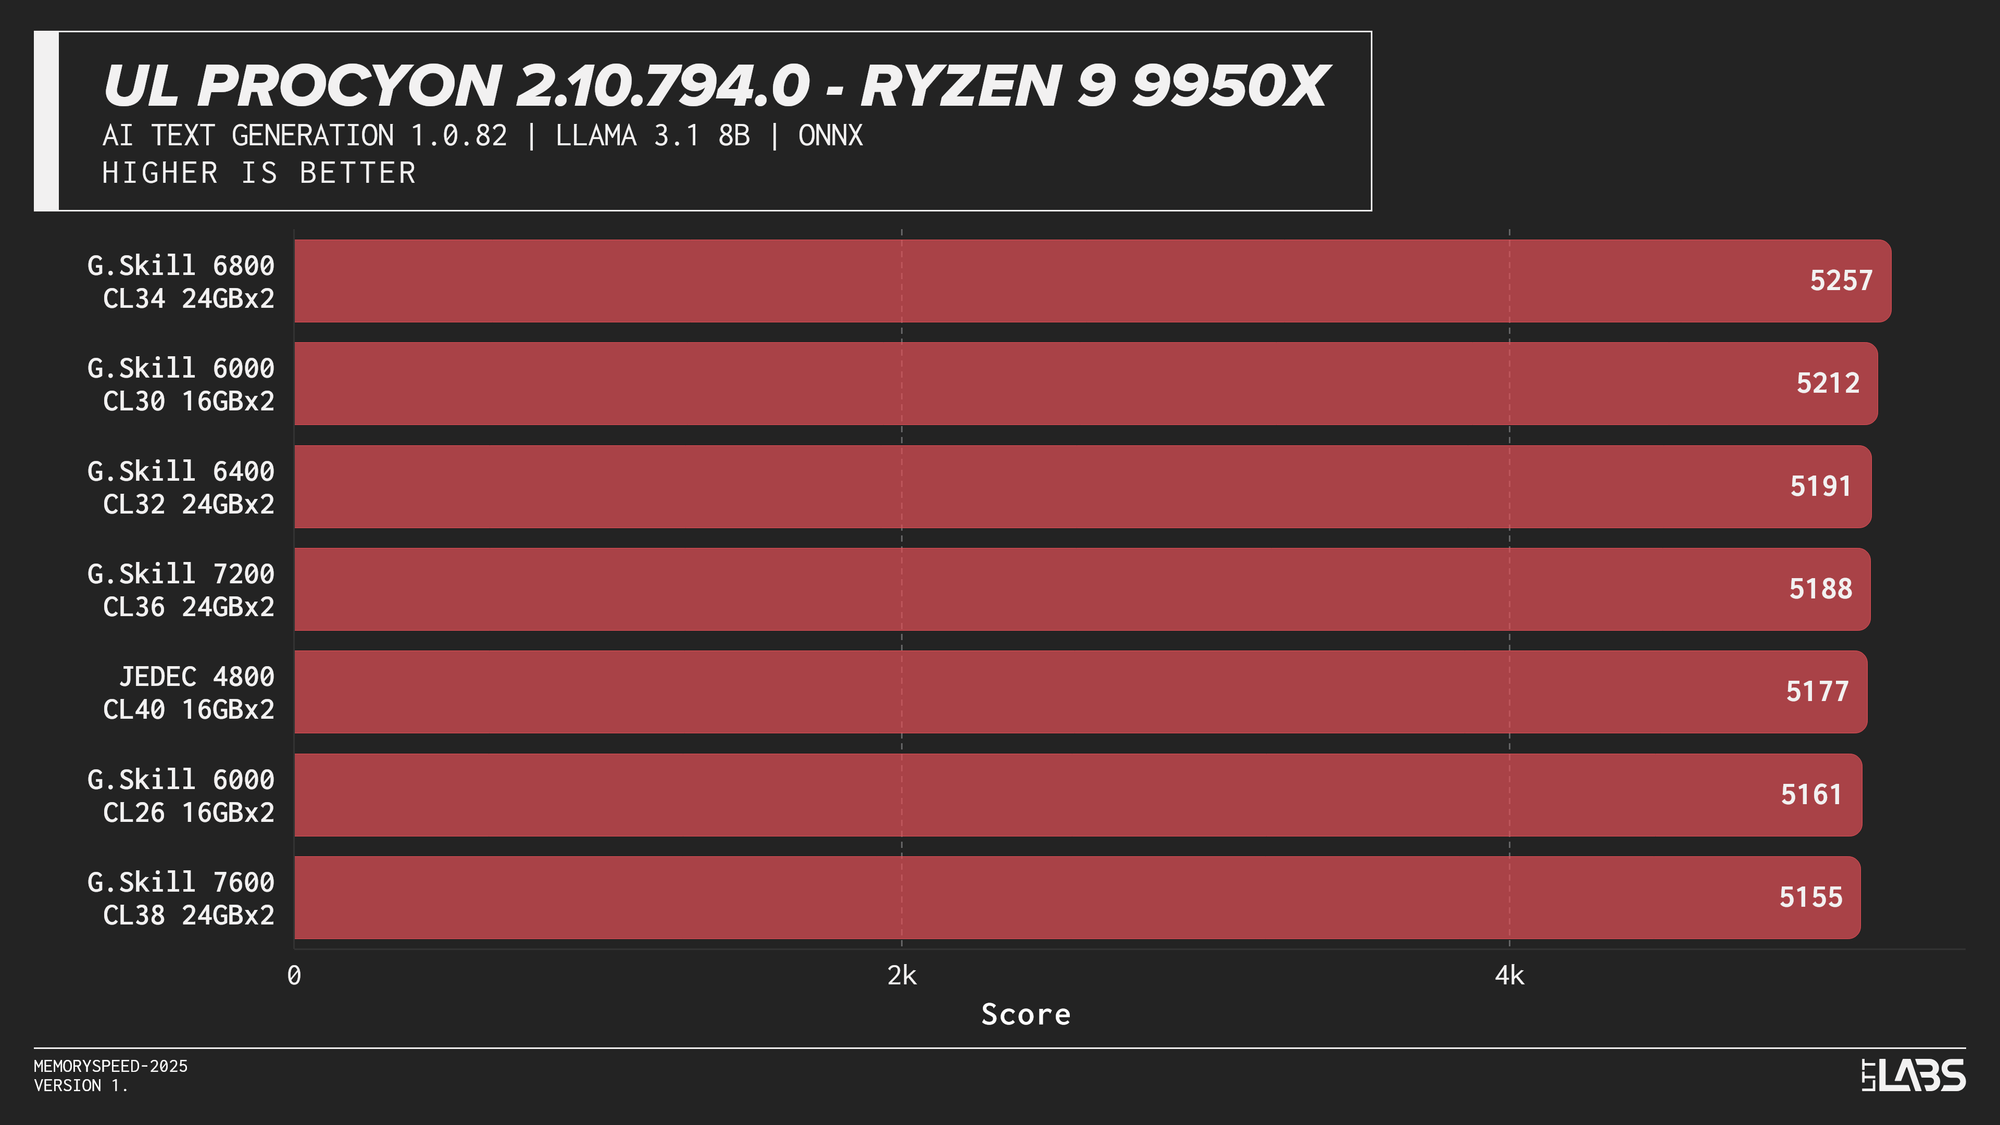
Llama 3.1 8B
Mistral 7B
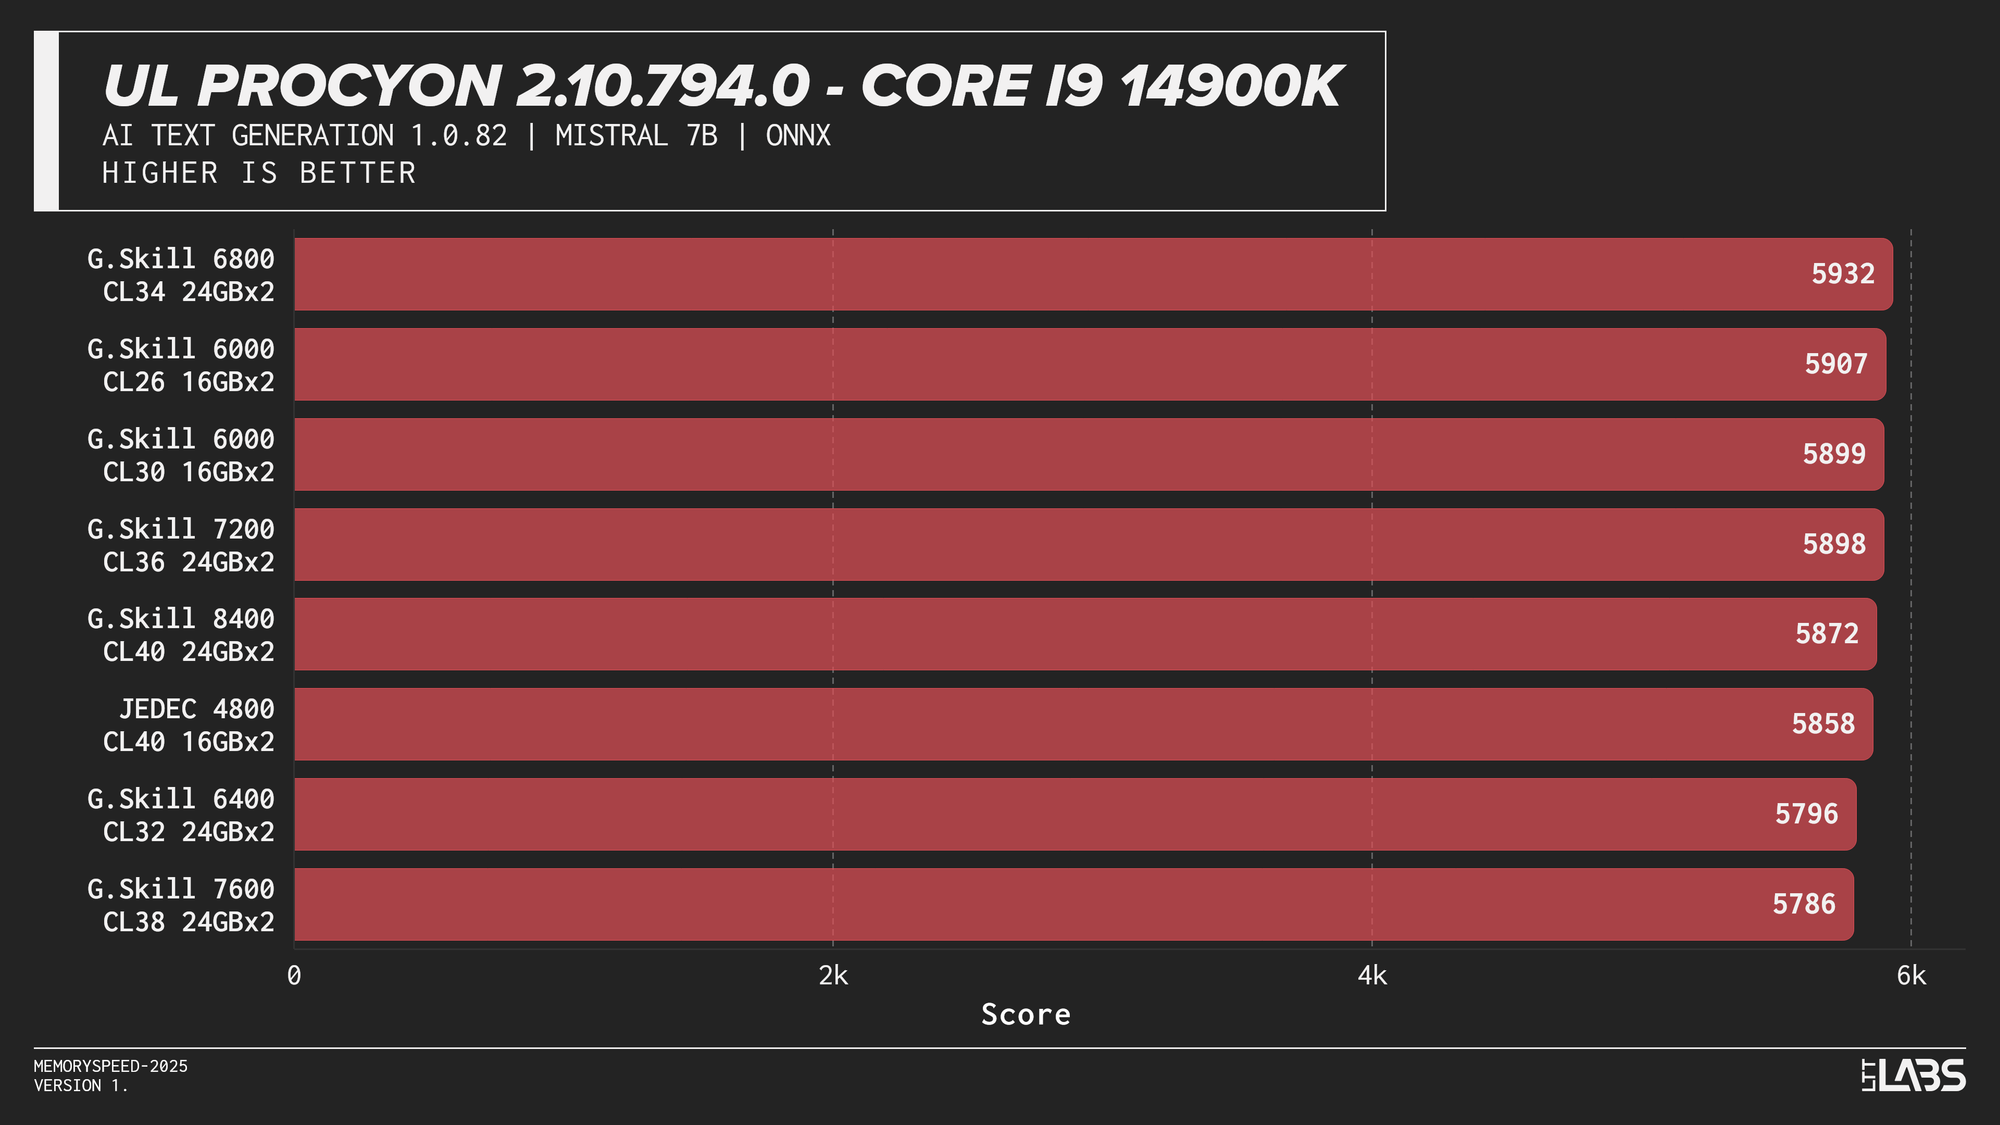
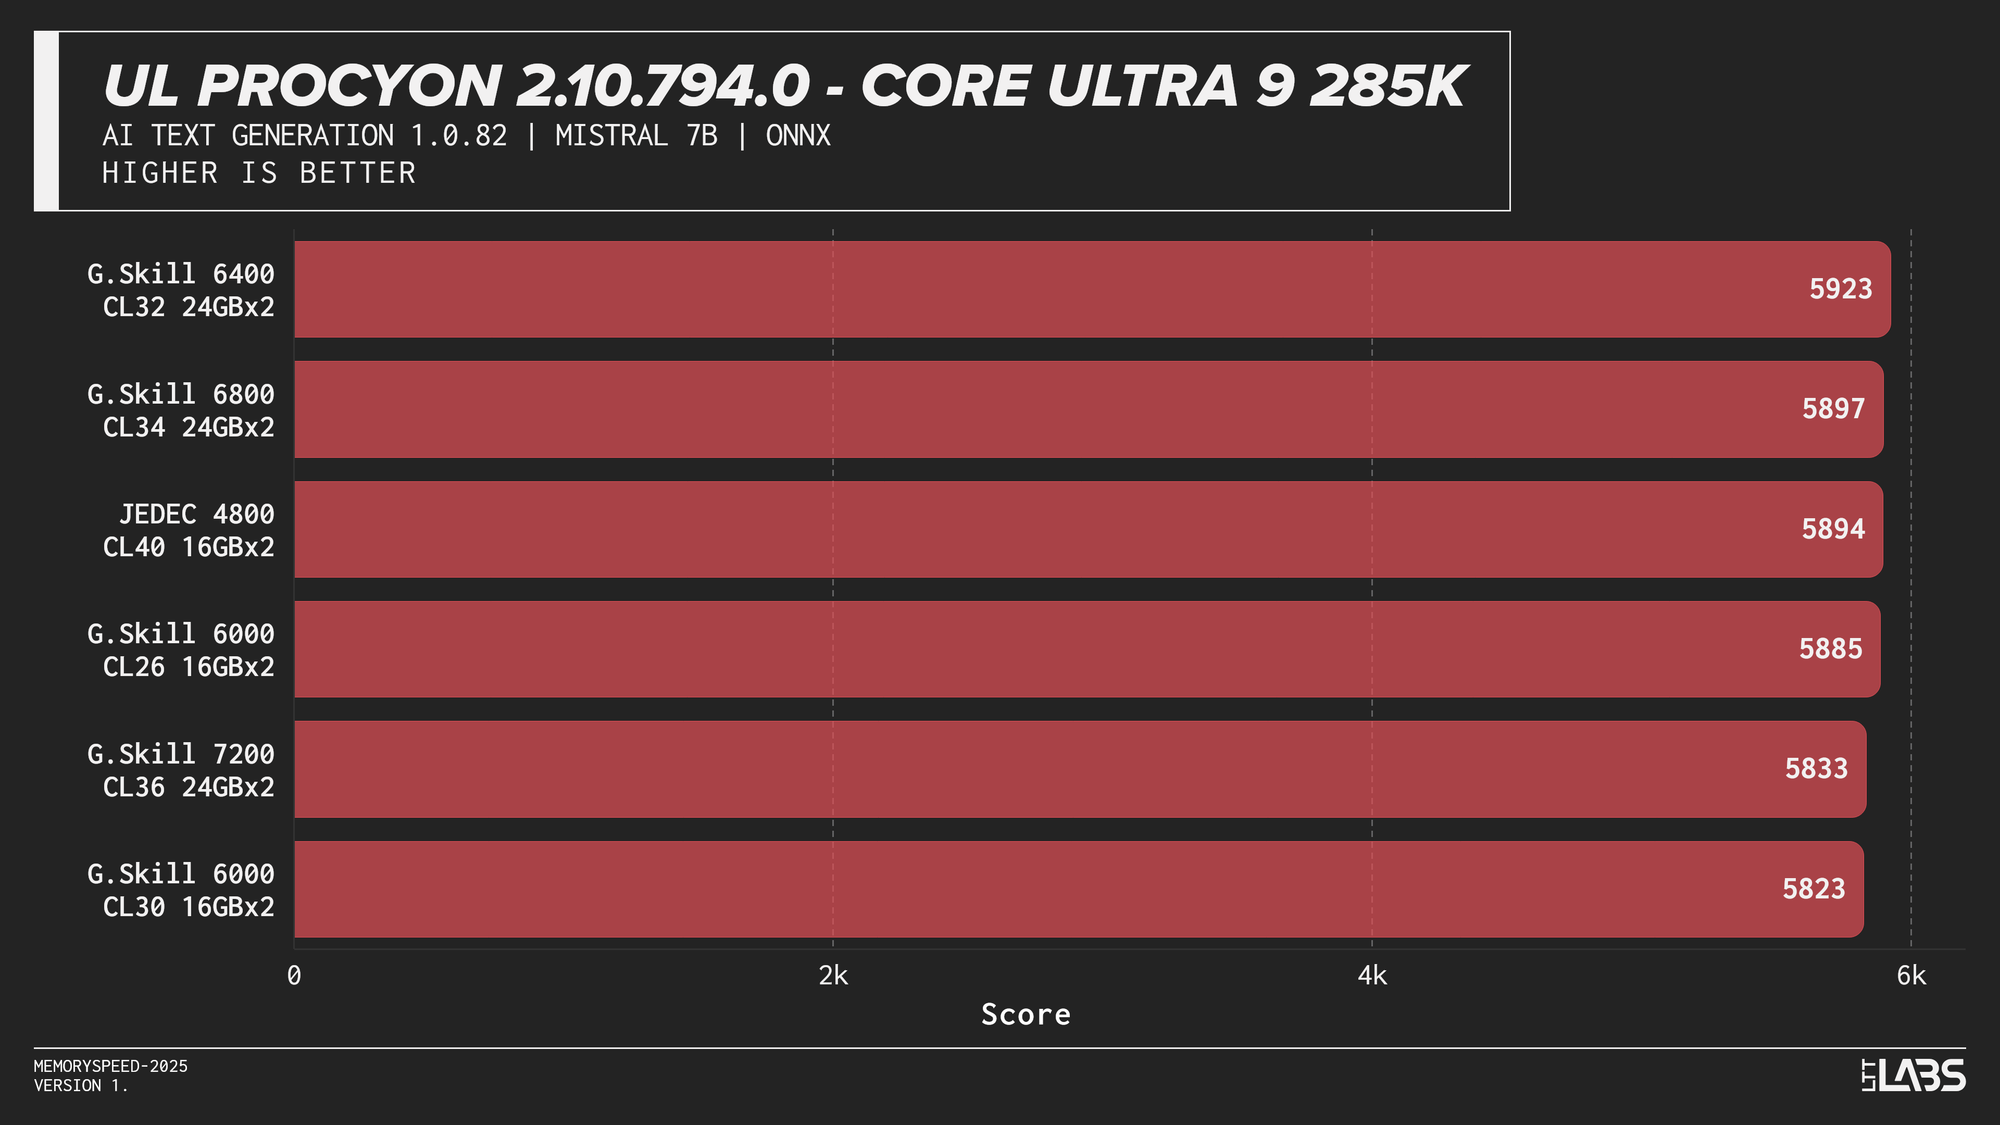
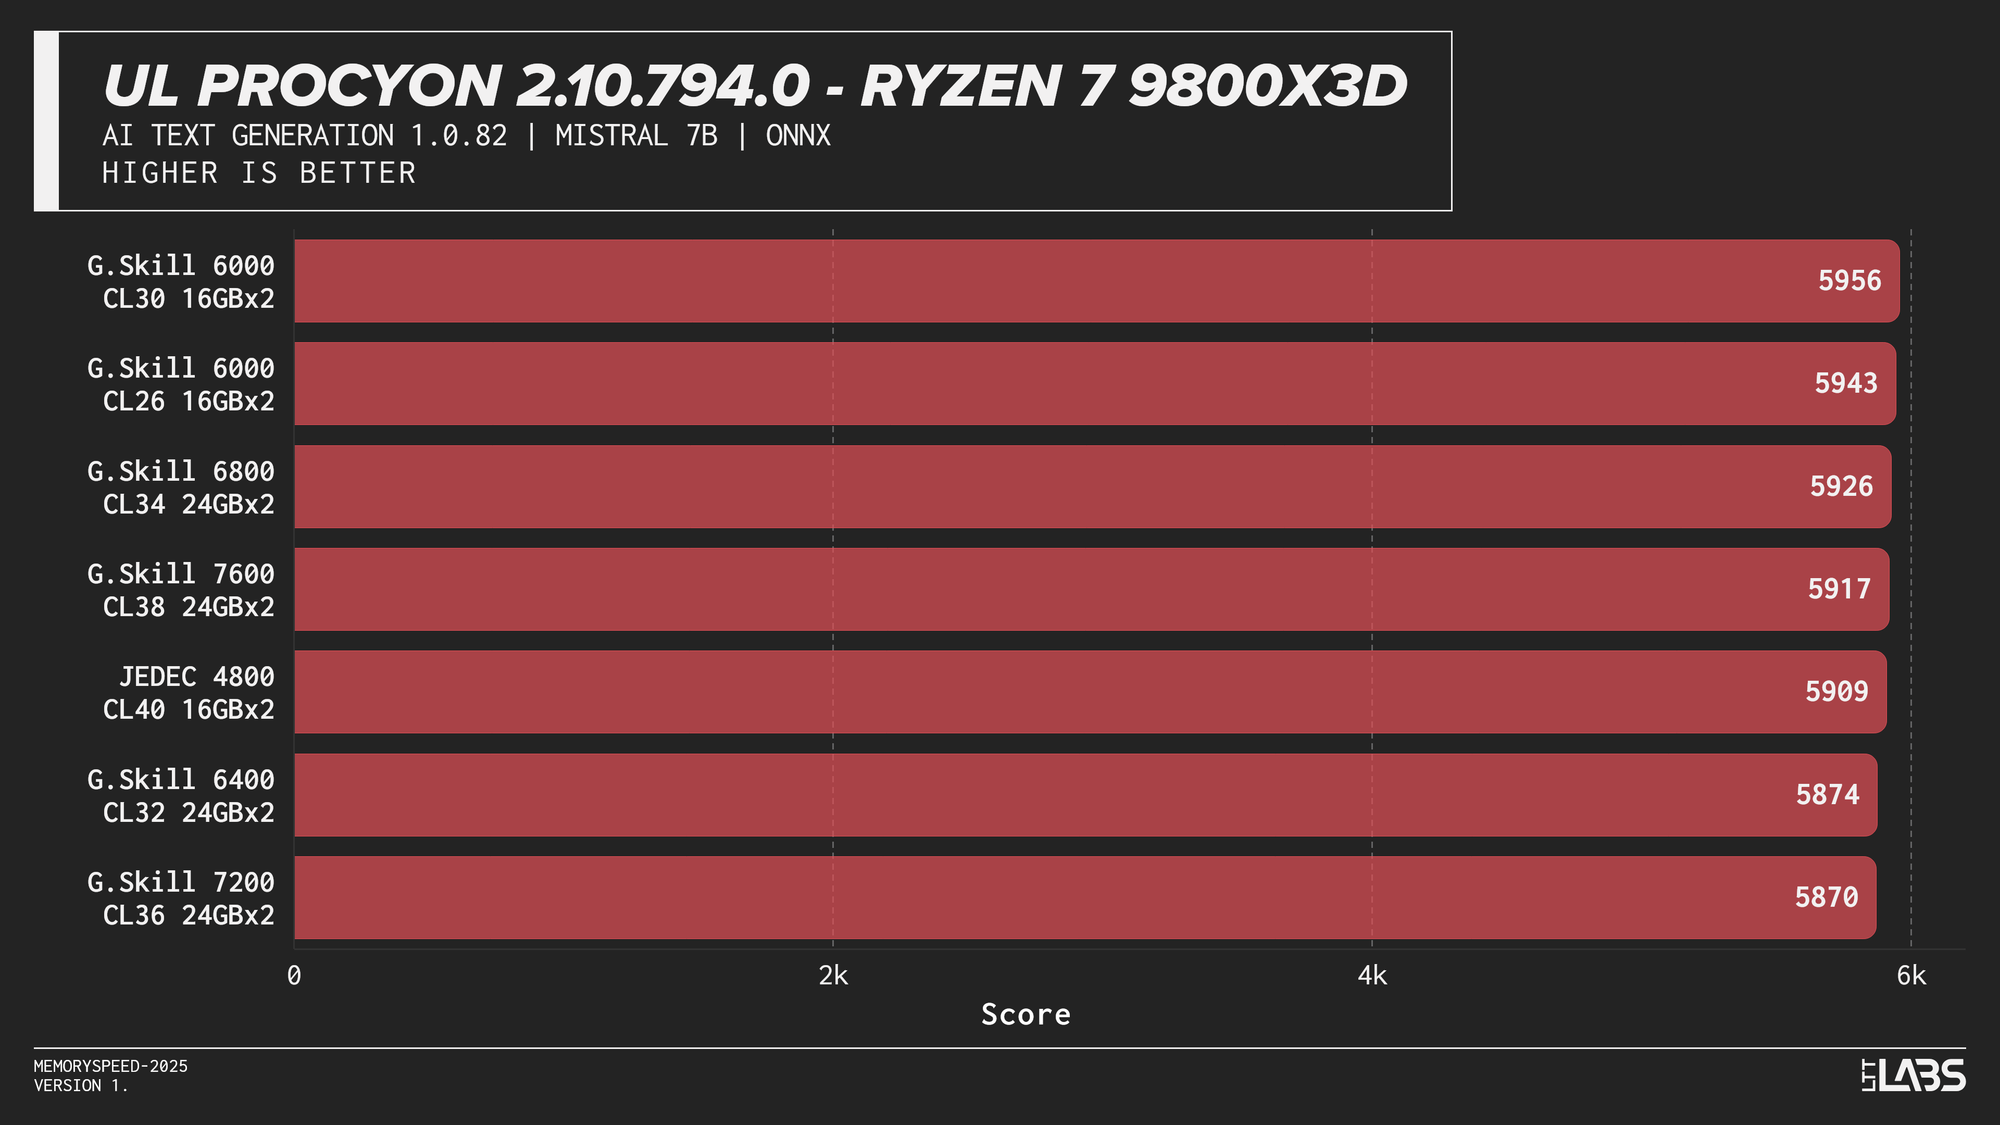
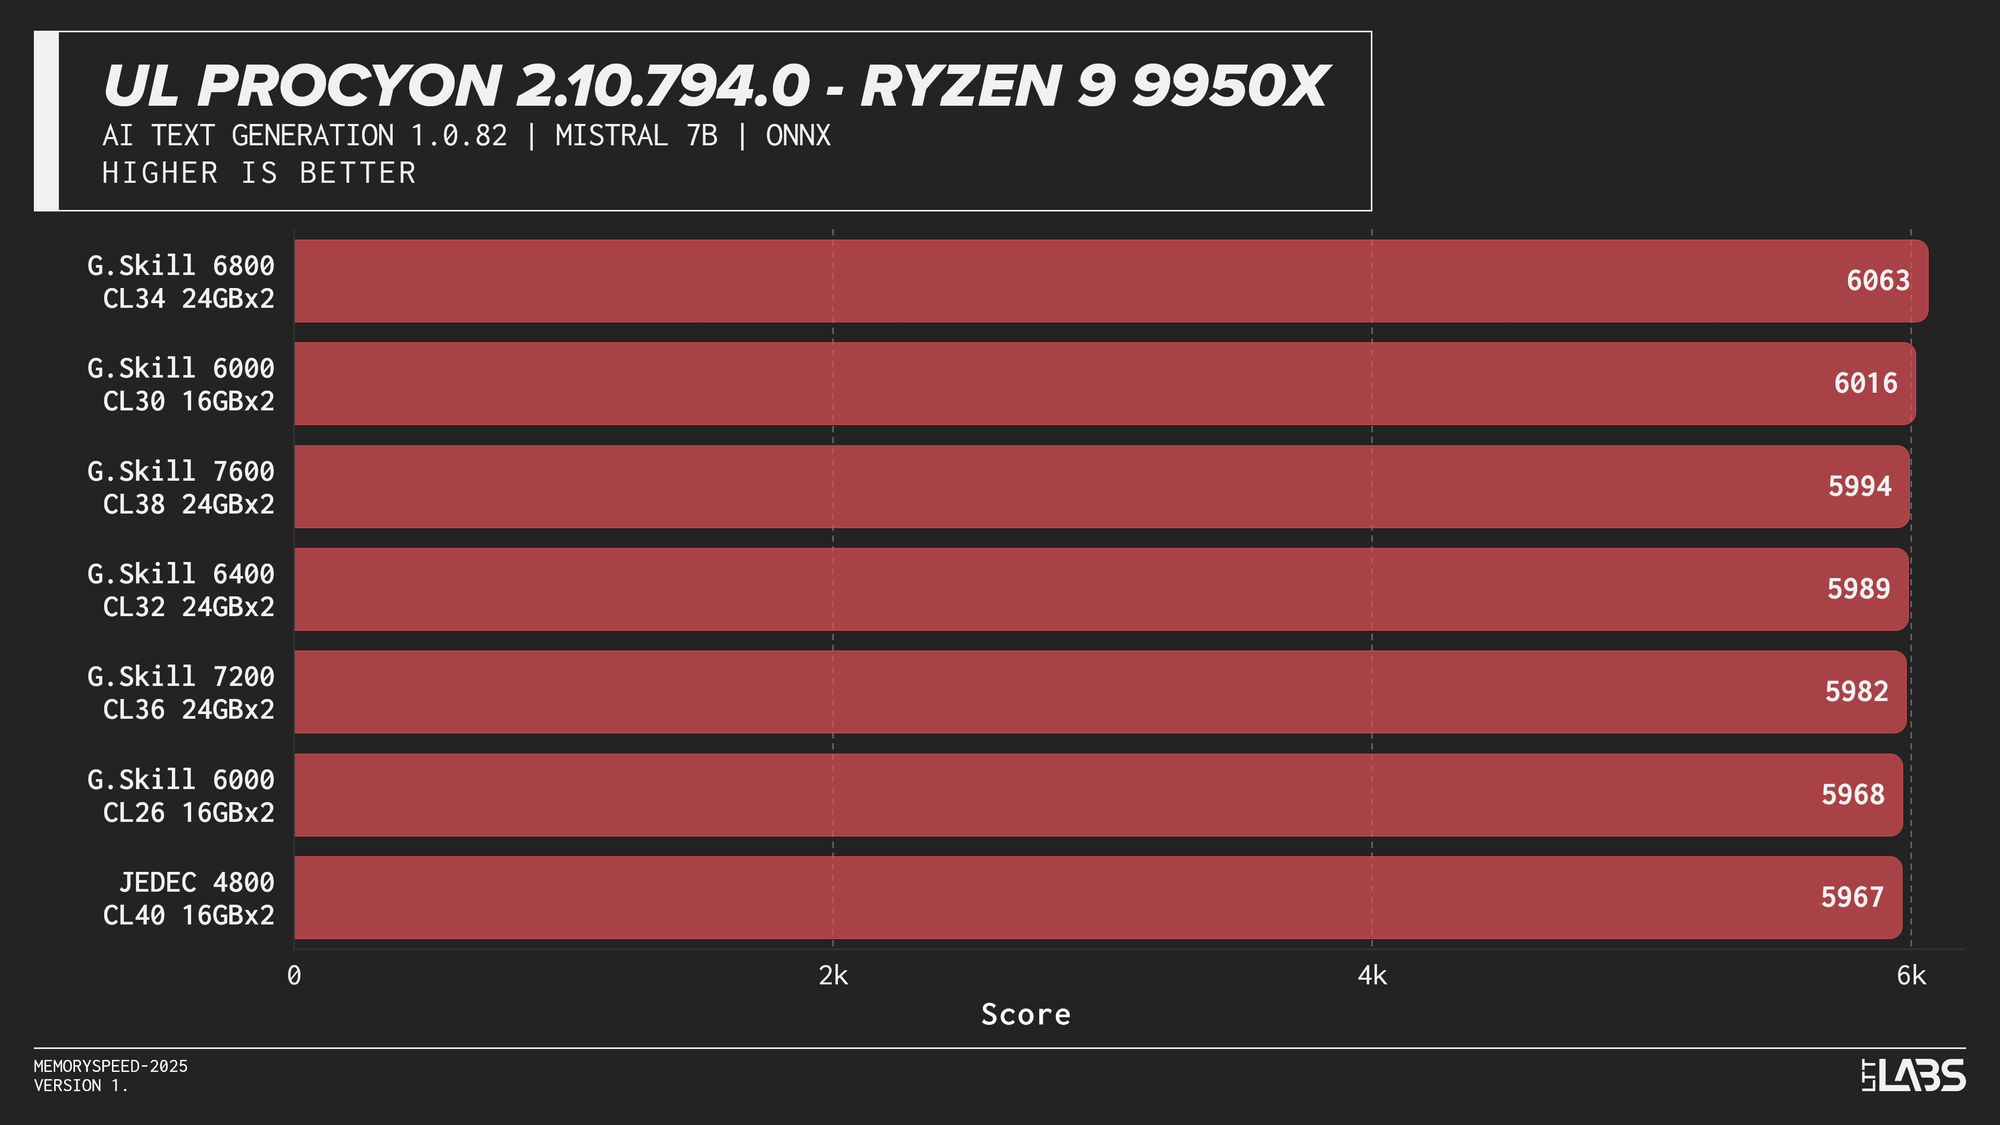
Mistral 7B
Phi 3.5 Mini
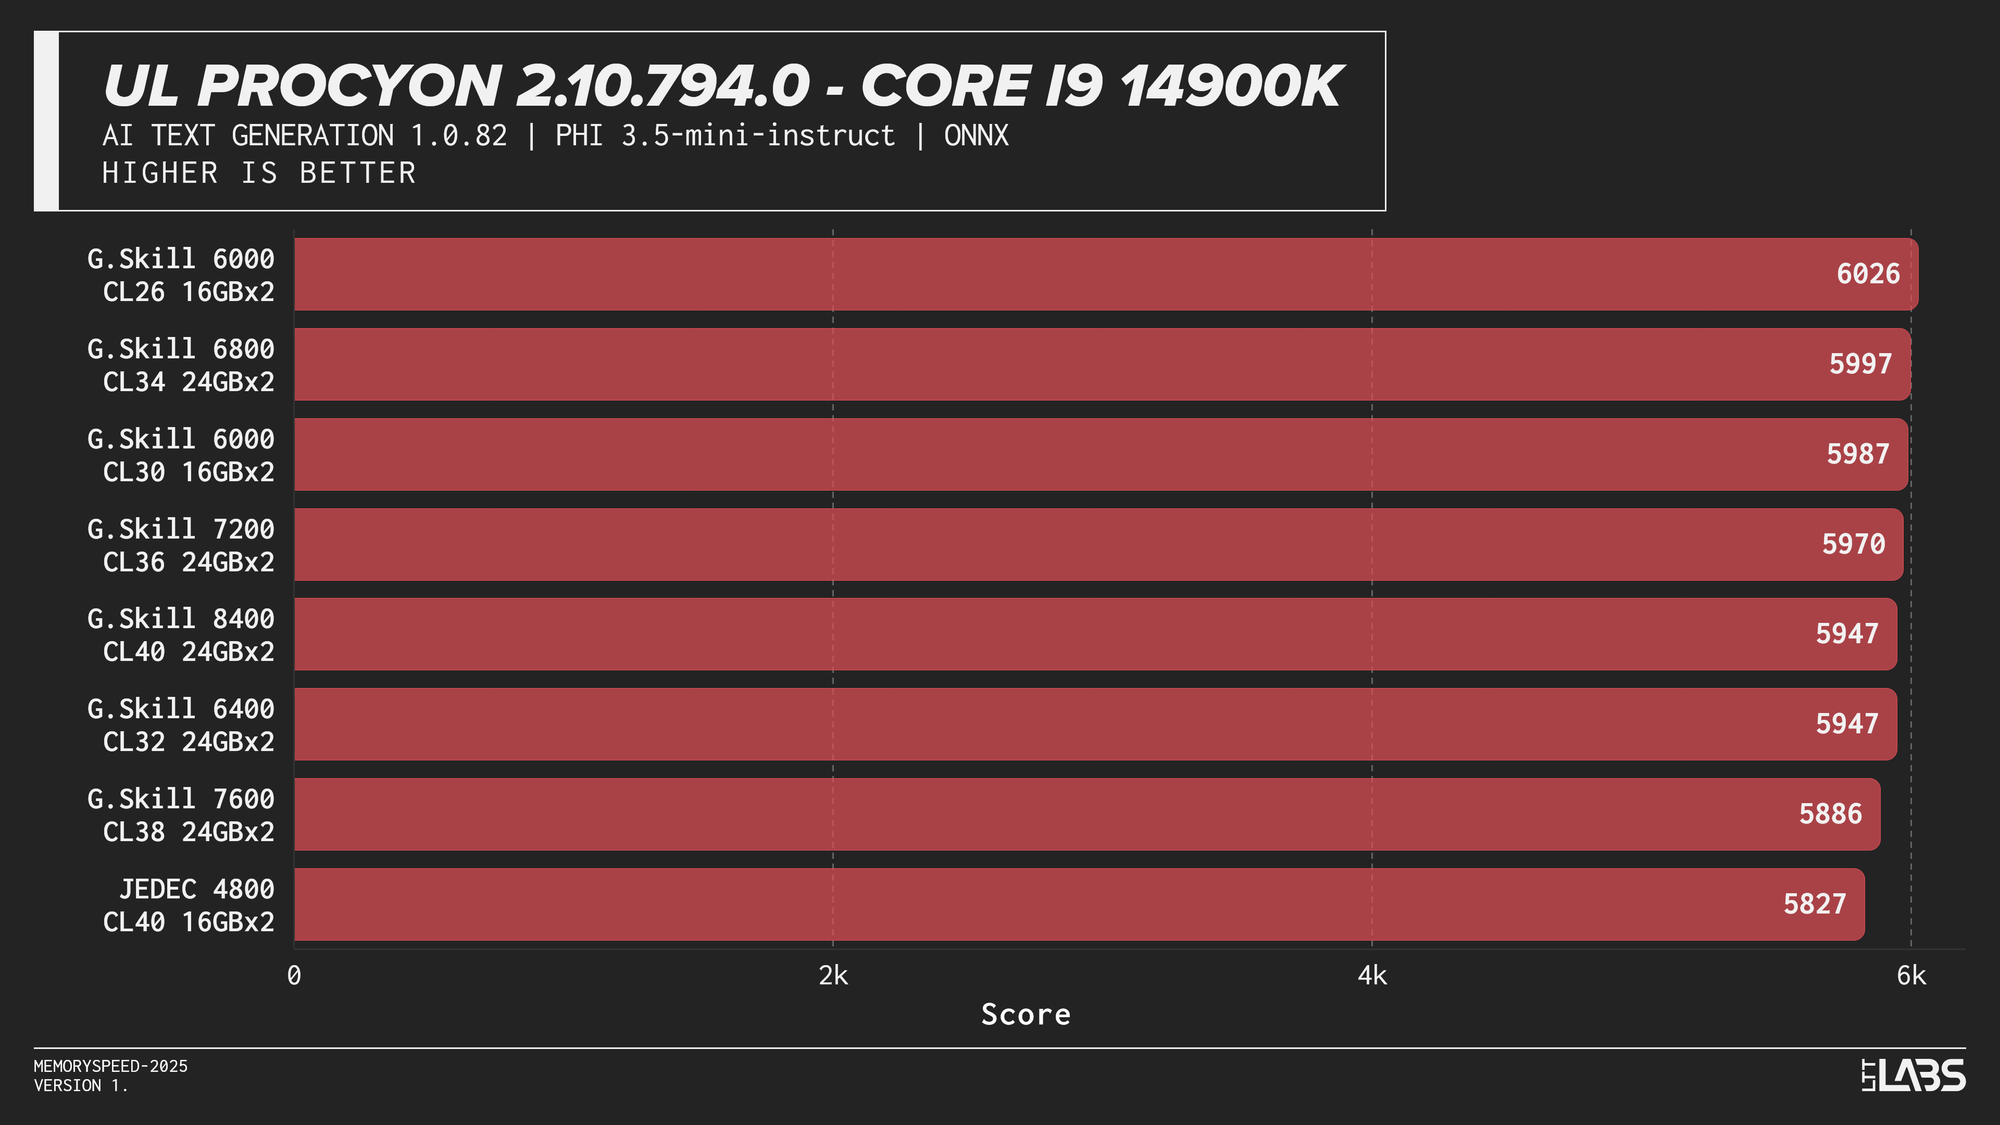
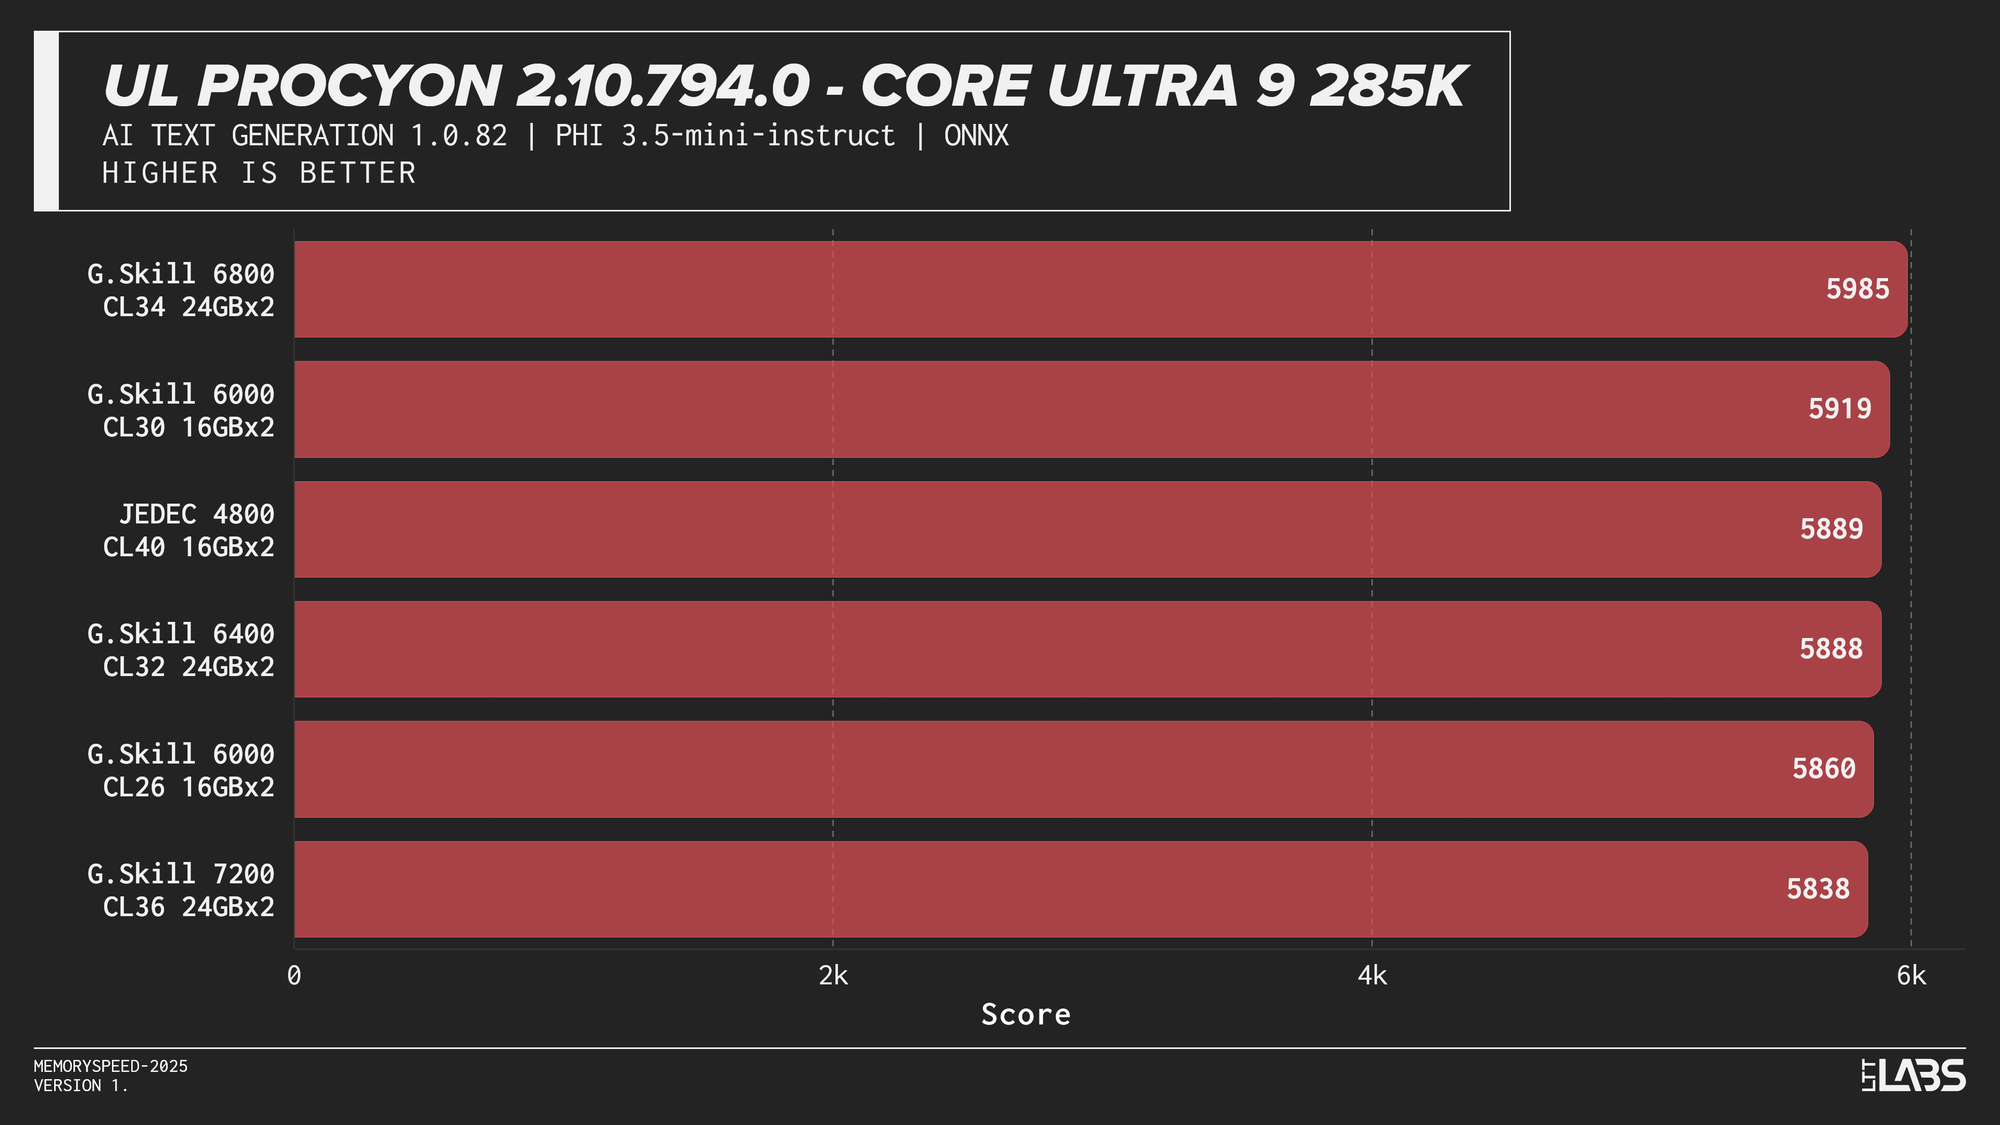
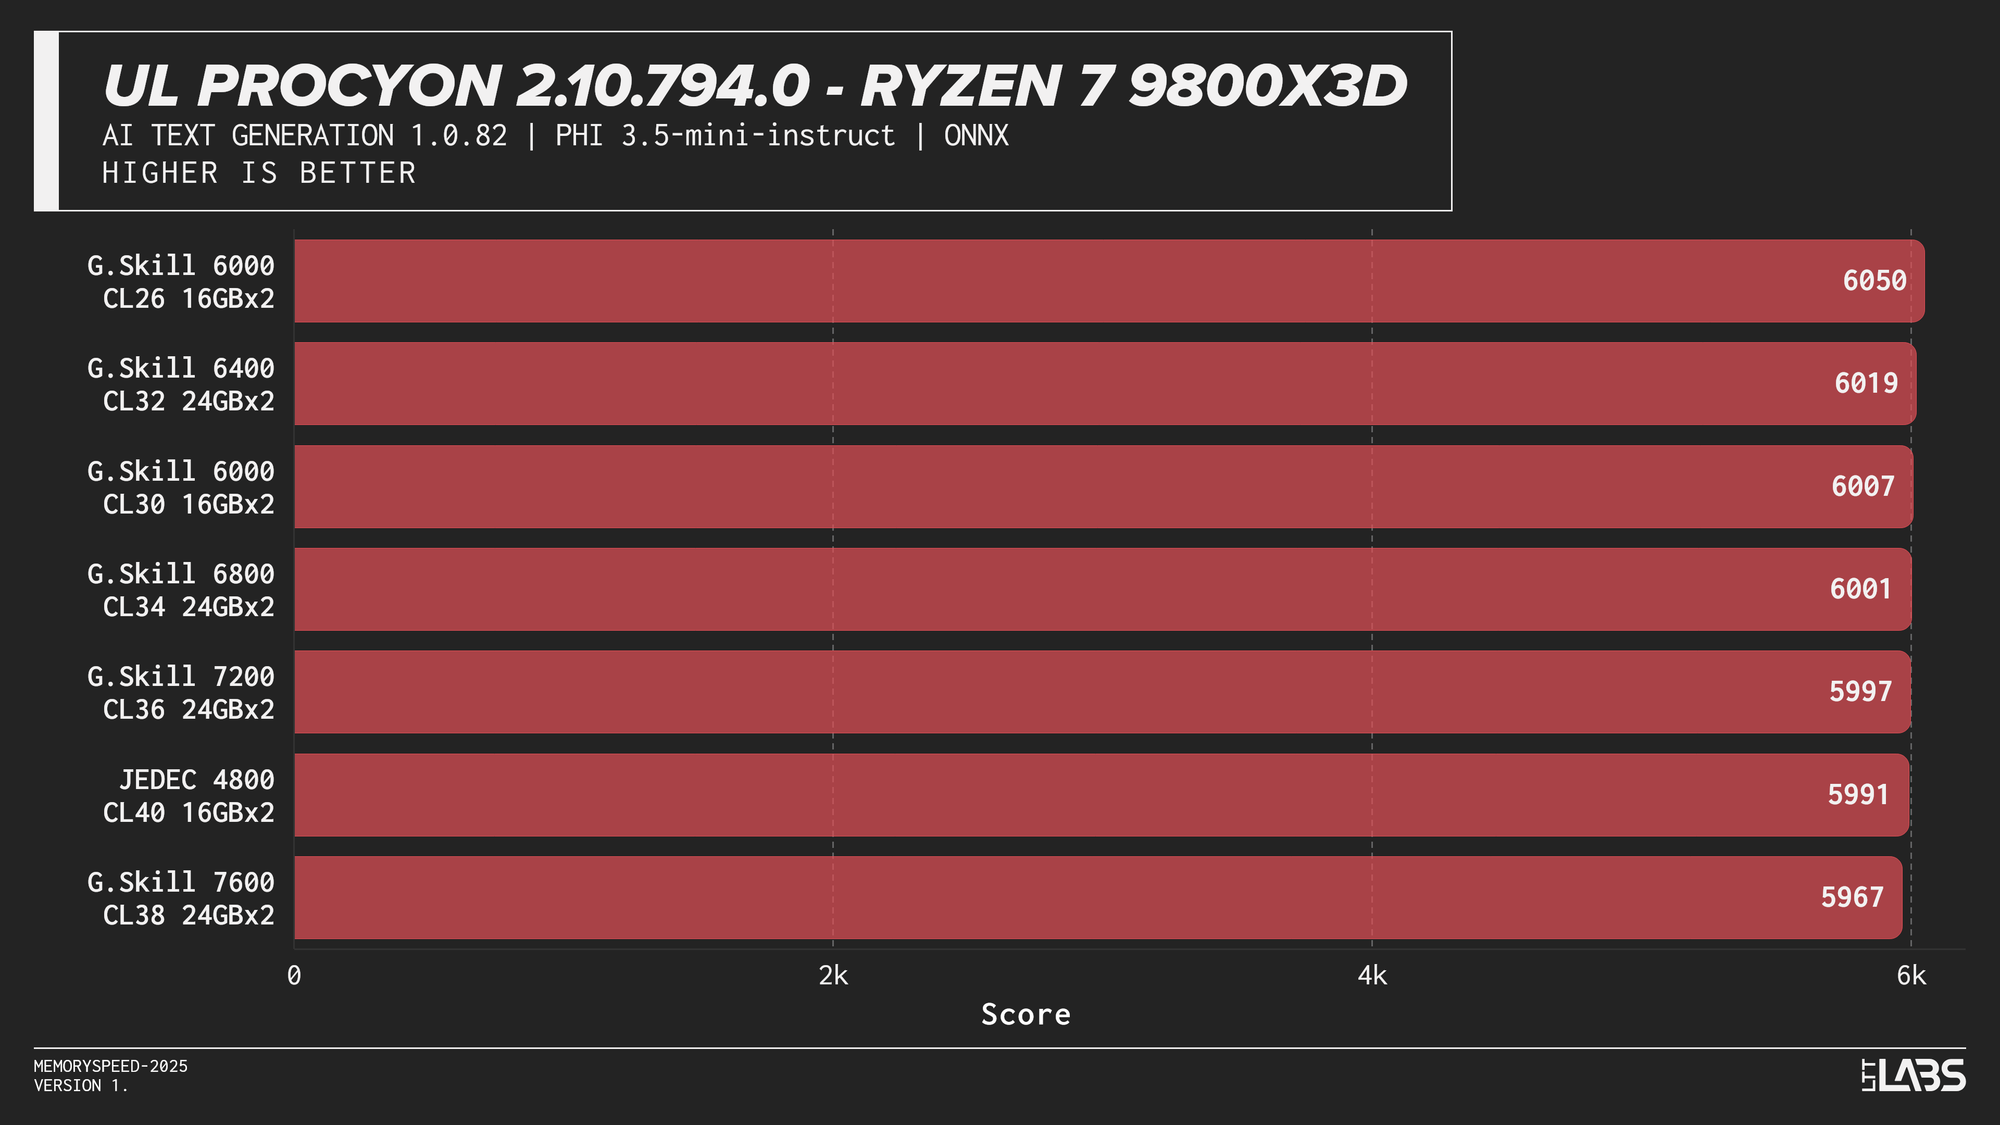
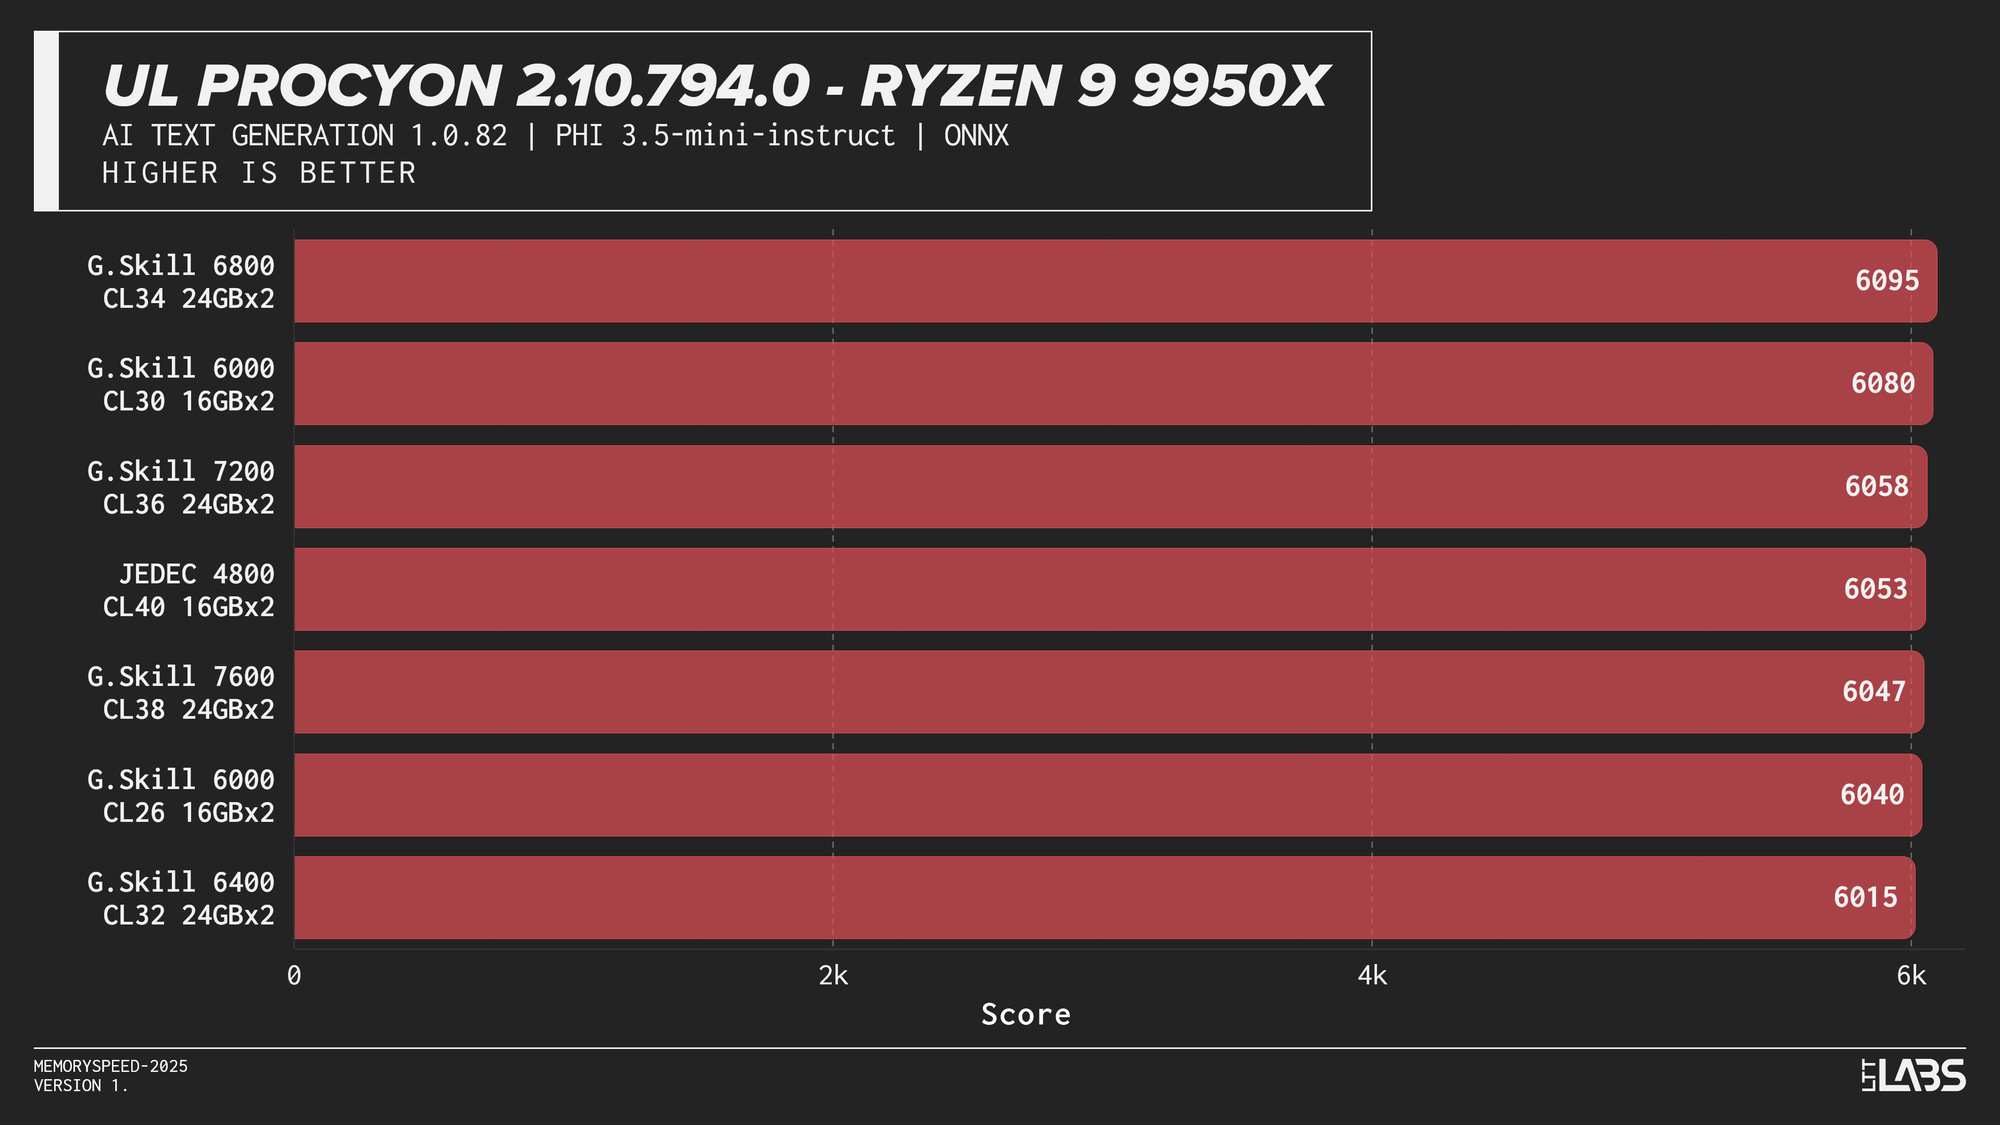
Phi 3.5 Mini
AI inference workloads showed effectively no sensitivity to system memory speed across platforms. In our testing, inference was performed on the GPU, where performance depends primarily on GPU compute throughput and VRAM bandwidth rather than system memory. As a result, DDR5 speed had very little to no measurable impact across platforms.
System memory can become more relevant when inference is performed on the CPU, where model execution depends on CPU throughput and memory access. For most local AI setups, however, capacity remains far more important than memory frequency.
Synthetics
Synthetic tests are controlled workloads designed to isolate specific system characteristics such as compute throughput, memory bandwidth, or latency.
7-Zip 25.00 (Compression and Decompression)
Compression
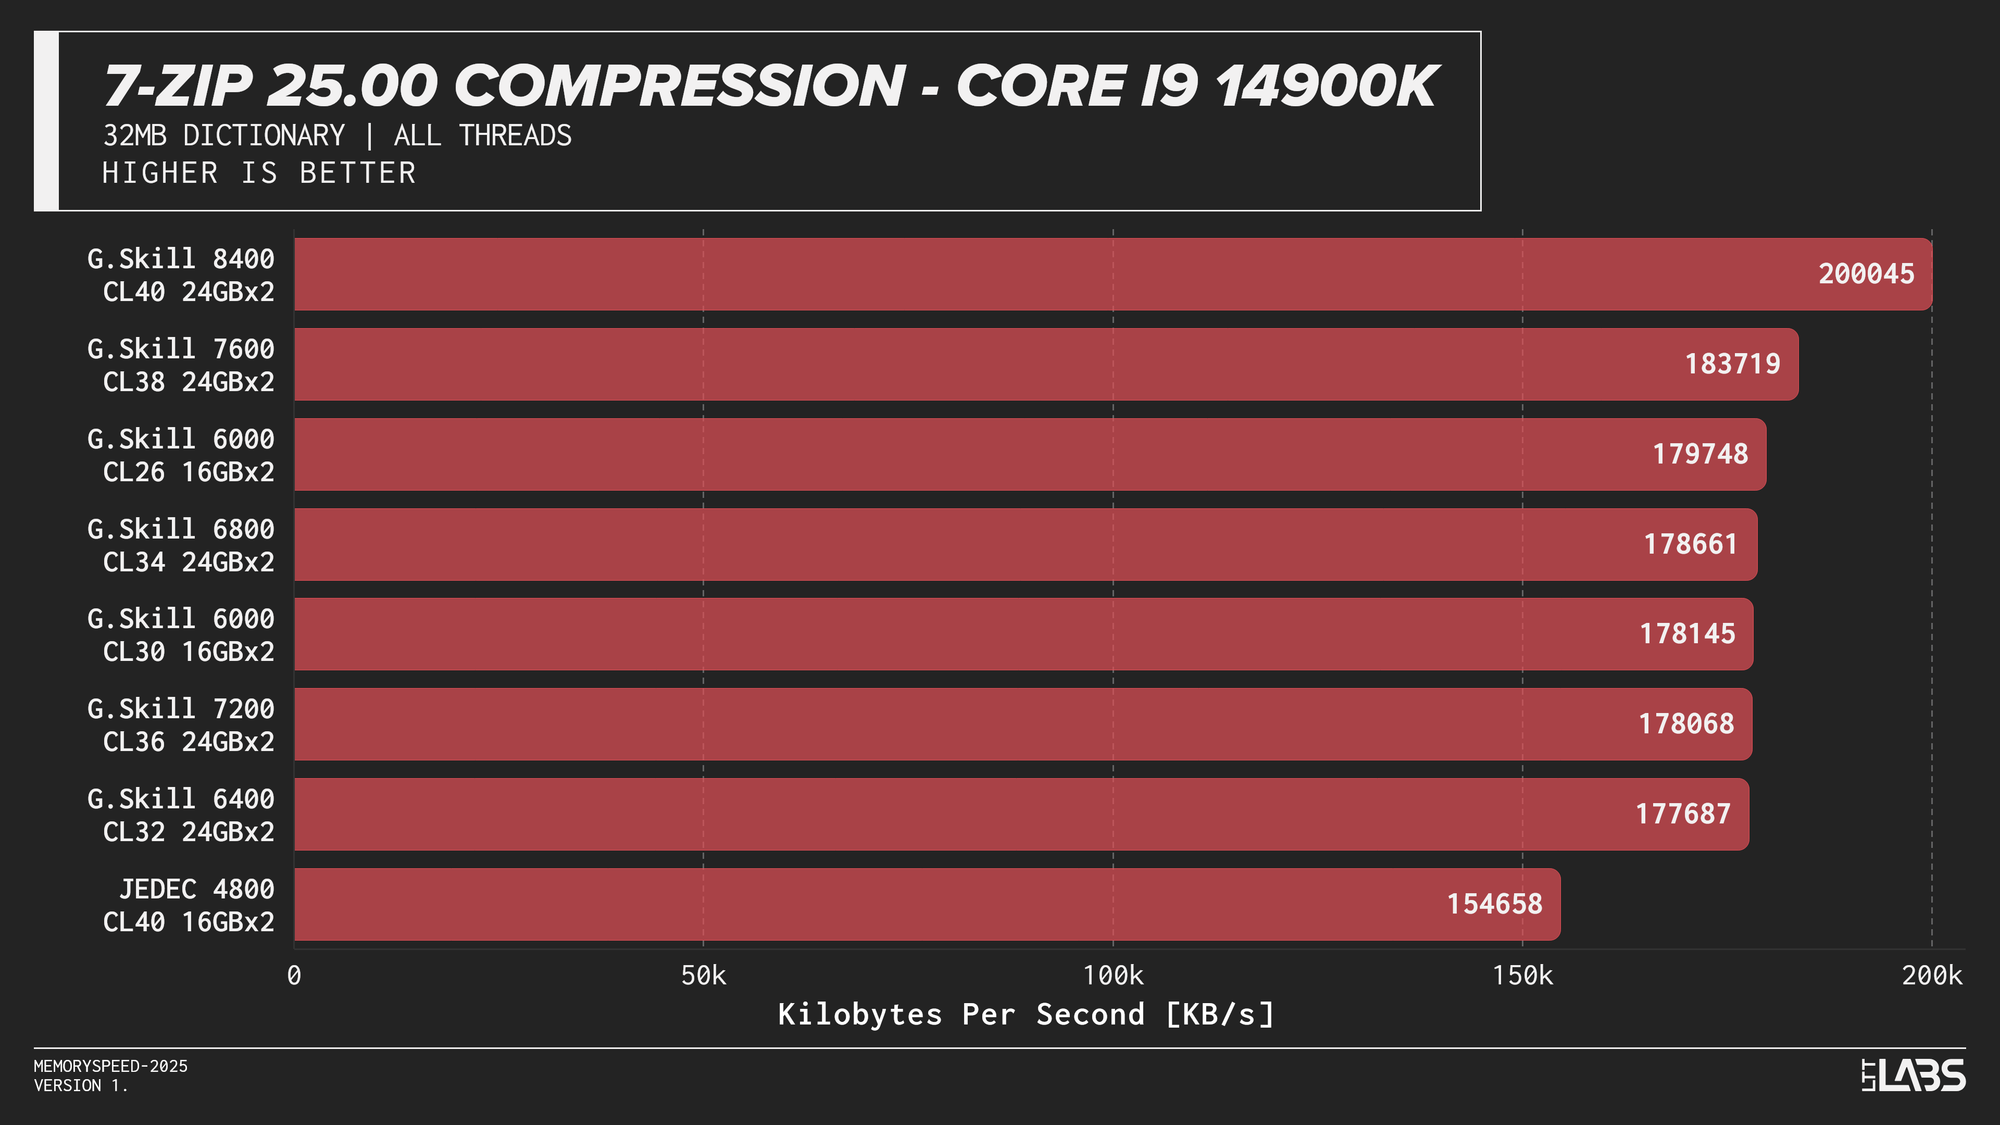
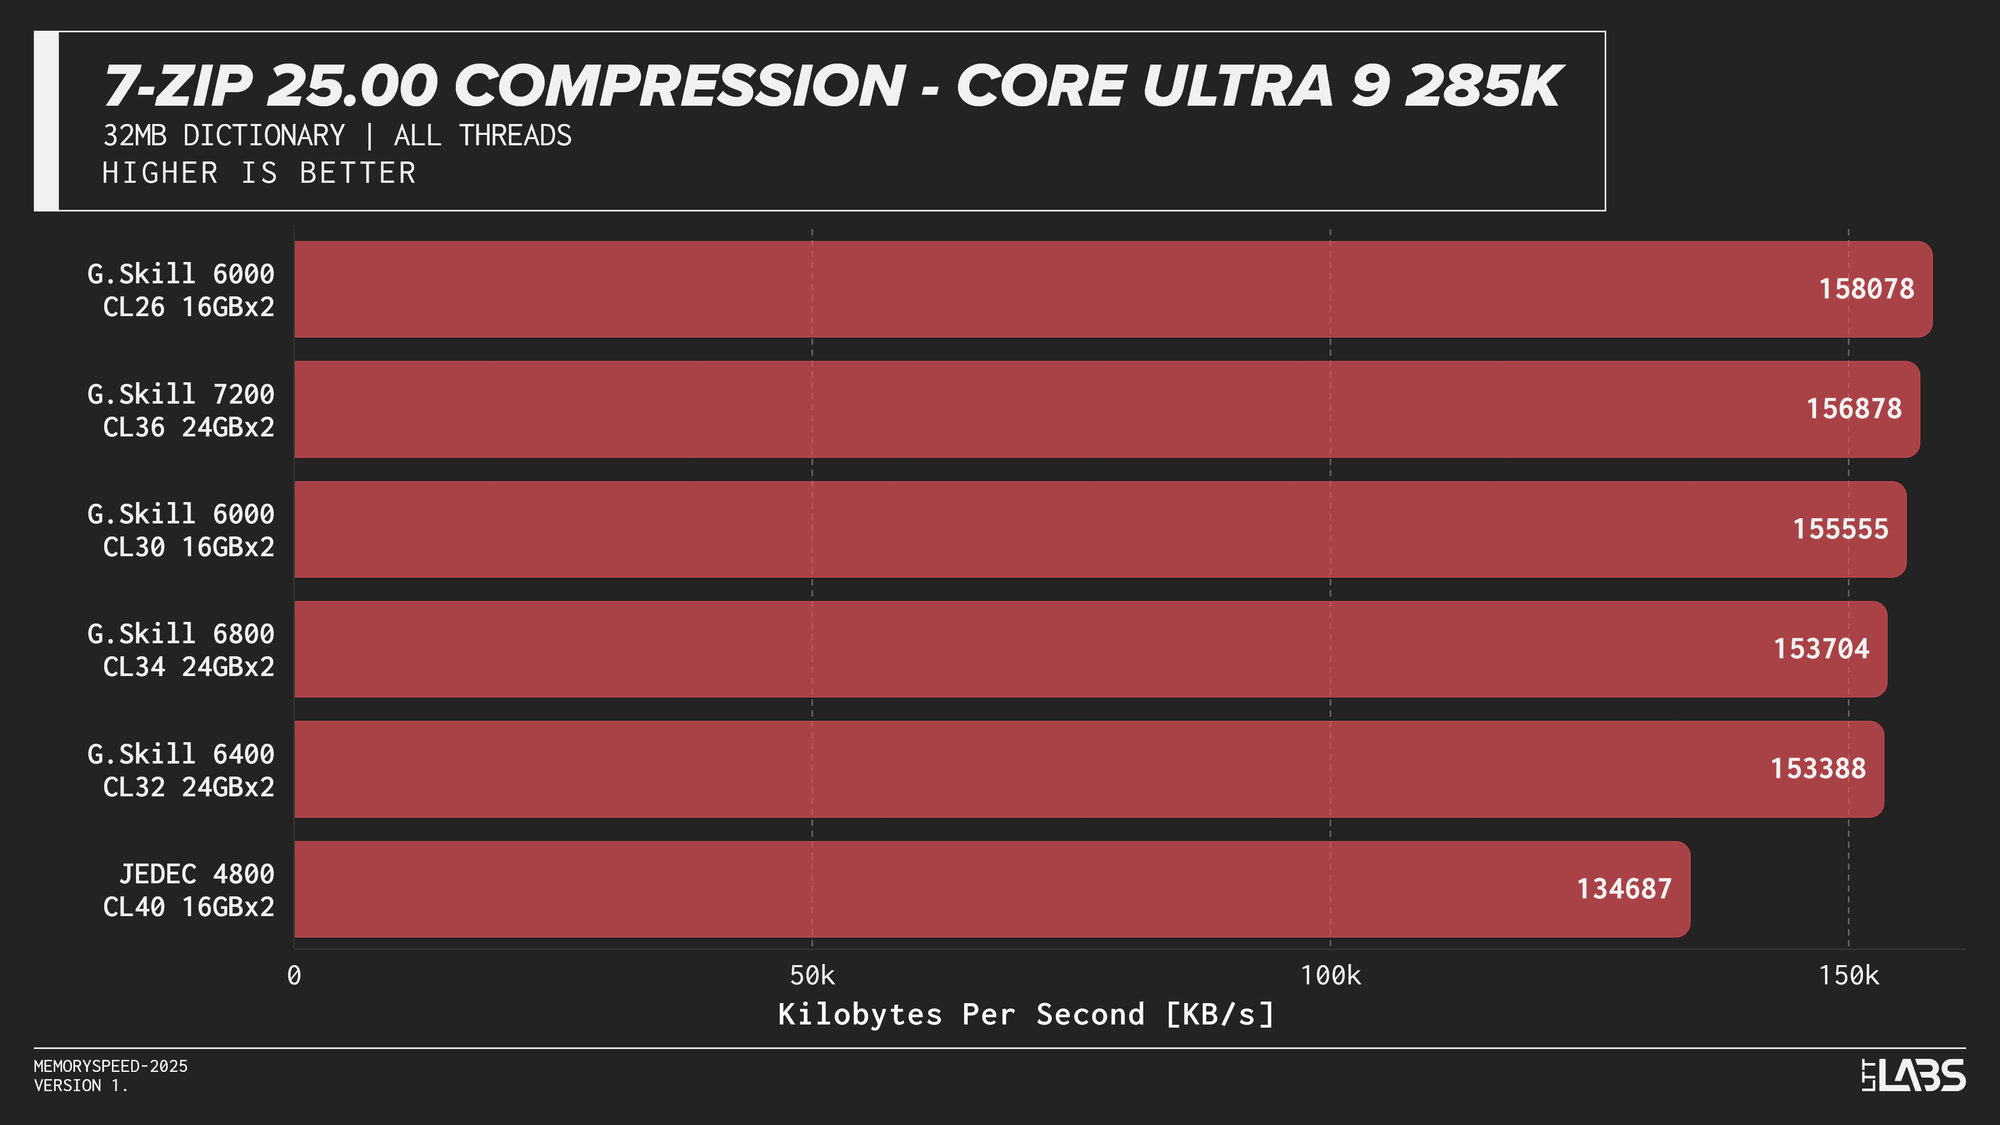
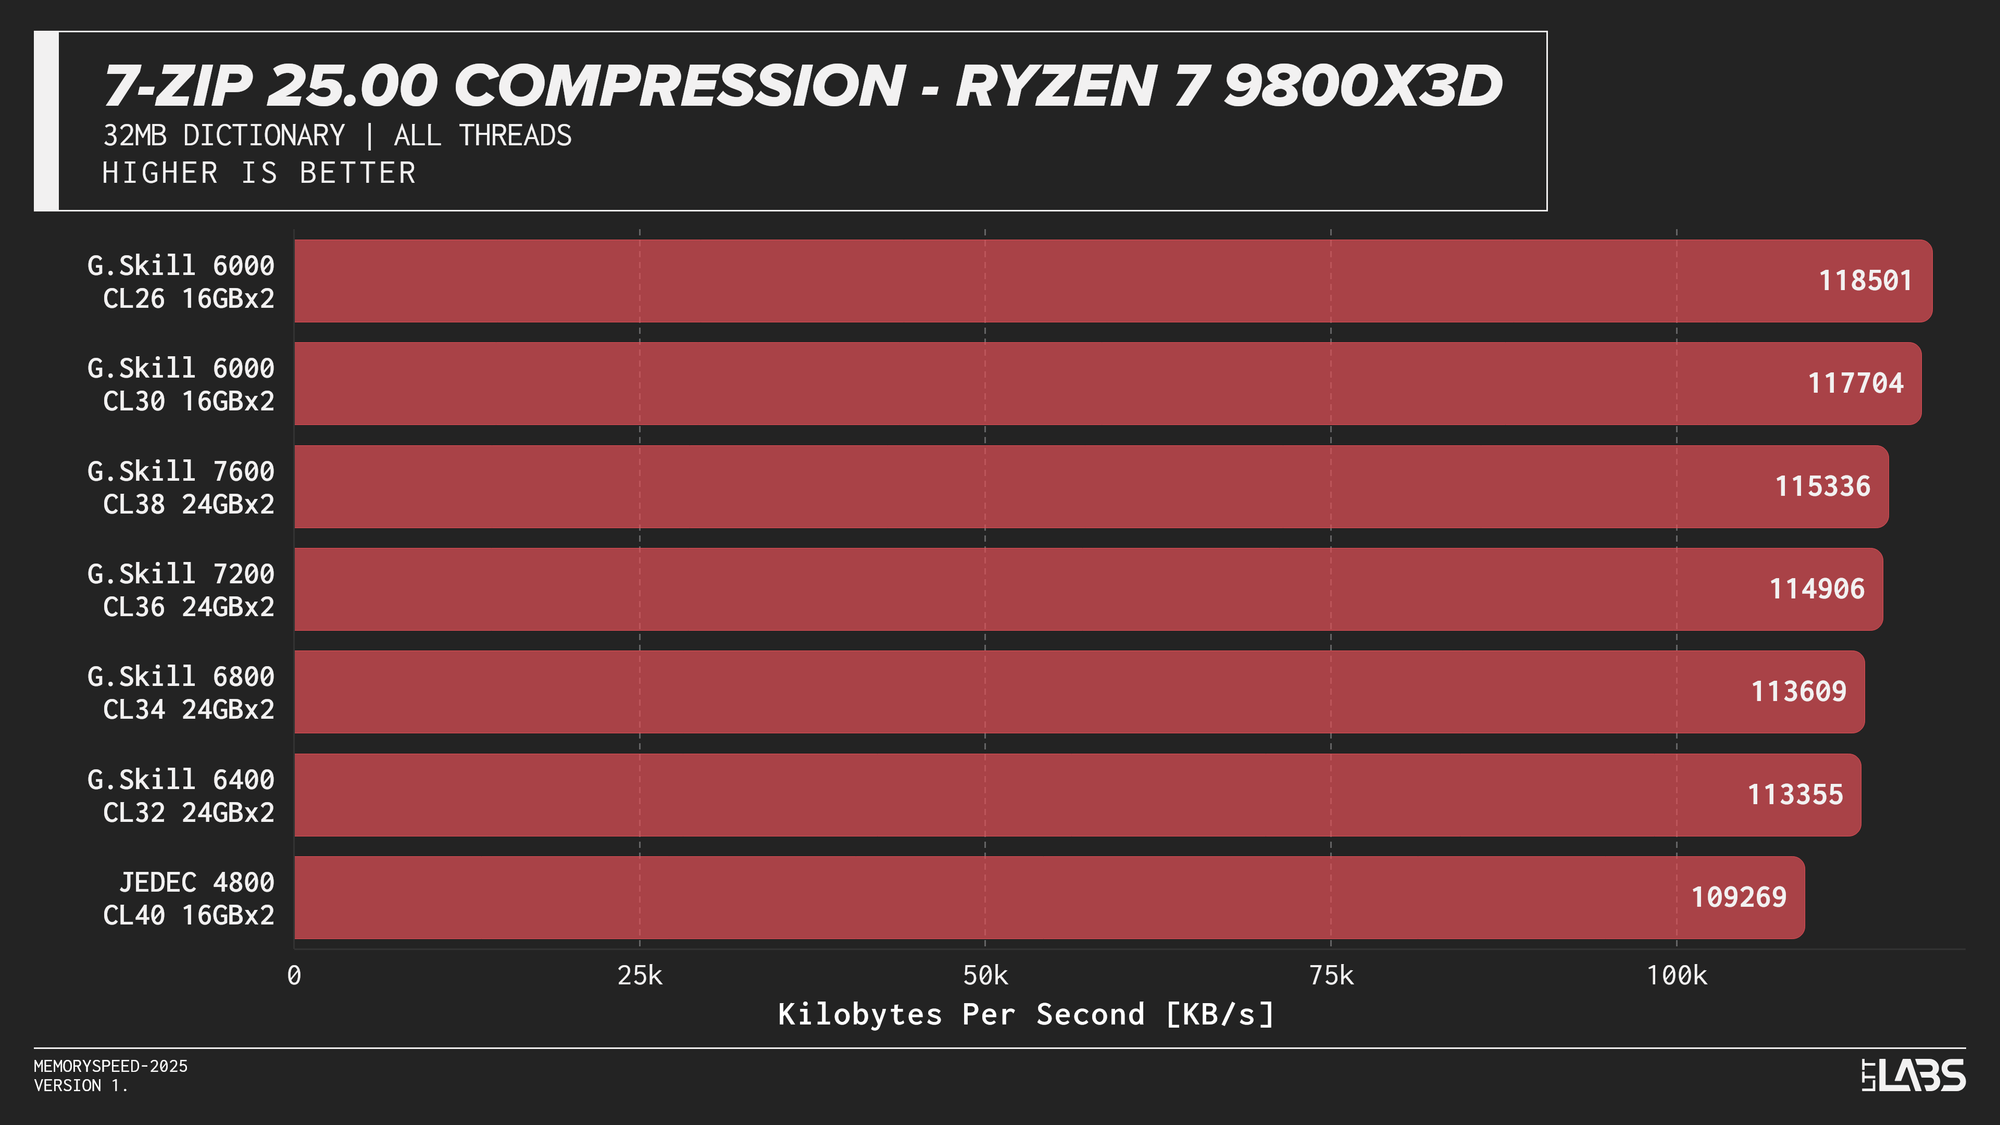
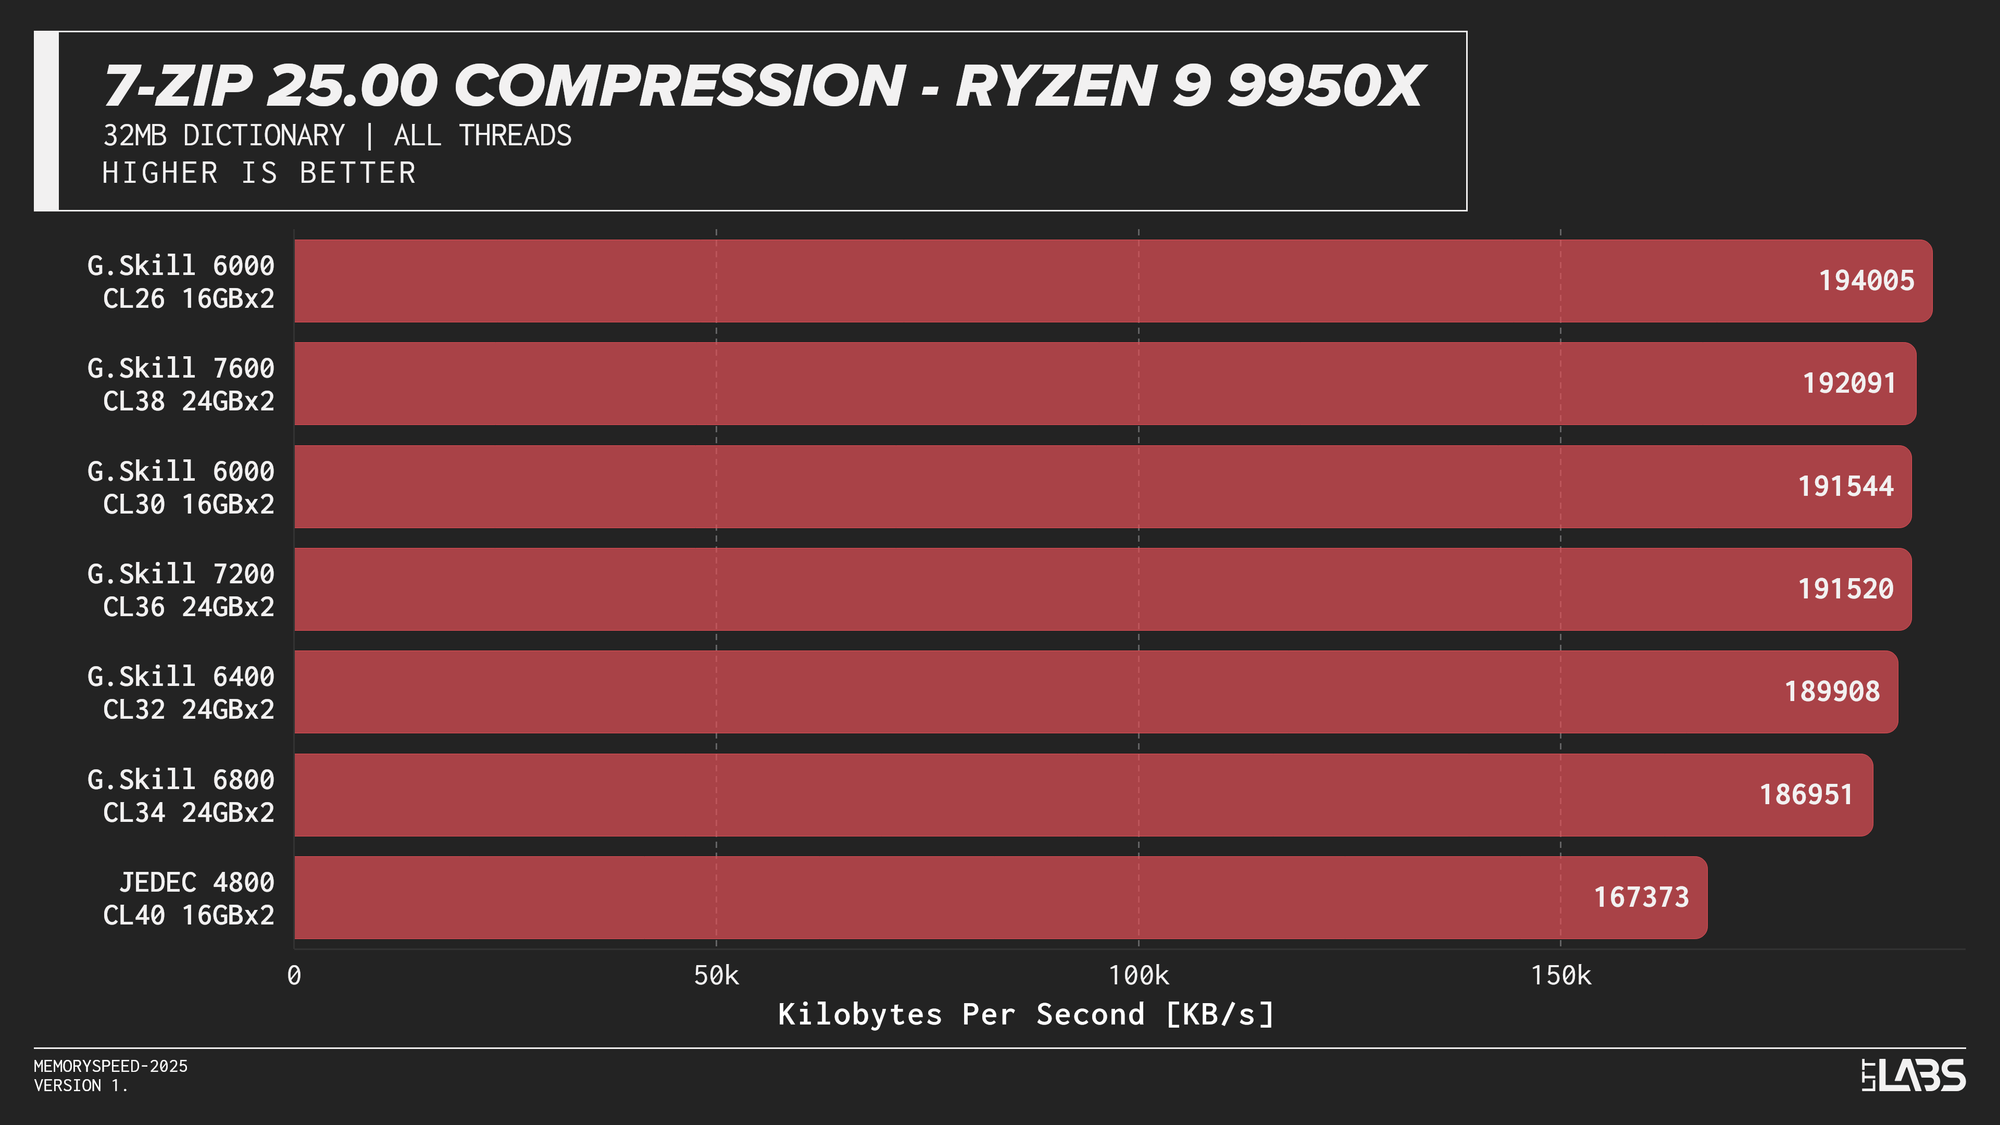
7-Zip 25.00 Compression
At the risk of sounding like a broken record, 7-Zip compression across platforms JEDEC configuration was again the slowest. Moving to tuned memory produced a noticeable jump, with the largest gains occurring between JEDEC and the 6000 MT/s. The 8400 MT/s kit followed by the 7600MT/s kit had a noticeable lead over the other tuned memory kits on the 14900K with most other kits performing within range of each other.
Decompression
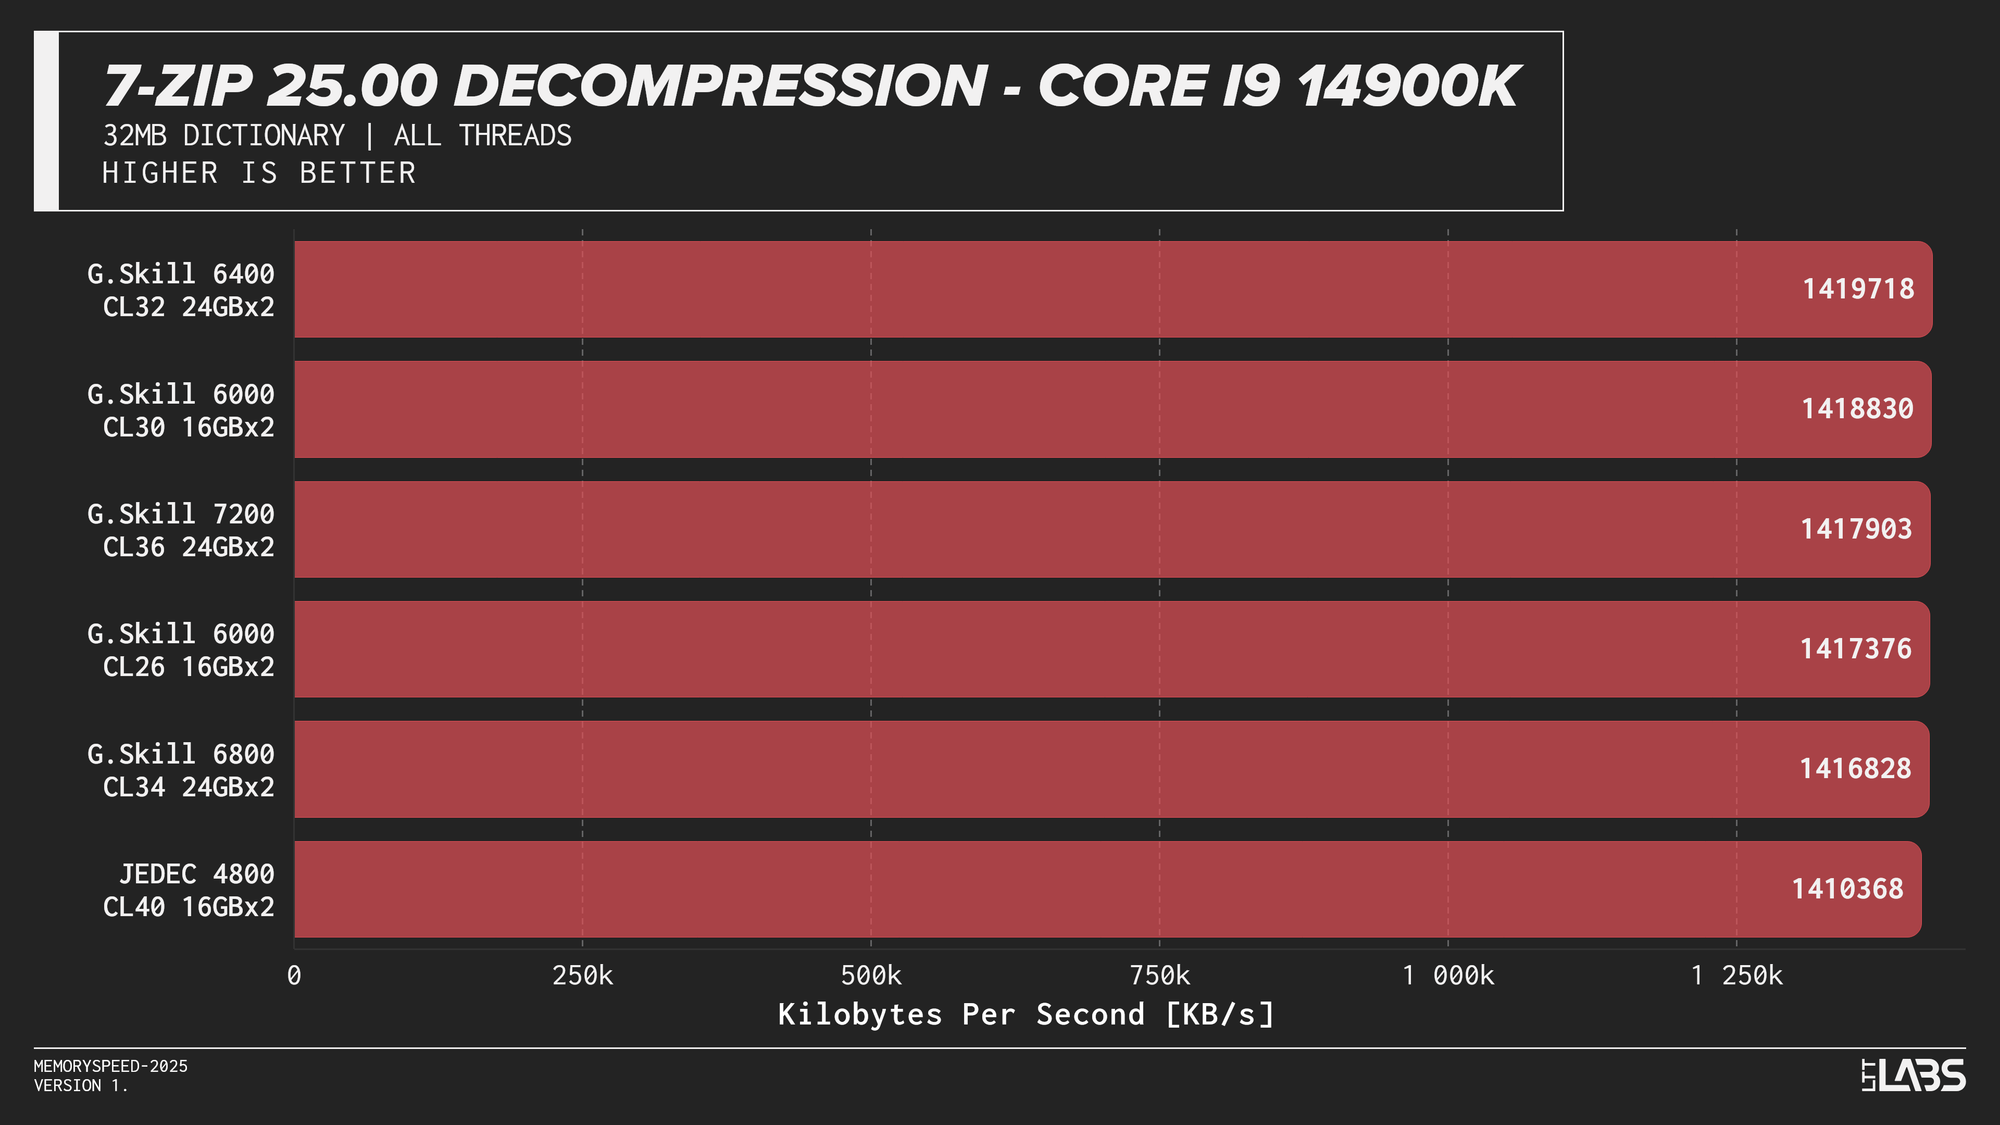

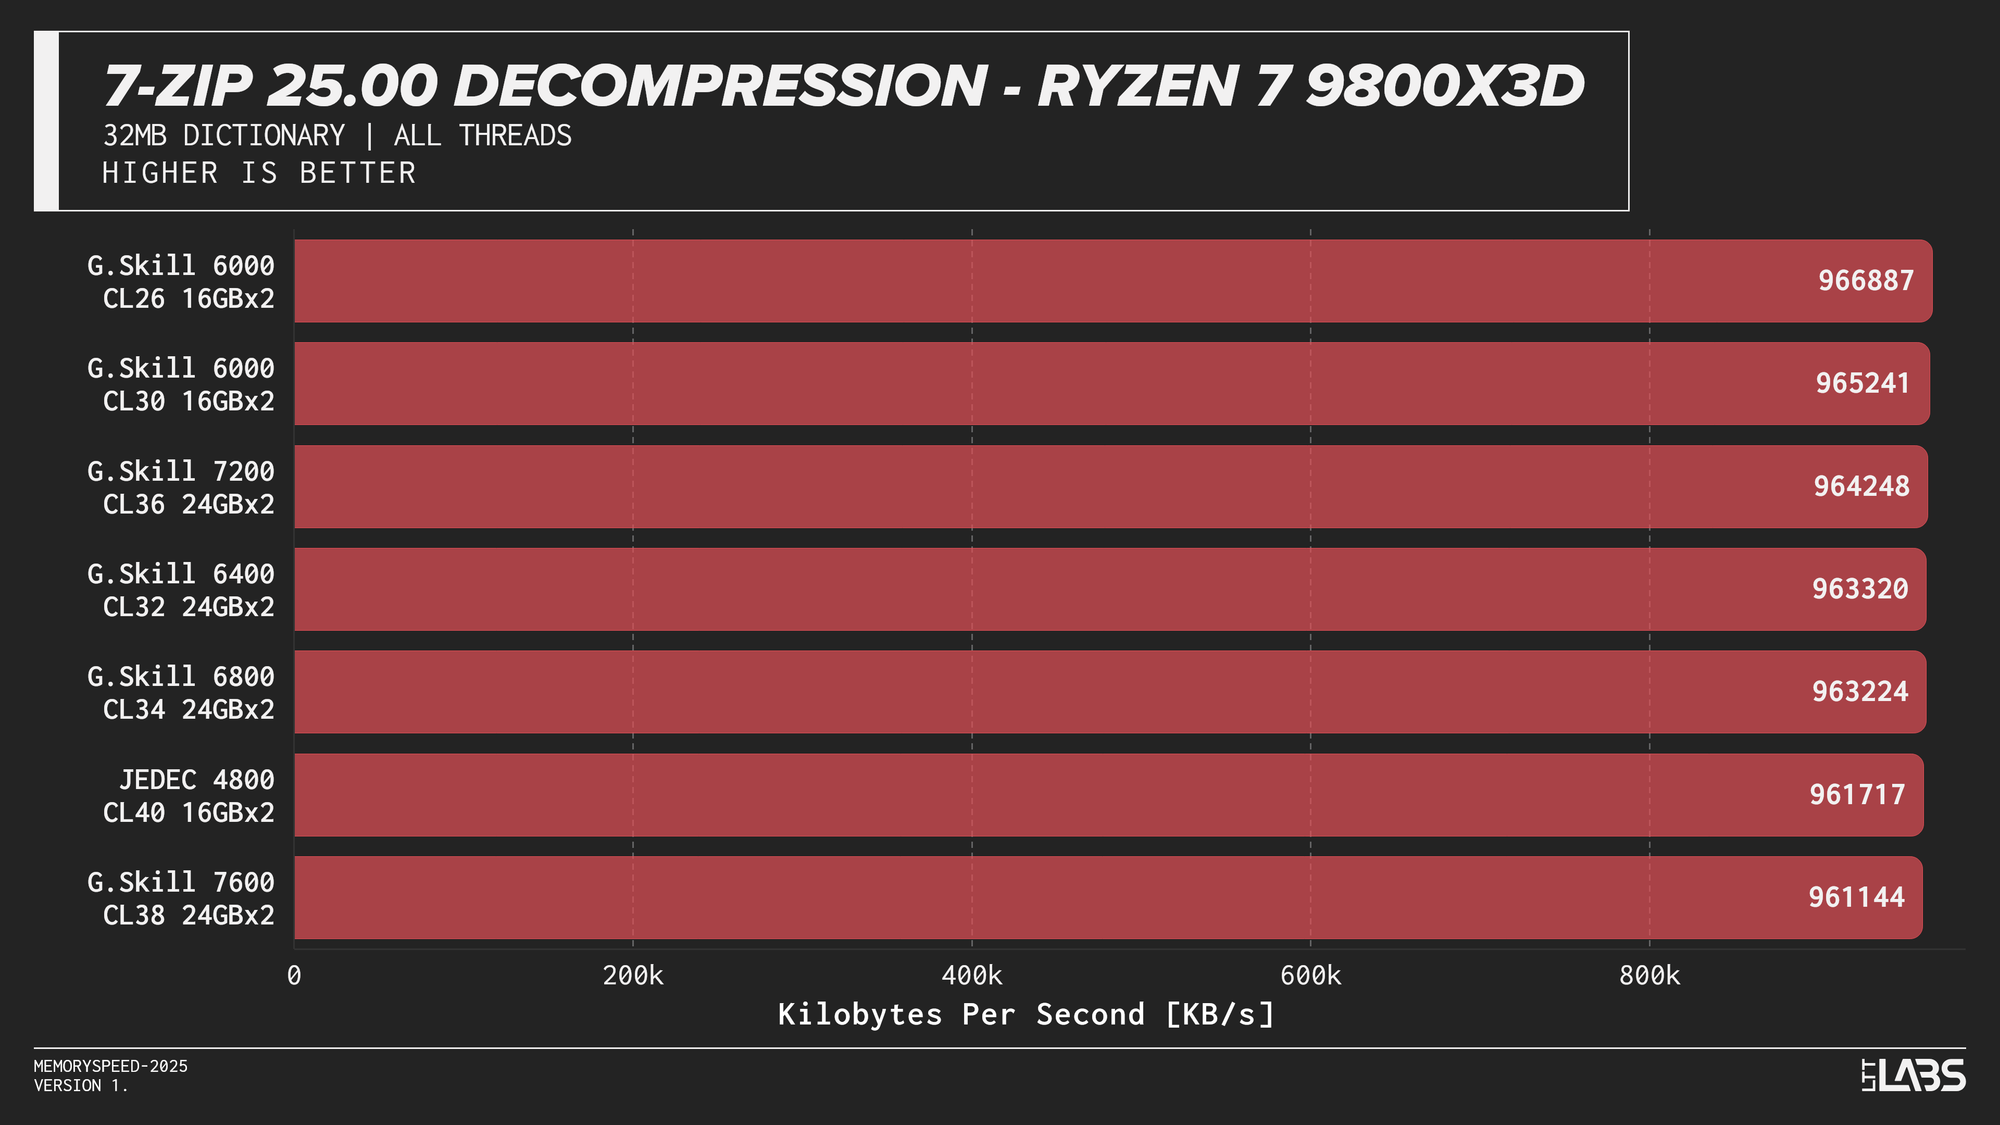
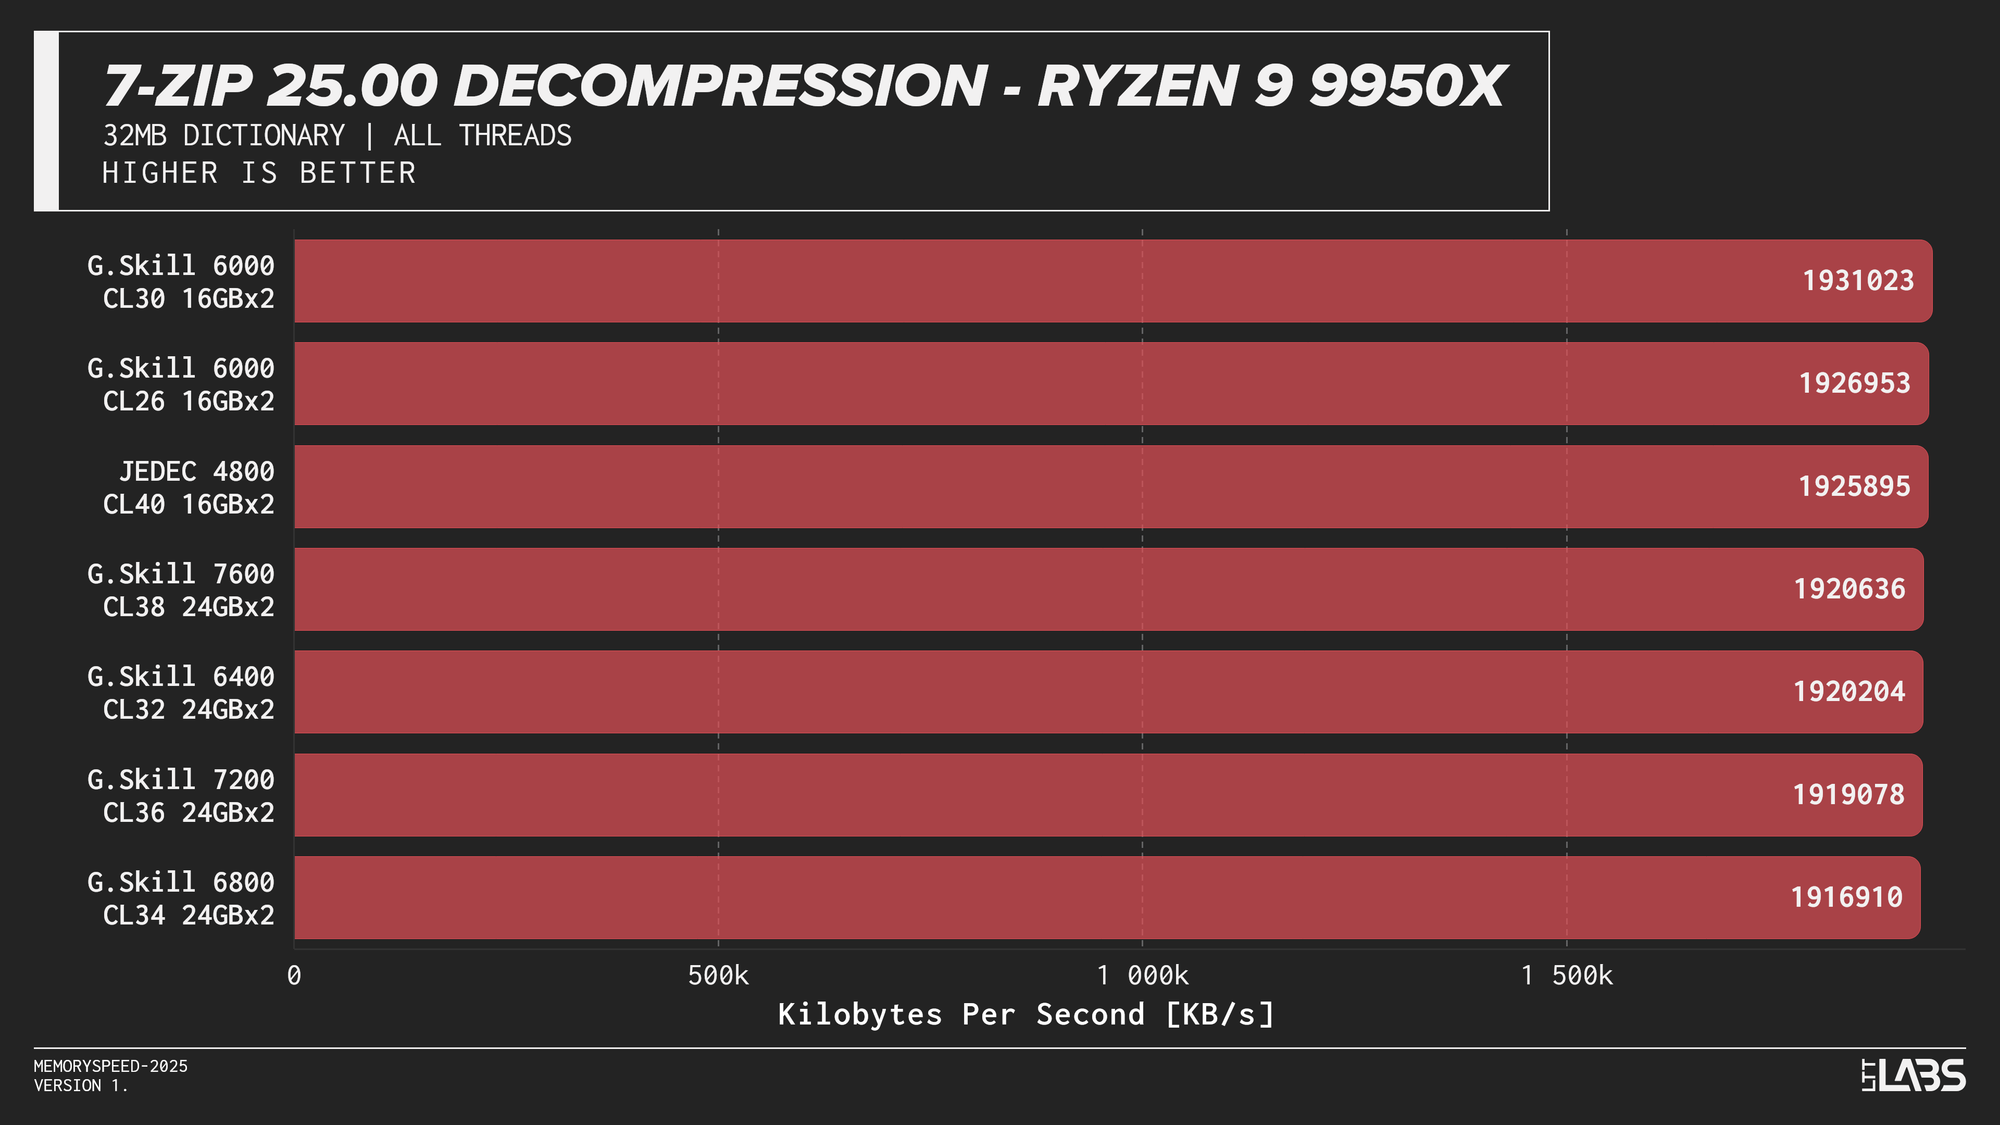
7-Zip 25.00 Decompression
In contrast the 7Zip decompression scores were barely any different between the JEDEC and tuned memory kits, reinforcing the idea that decompression is not memory or CPU bound. Interestingly JEDEC did perform poorly only on the Ultra 9 285K.
7-Zip exhibited the clearest memory scaling within the synthetic suite. The LZMA compression workload operates on a large dictionary and performs latency-sensitive match searches, making it particularly sensitive to memory latency and, at higher thread counts, memory bandwidth. While decompression also accesses the dictionary, its workload is more linear and more dependent on integer execution and branch behaviour. As a result, compression scales more noticeably with overclocked DDR5 speeds, whereas decompression shows comparatively reduced scaling due to its greater reliance on compute resources rather than memory subsystem performance.
Cinebench 2024 (Single-Core and Multi-Core)
Single-Core
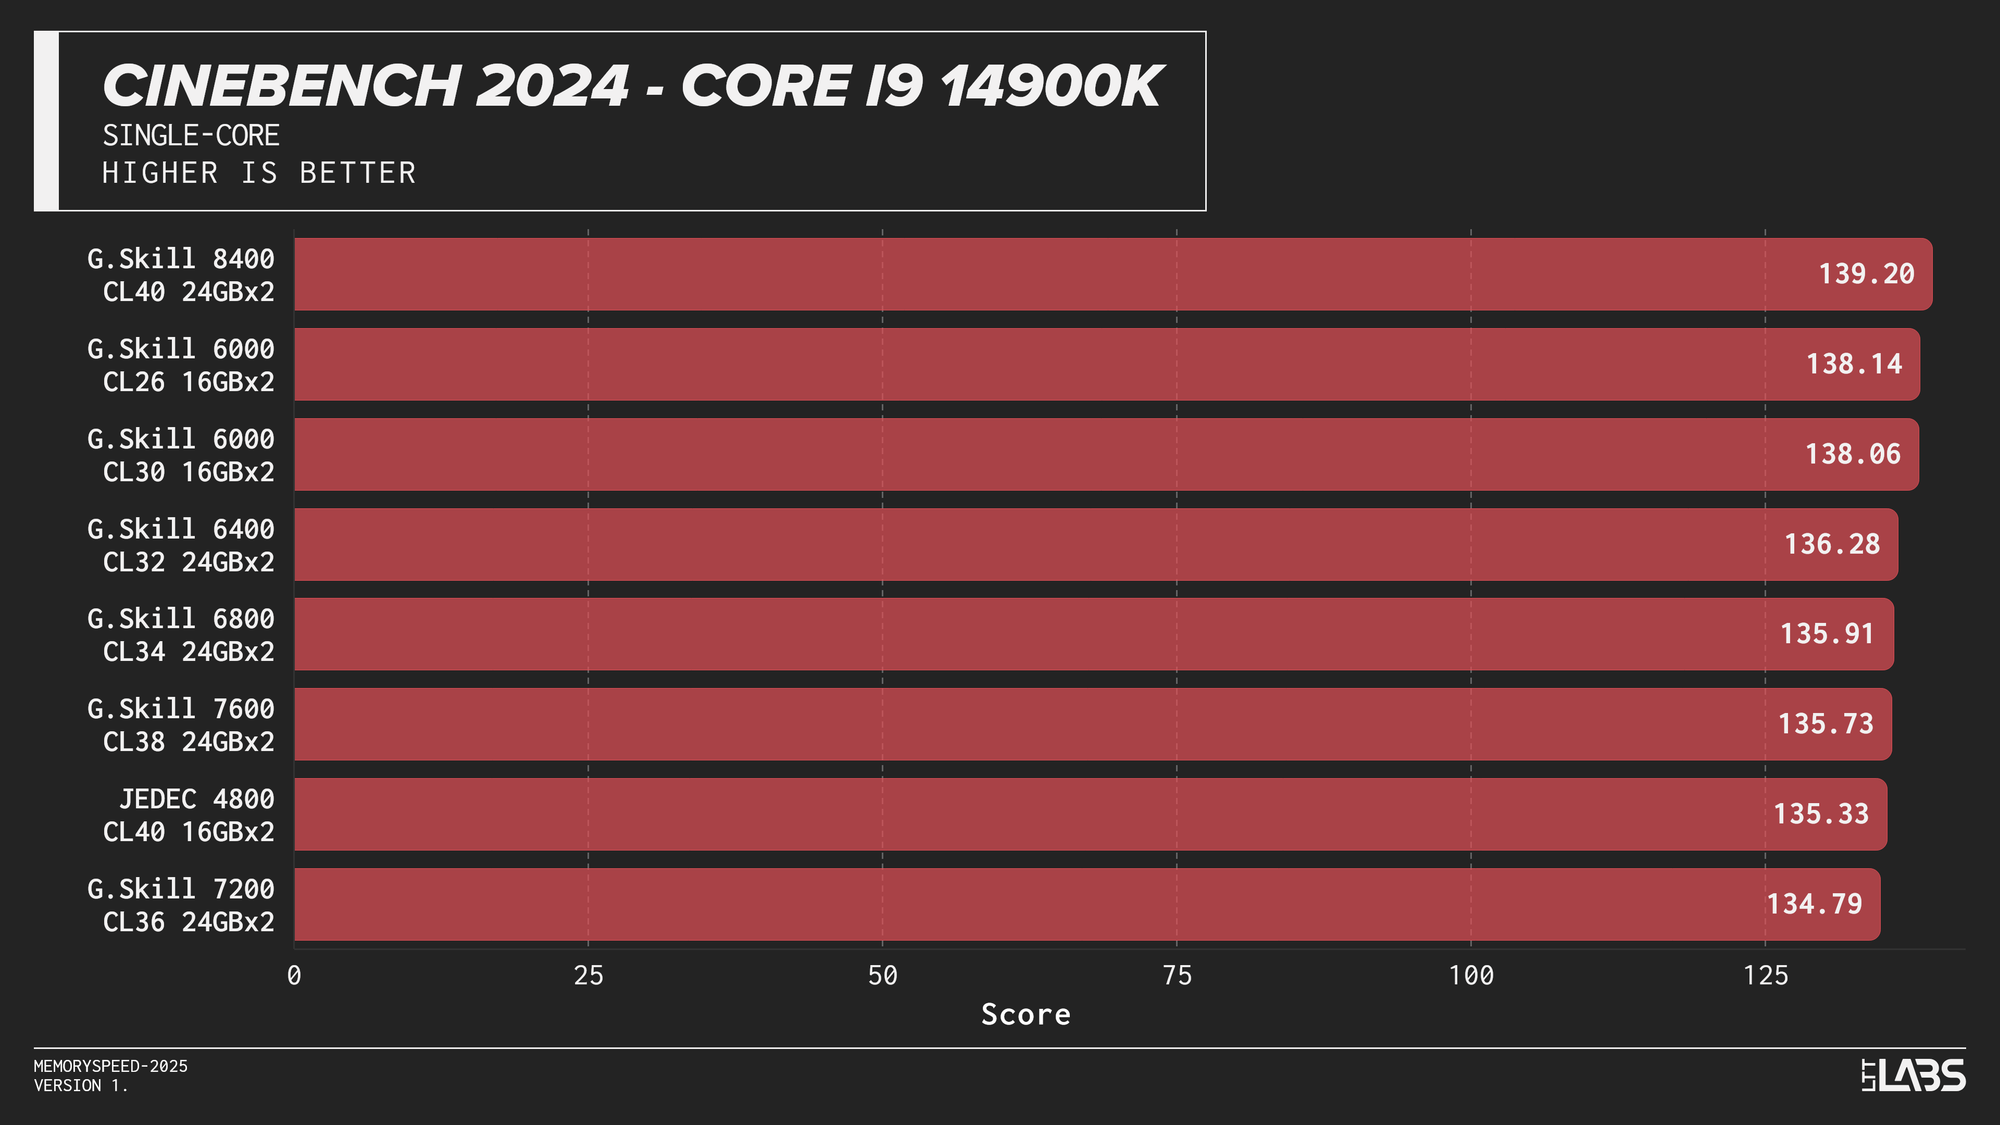
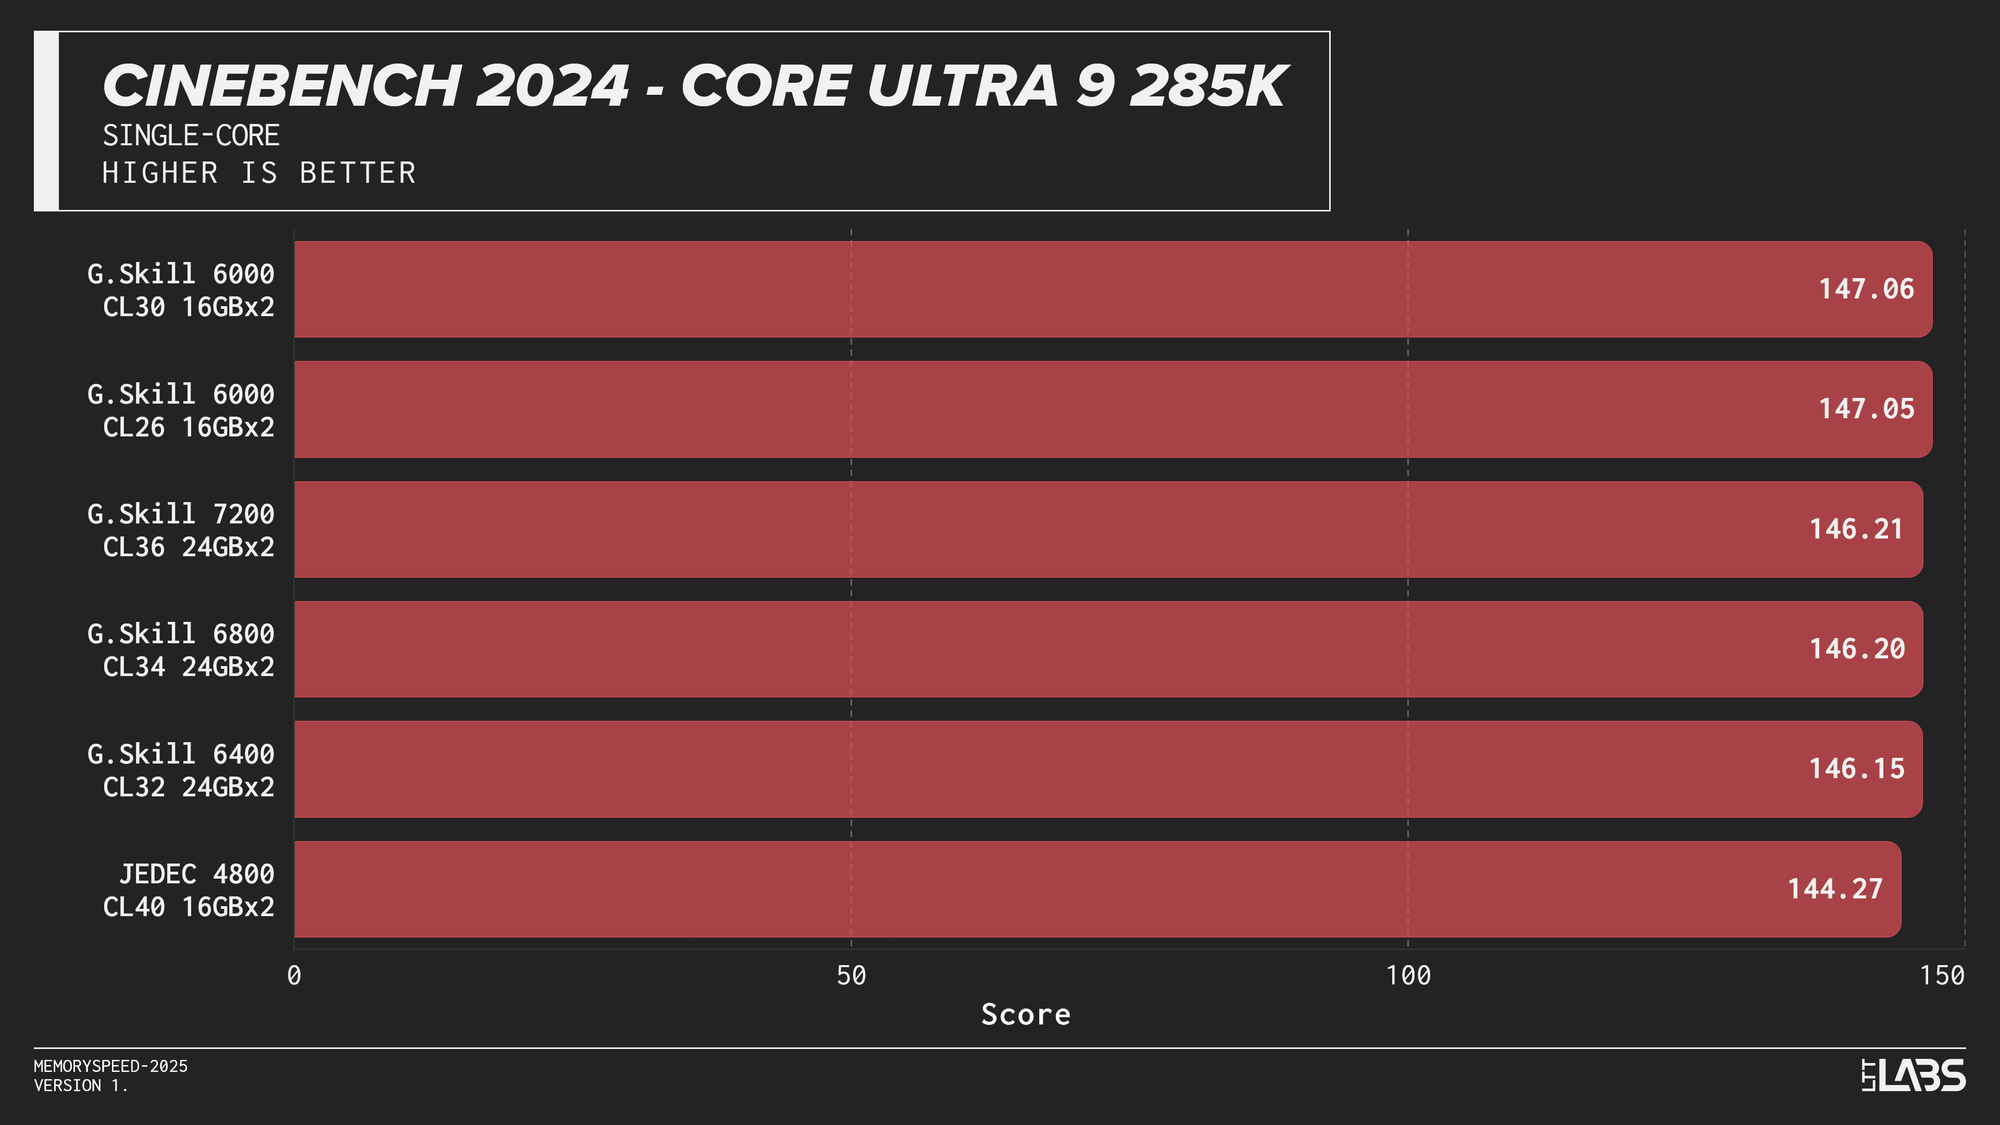

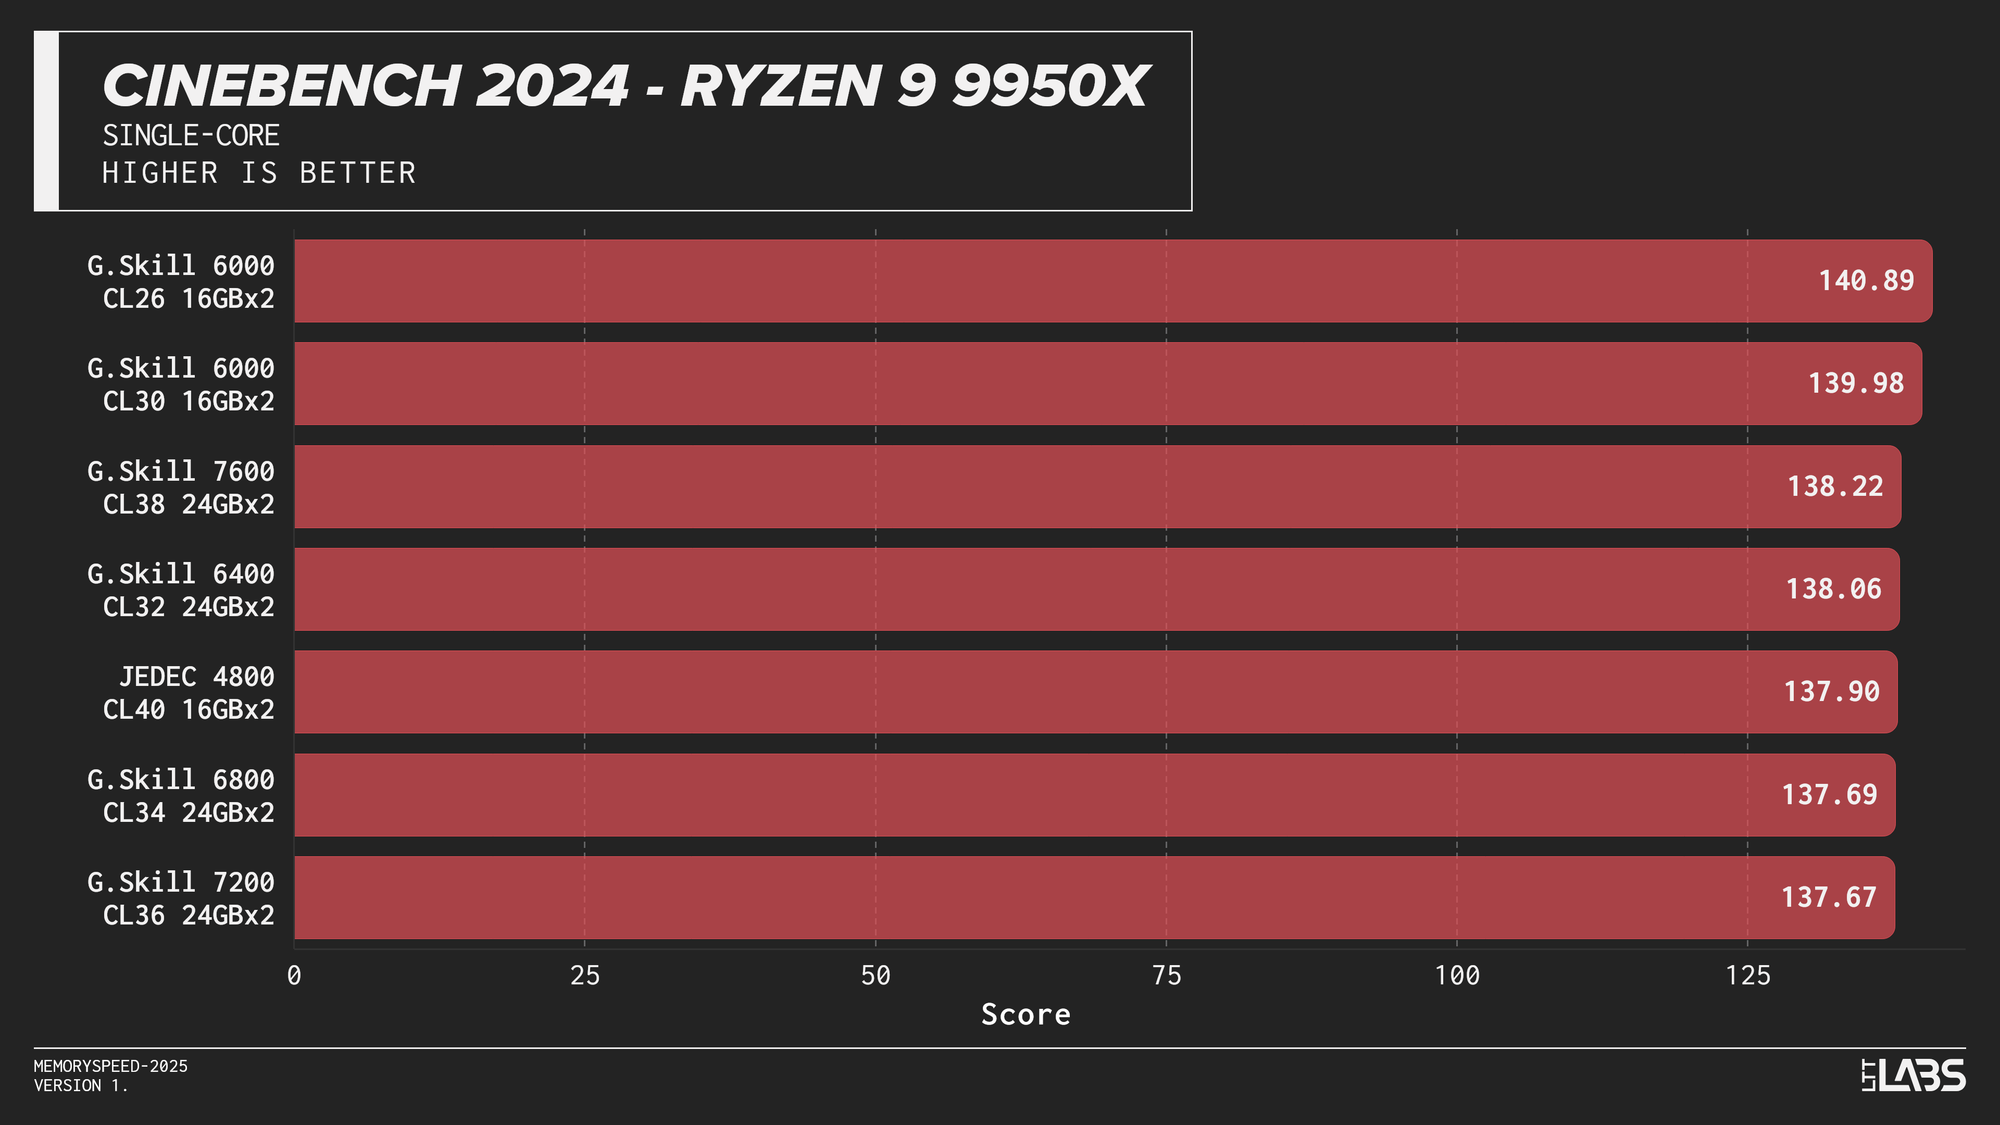
Cinebench 2024 Single-Core
Multi-Core
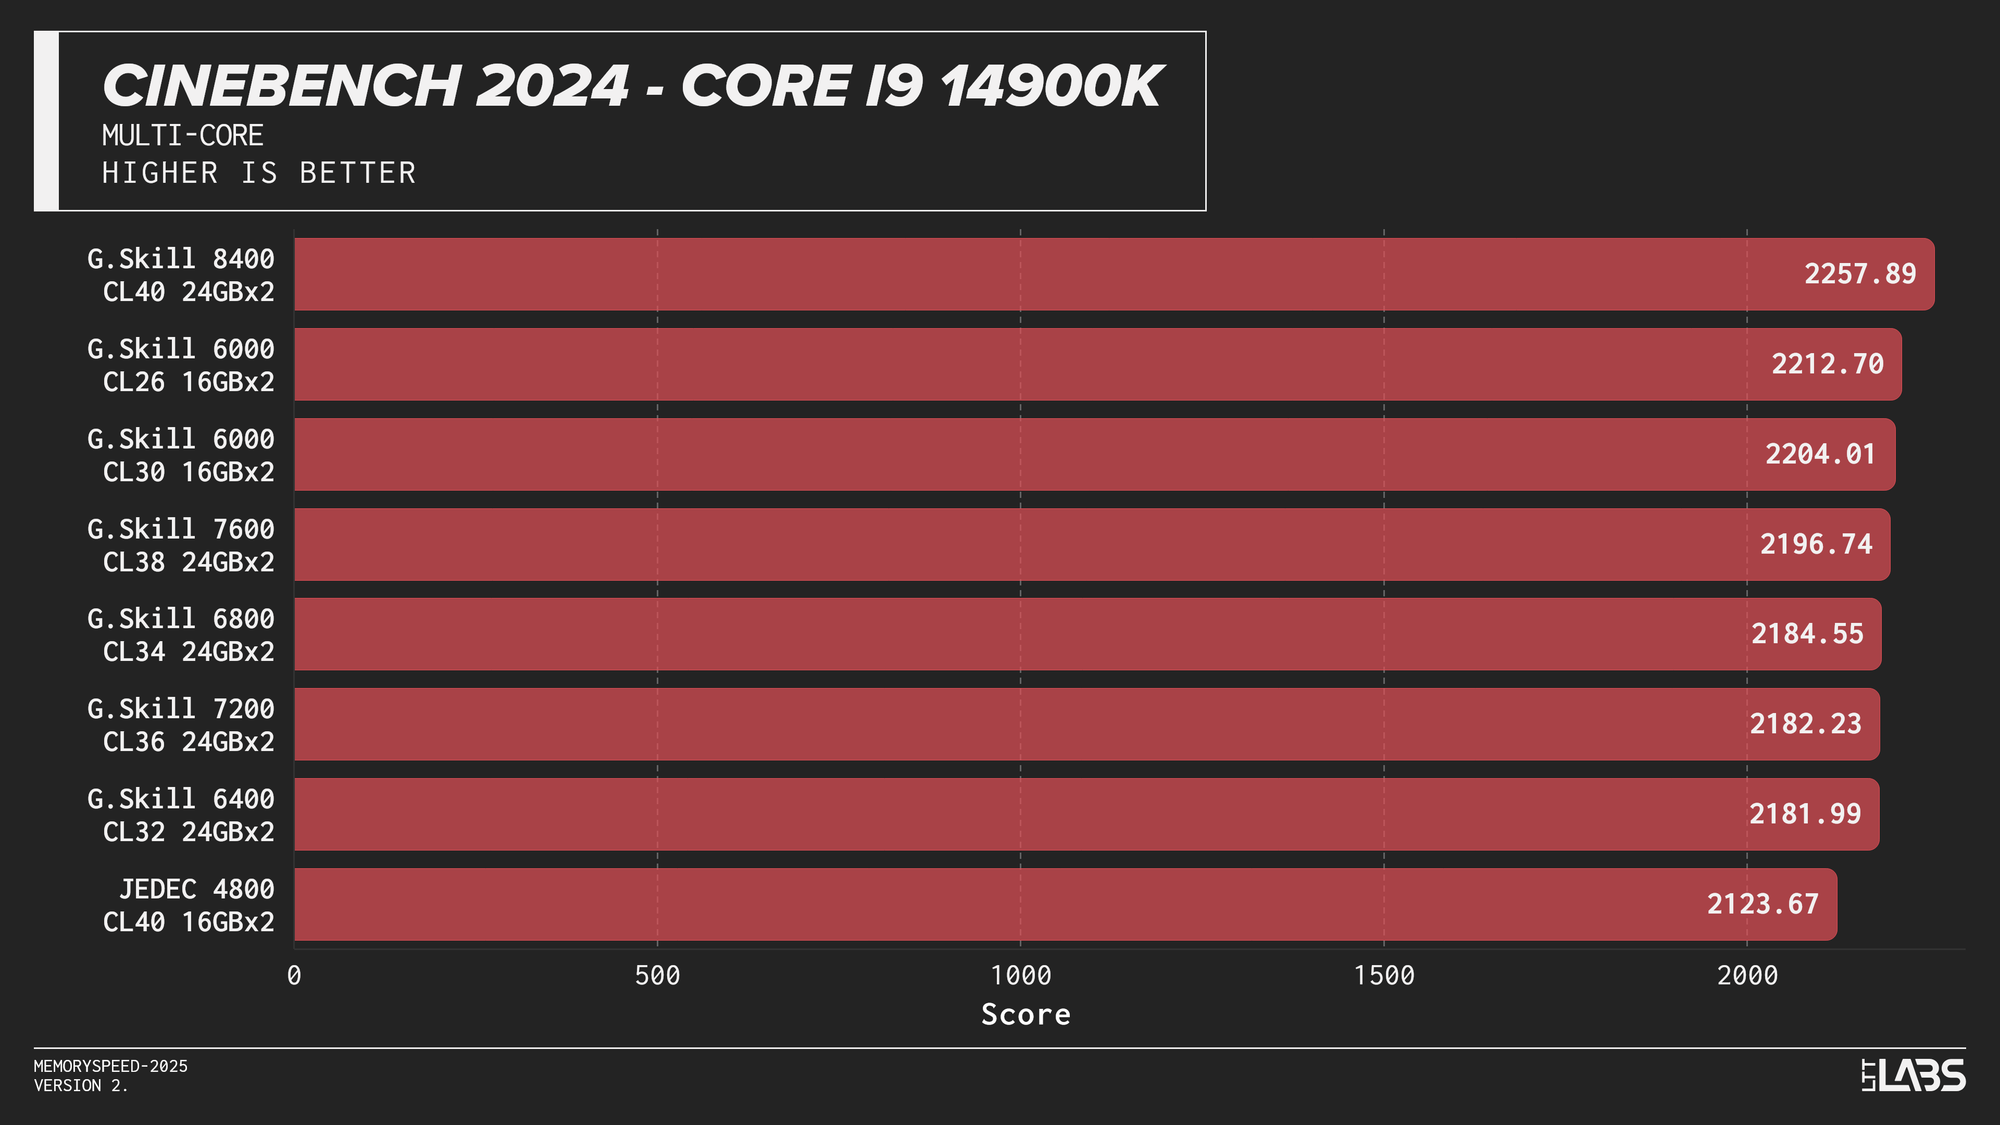

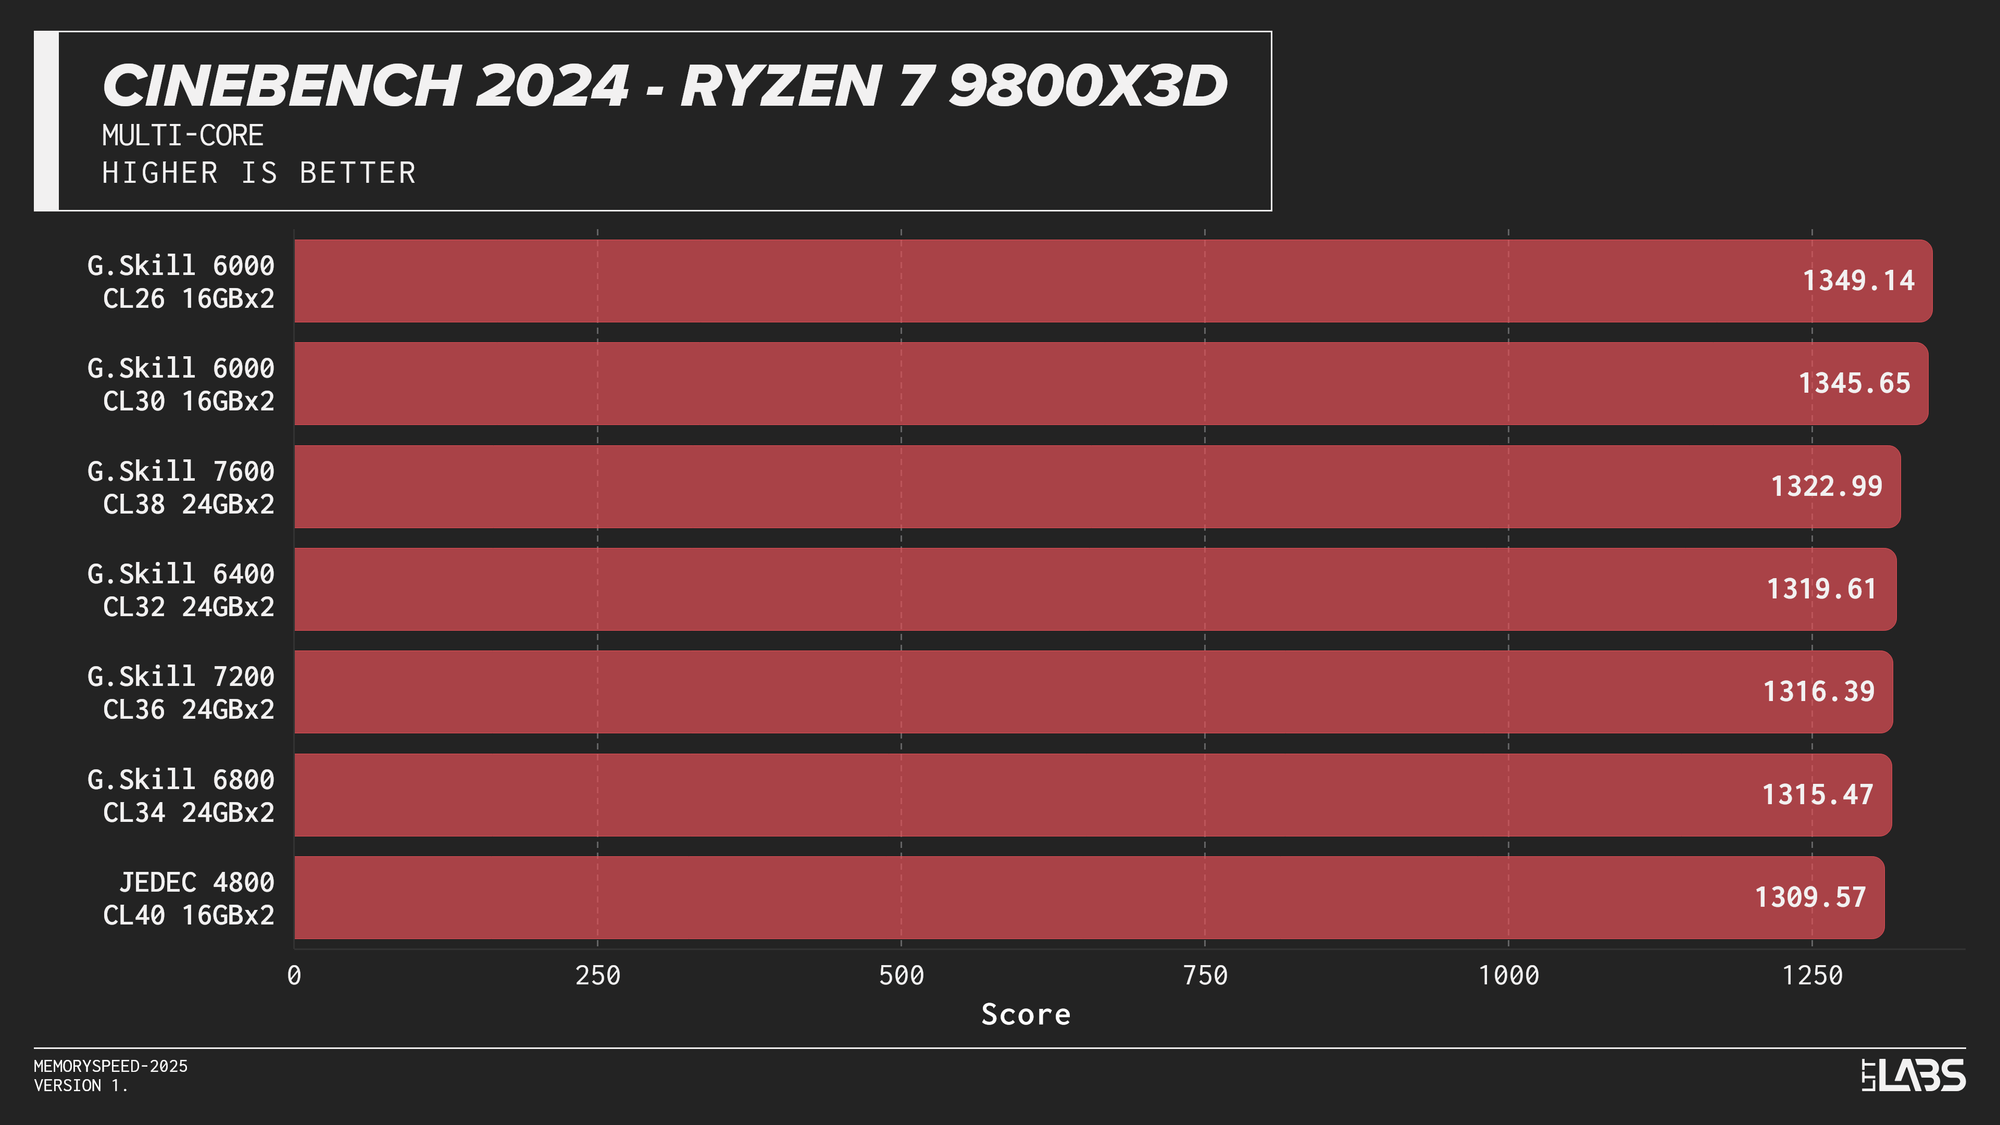
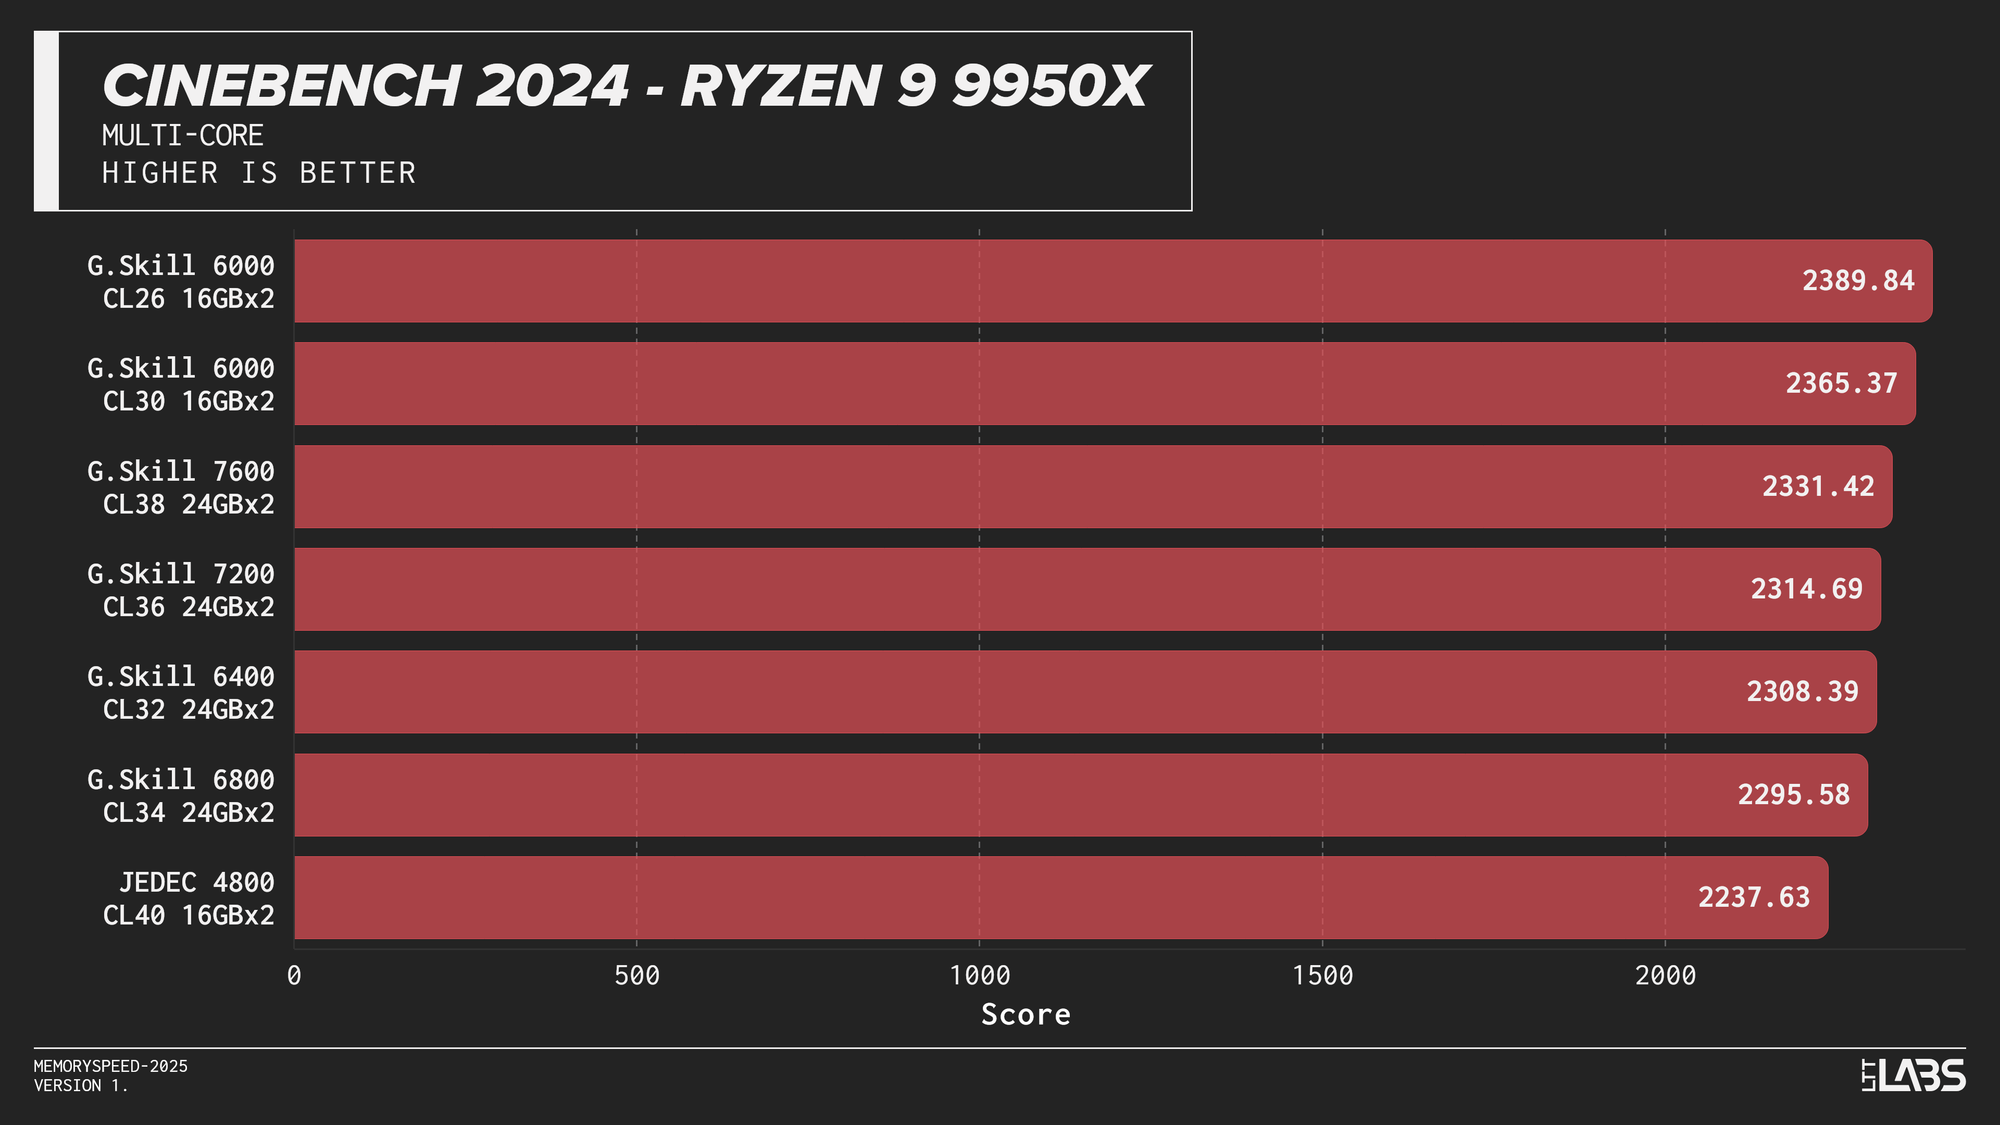
Cinebench 2024 Multi-Core
Cinebench 2024 runs on Maxon’s Redshift rendering engine, using the same scene for CPU and GPU benchmarking and increasing the memory footprint relative to the previous R23 version. It shows some sensitivity to memory frequency and latency, particularly when transitioning from JEDEC to overclocked kits. Though most memory kits performed quite similarly. This effect is marginally more noticeable when scaling from single-core to multi-core workloads, though the difference between tuned kits remains minor for the most part, only seeing a larger score on the 8400 MT/s kit for the 14900K.
If Maxon's Redshift renderer is part of your workflow, for the most part you don't need to worry too much about which kit you use. The AMD CPUs showed yet again that the sweet spot is 6000 MT/s. However, for Intel, unless you are capable of running the 8400 MT/s CL40 kit on your system, any other kit aside from JEDEC will serve you just fine.
Primesieve 12.3
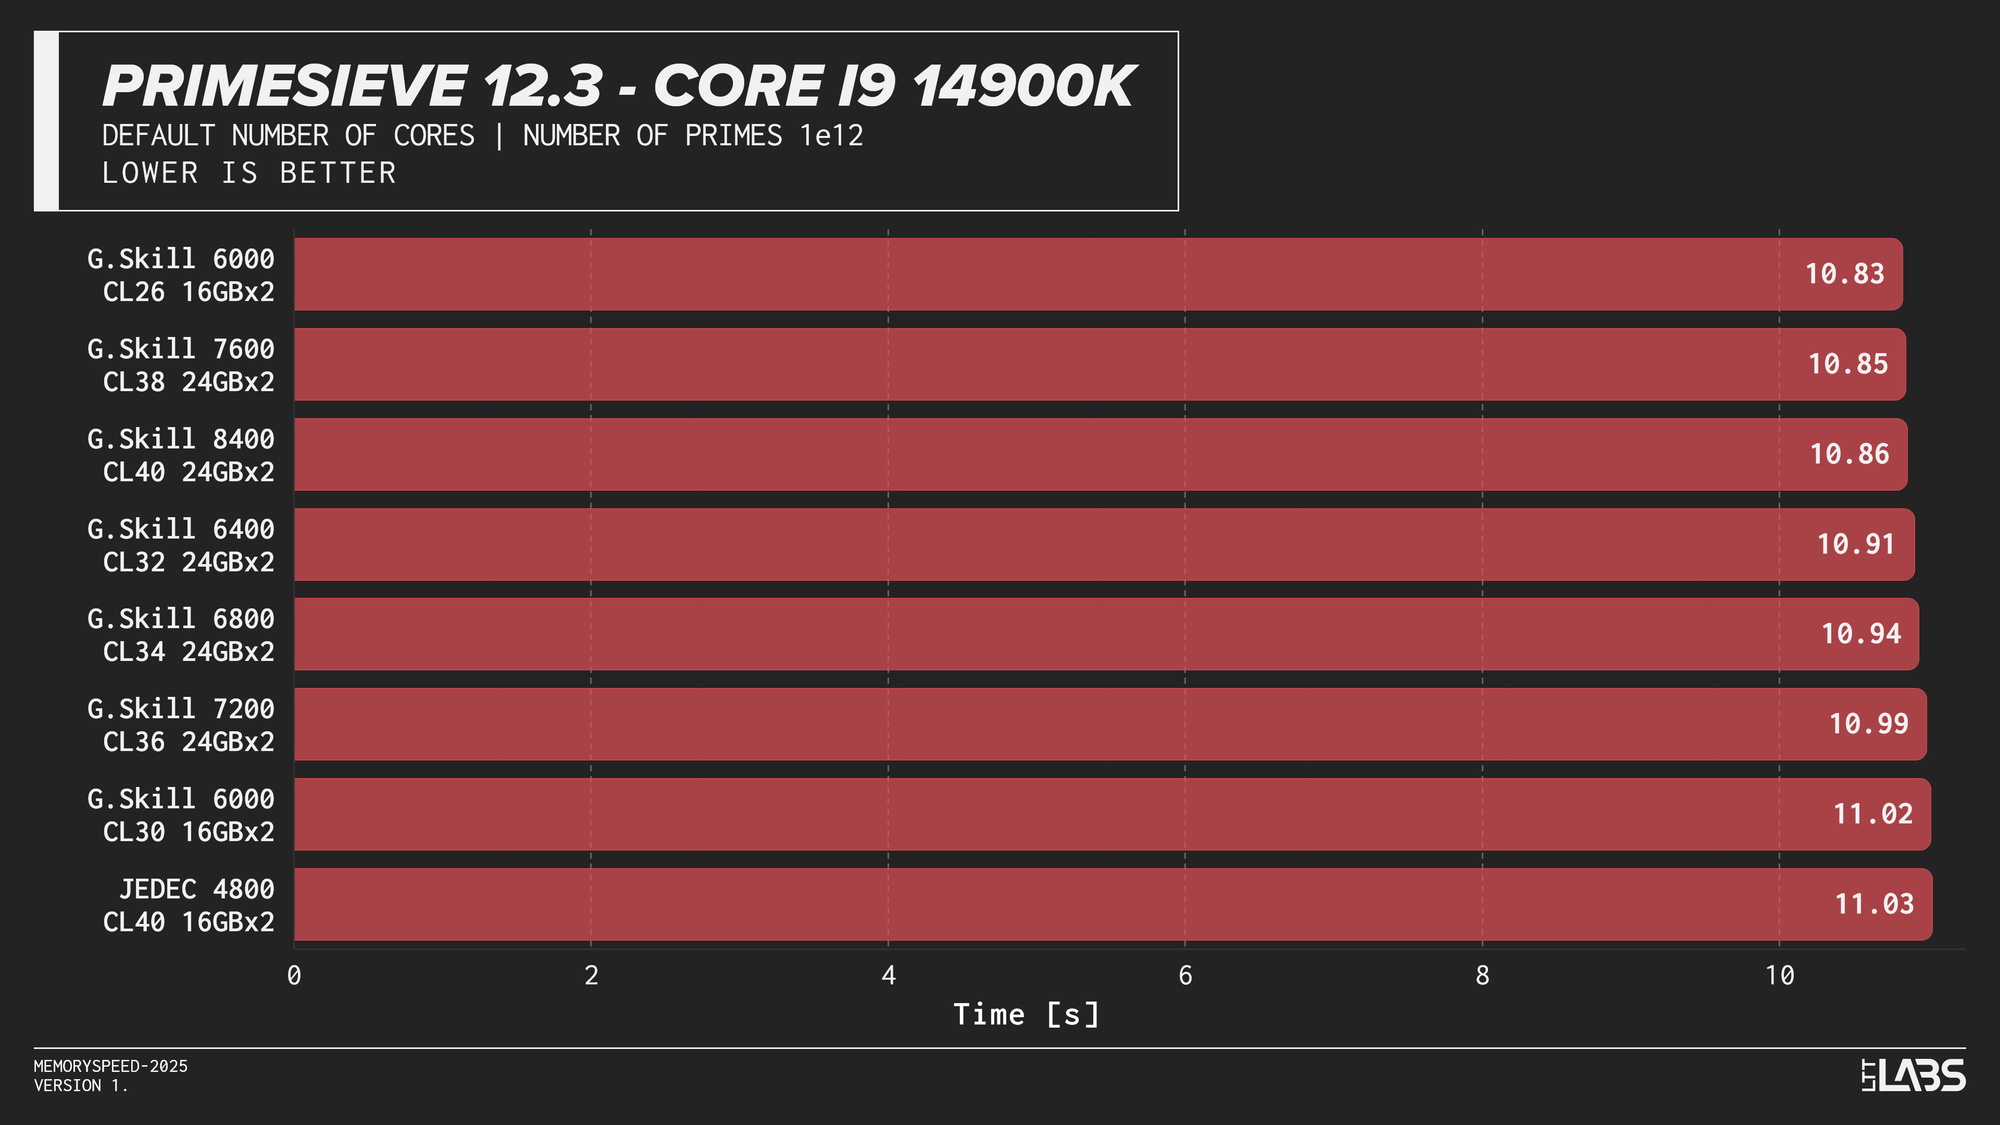
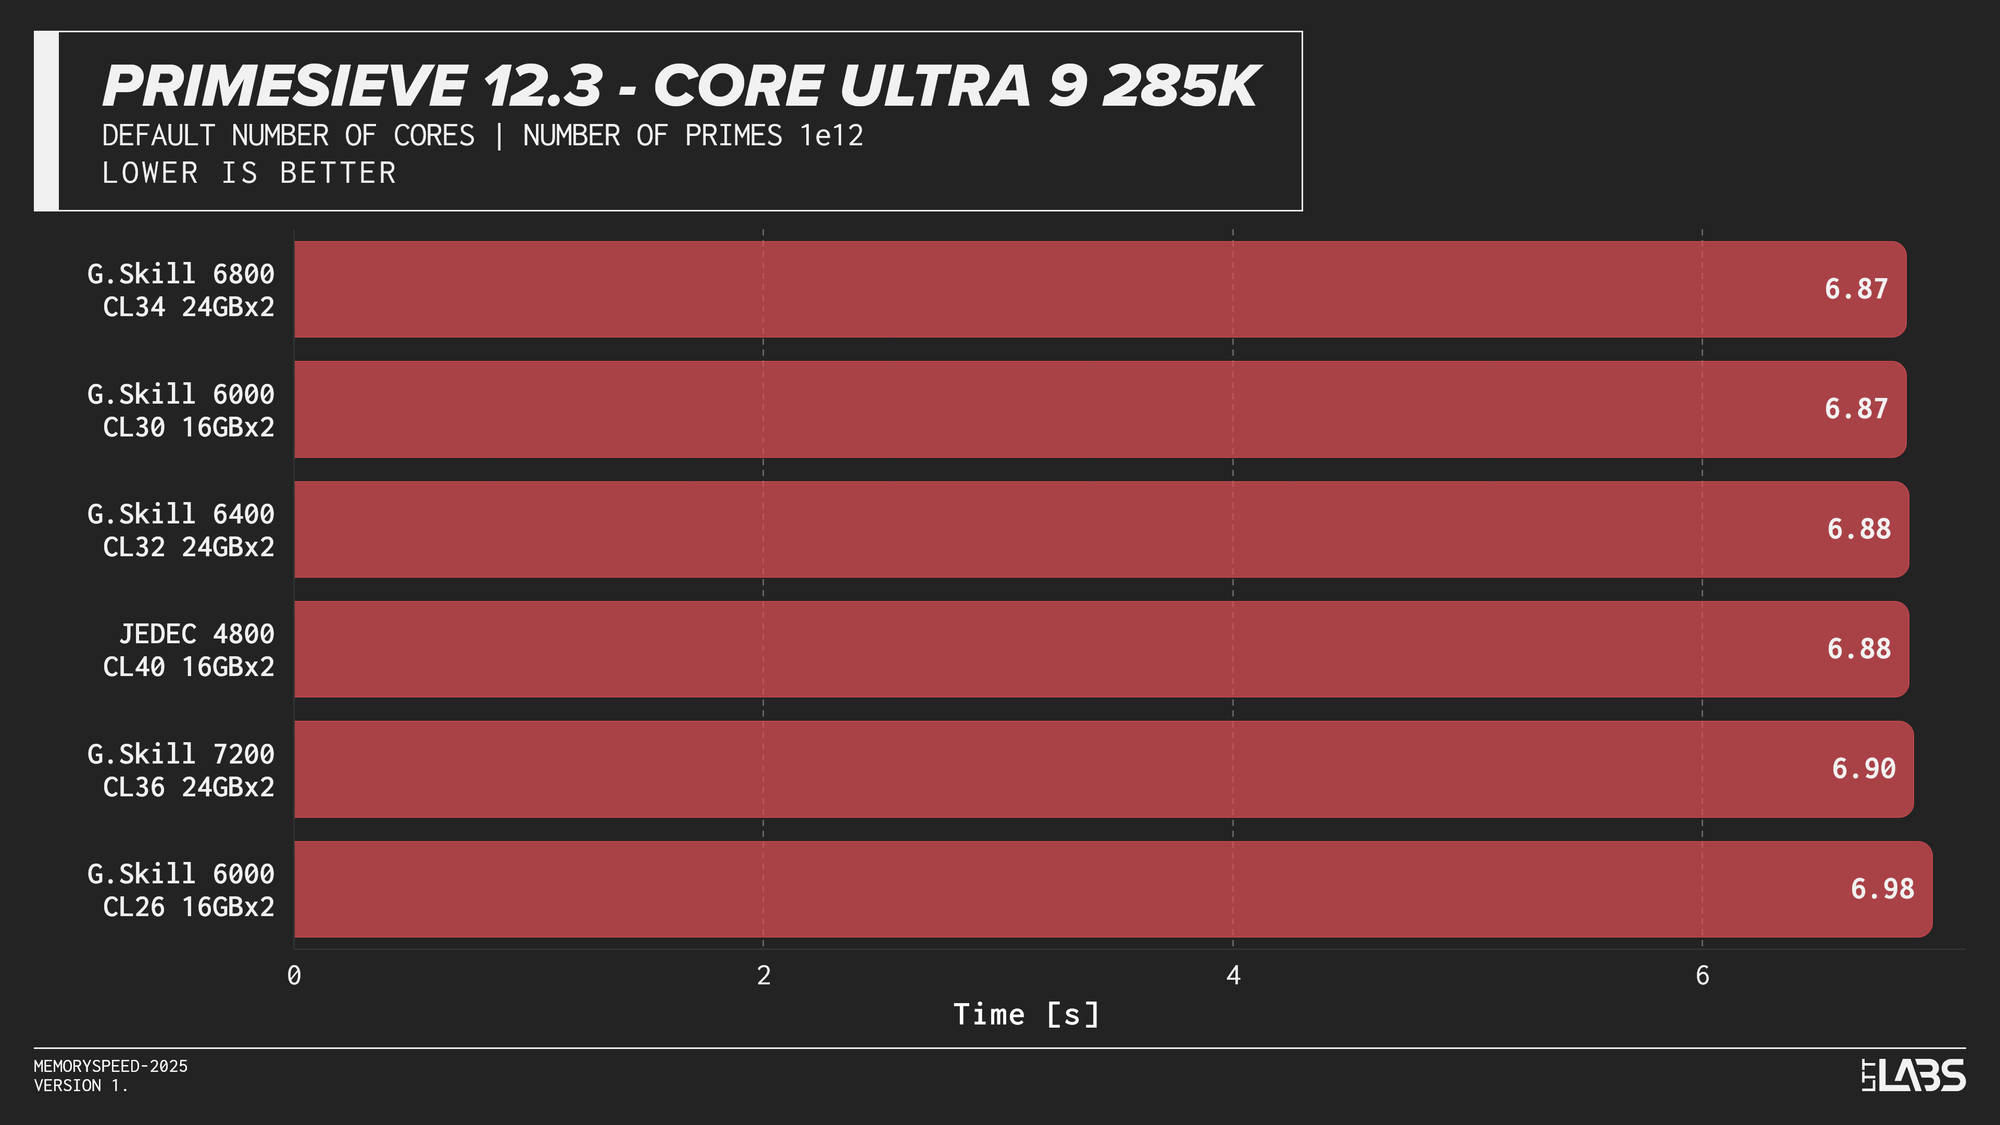
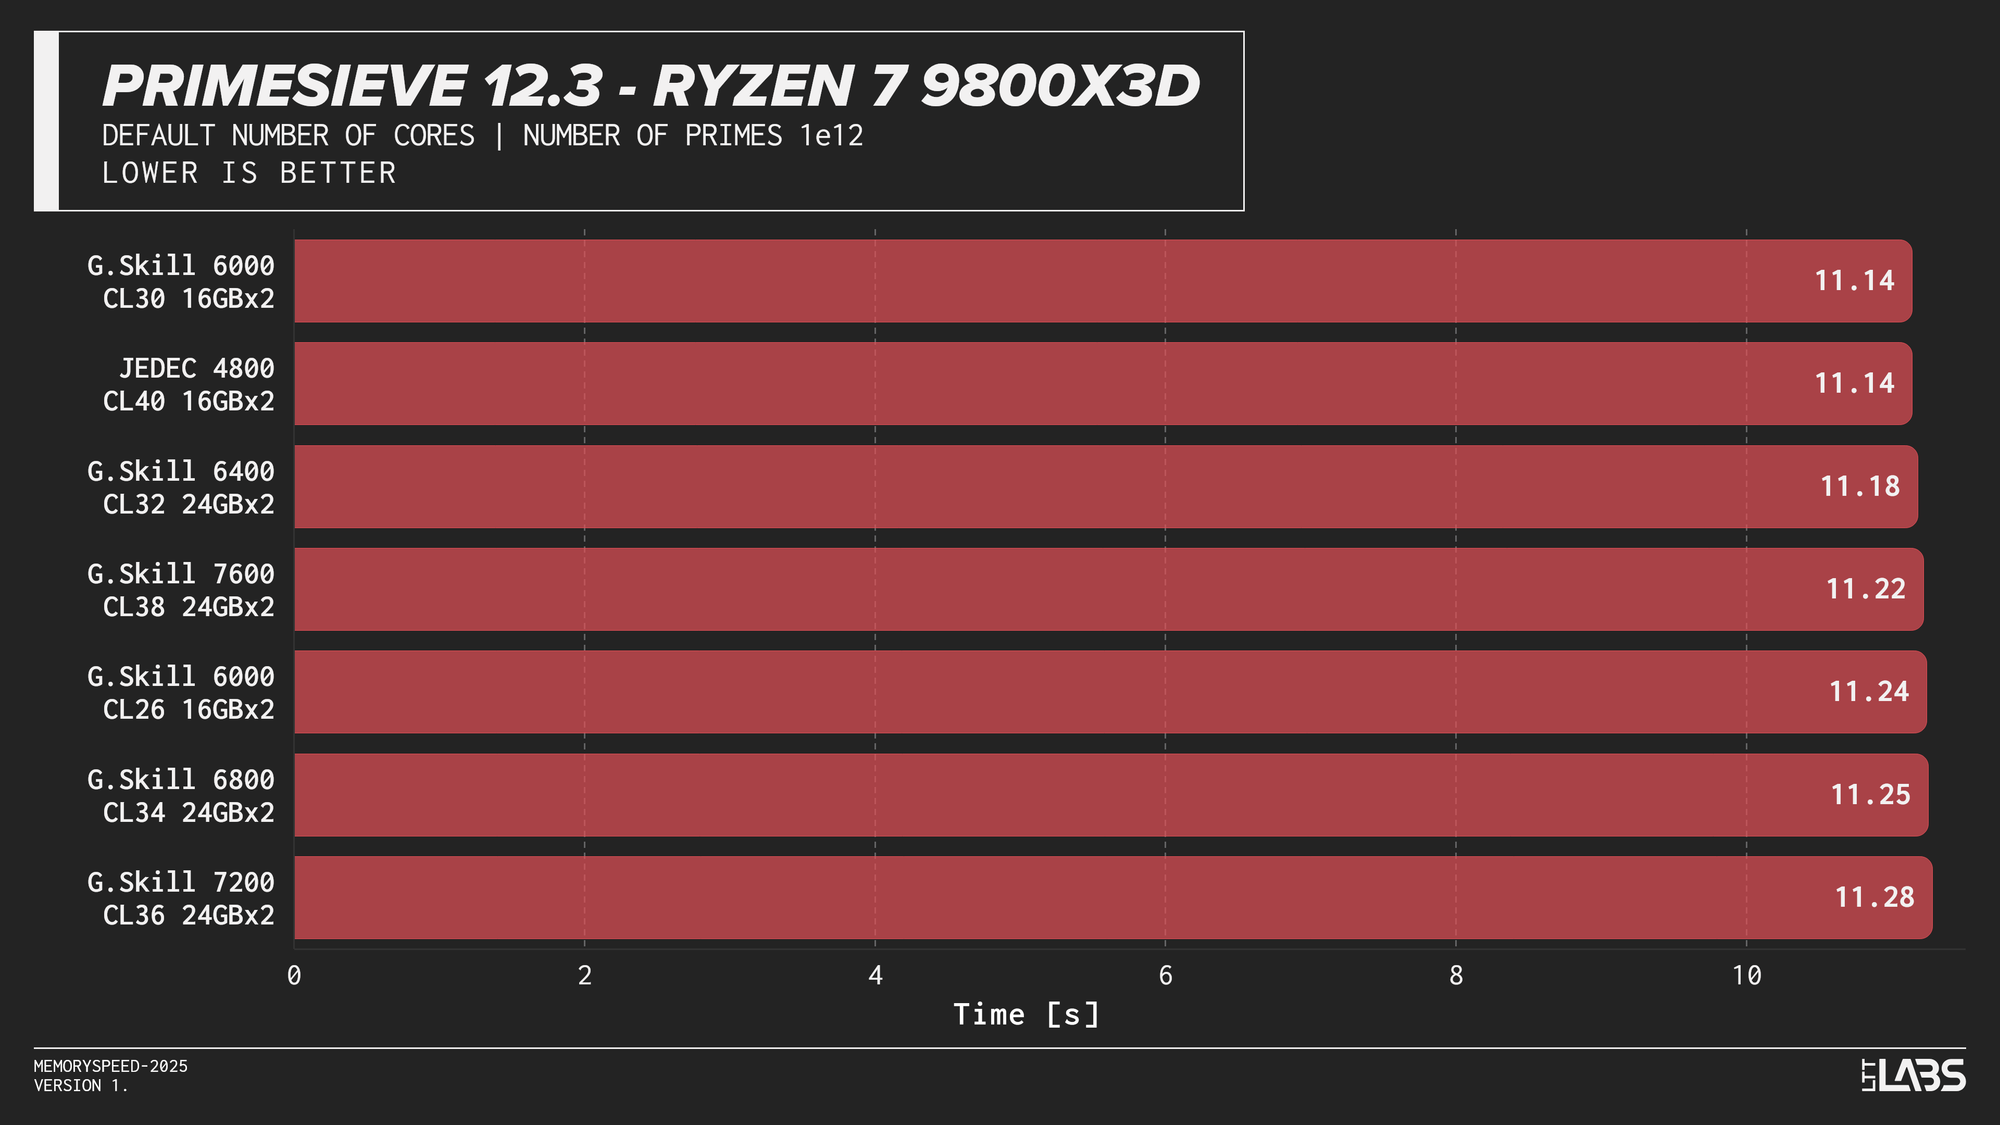
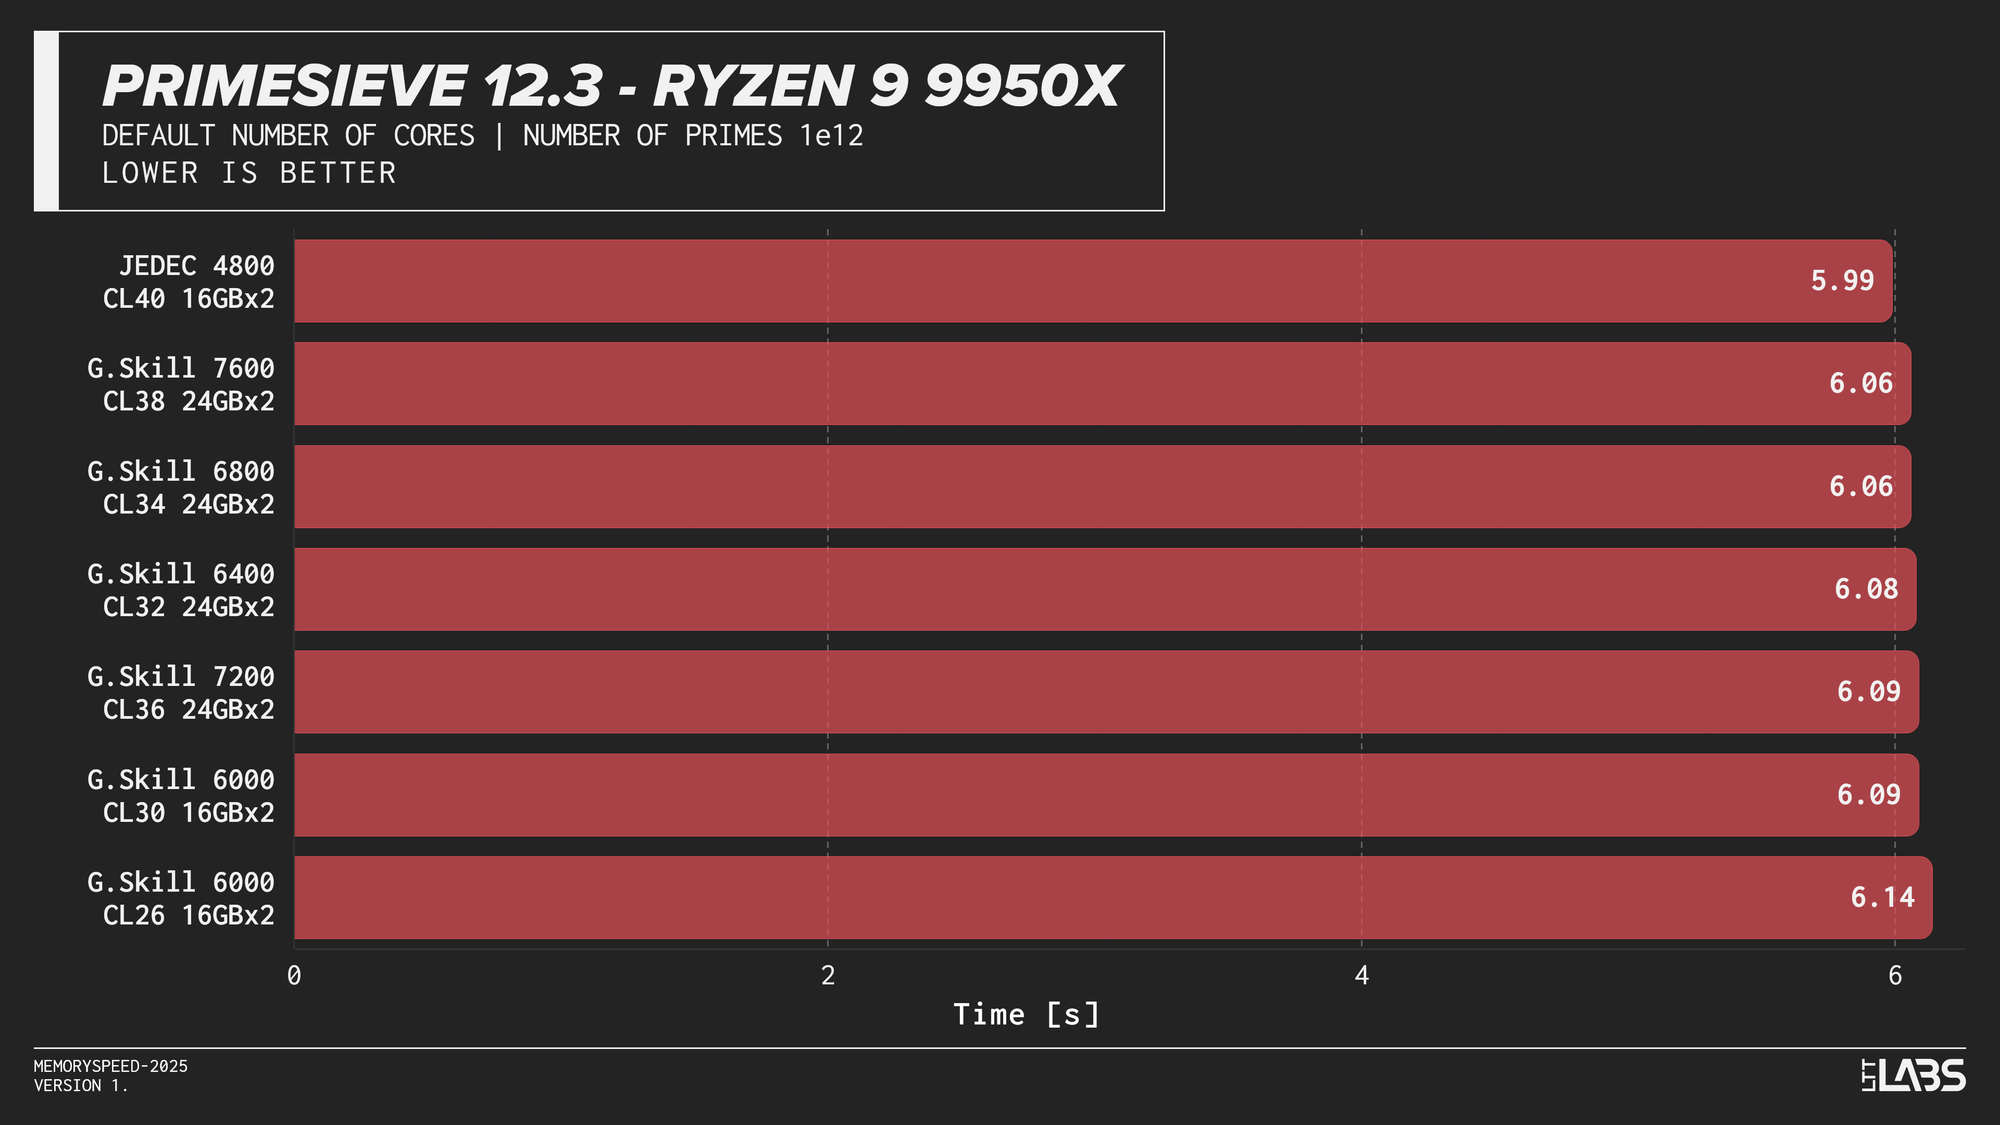
Primesieve 12.3
Primesieve showed virtually no meaningful change across memory configurations. The workload is highly compute-bound, extremely quick and operates efficiently within cache, resulting in run times that were effectively identical across JEDEC and high-speed DDR5 on all platforms. In fact, JEDEC beat all the other modules on the Ryzen 9 9950X tests. The difference is small but worth noting.
Y-Cruncher 0.8.5
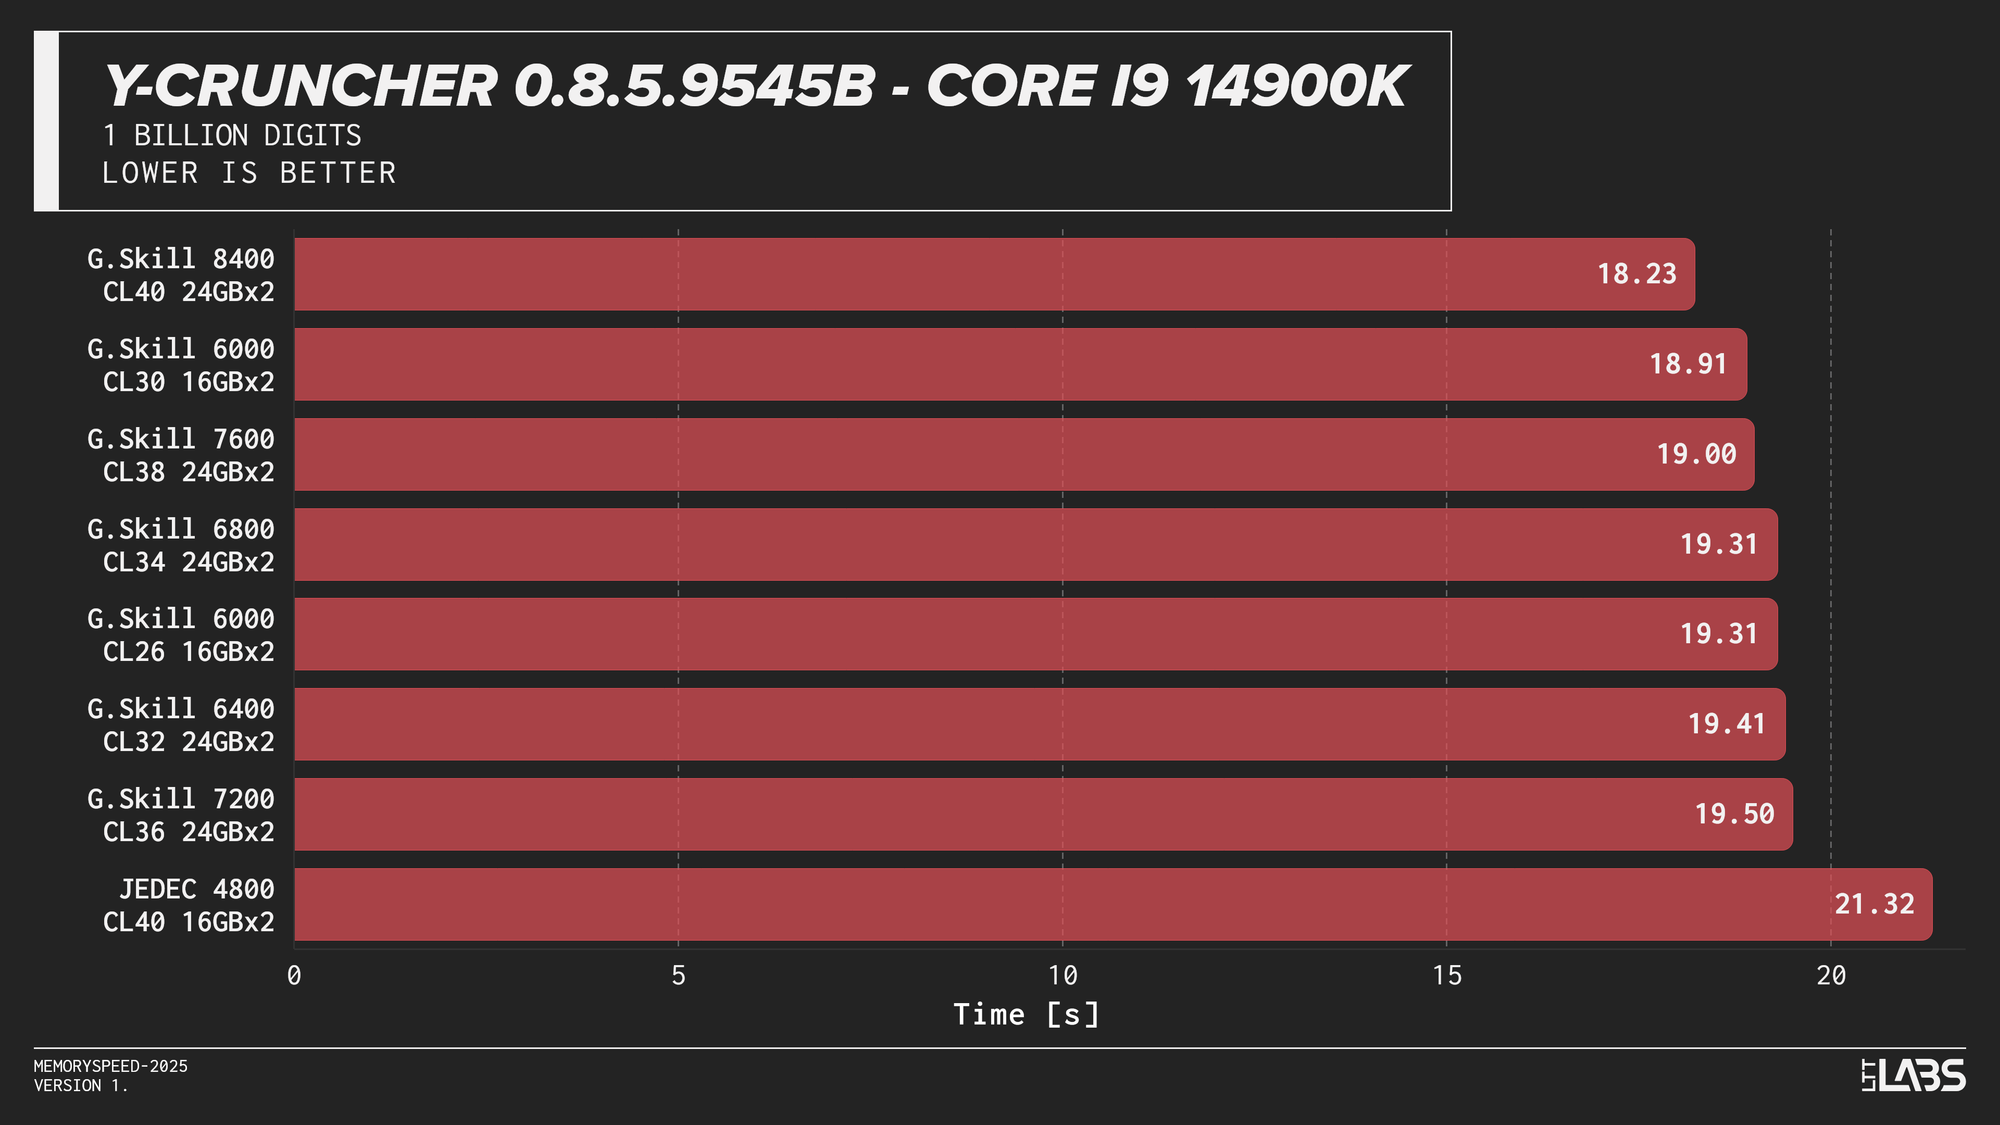
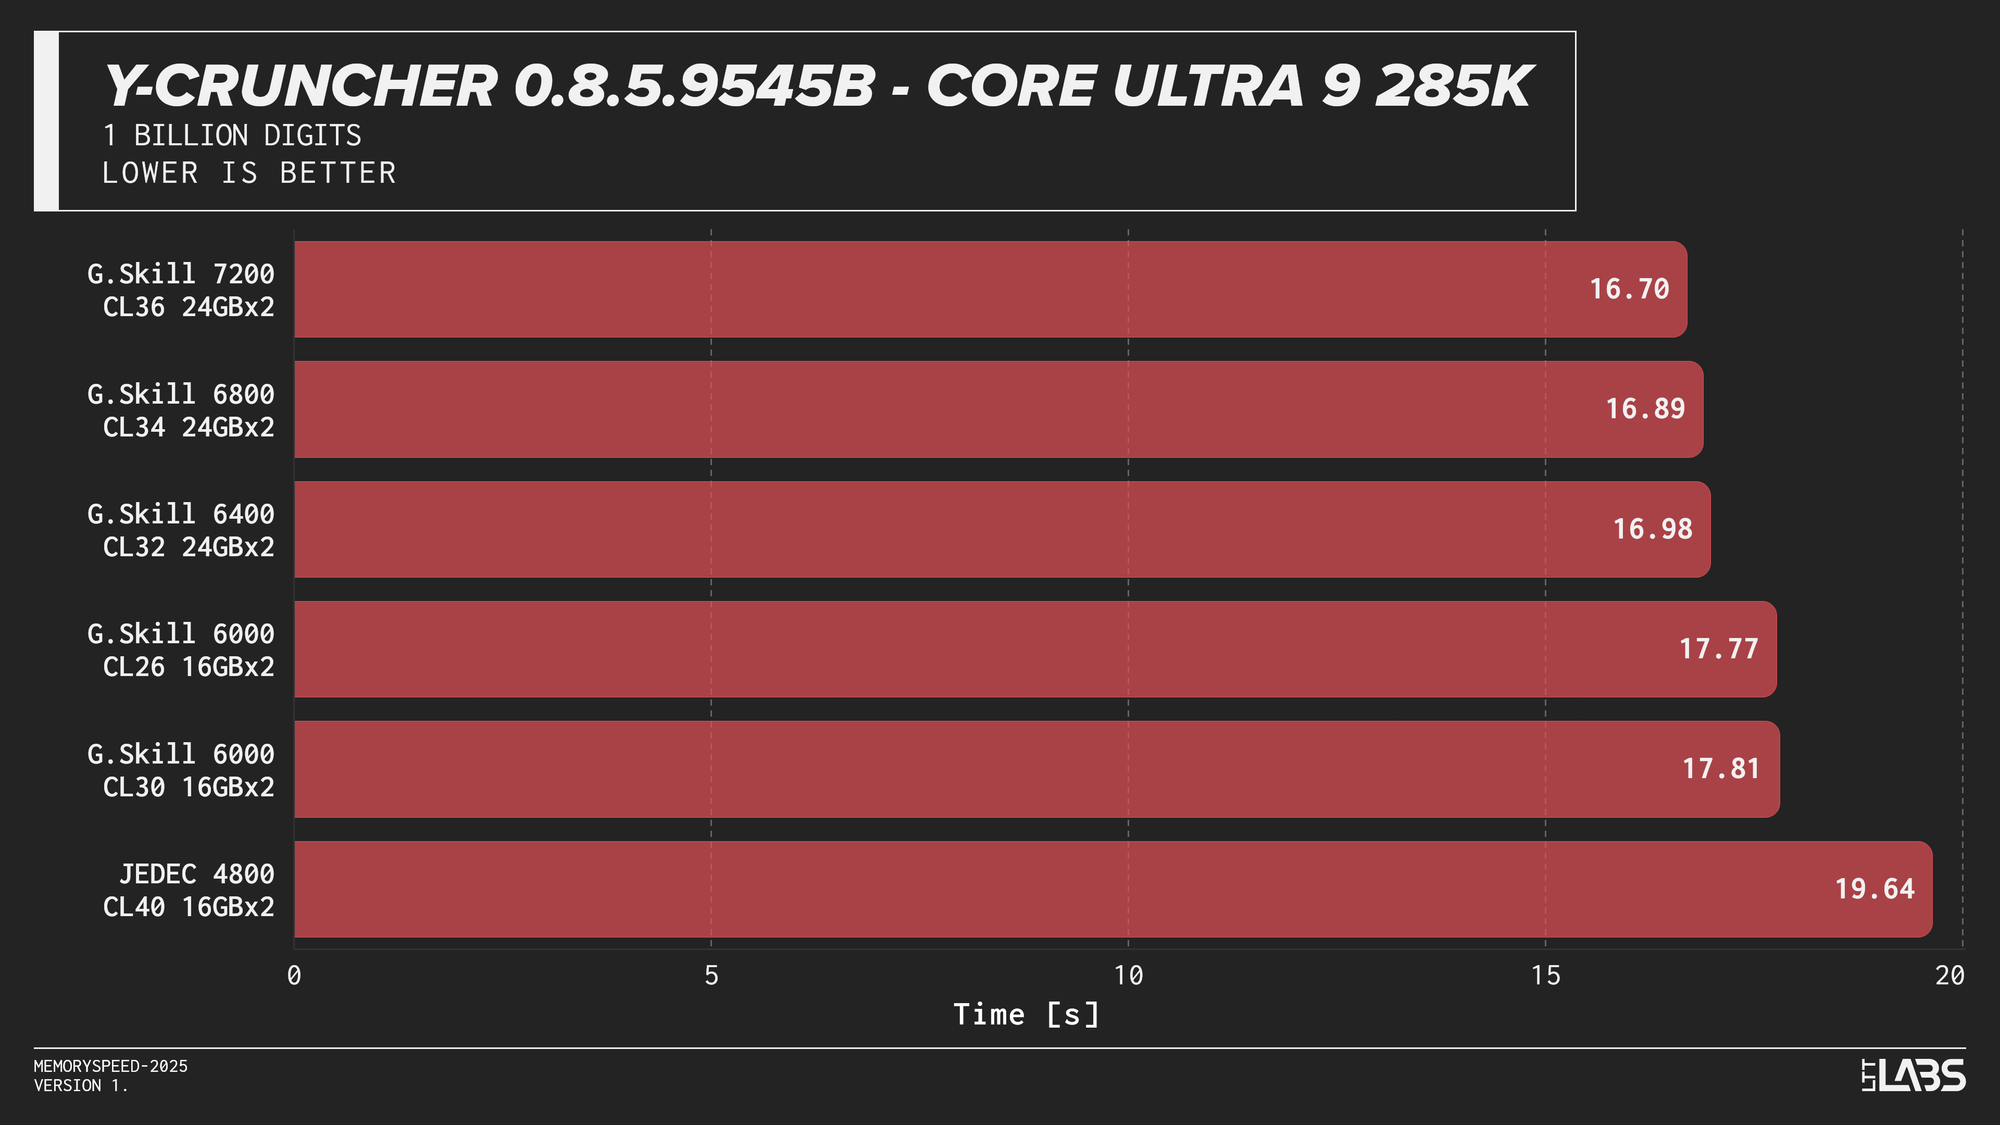
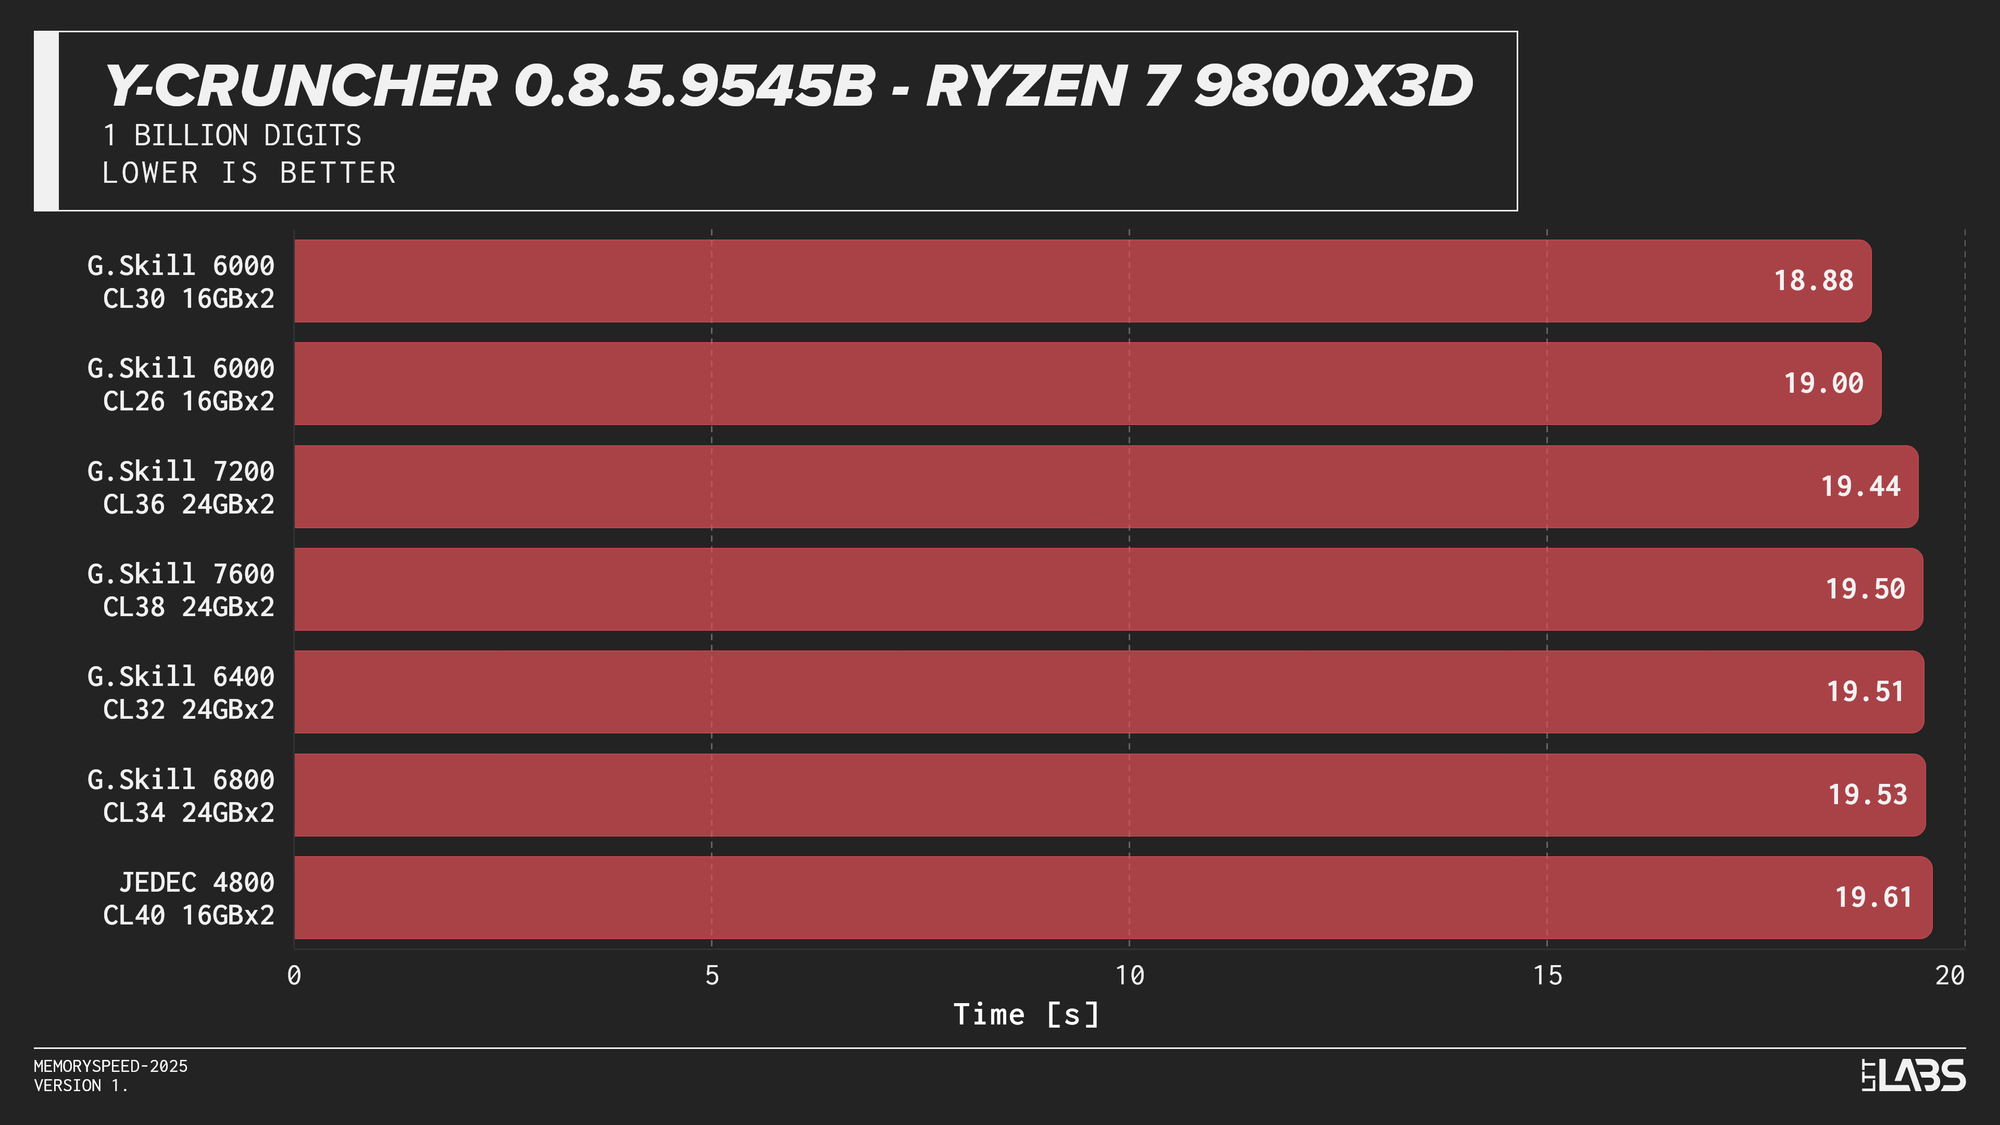
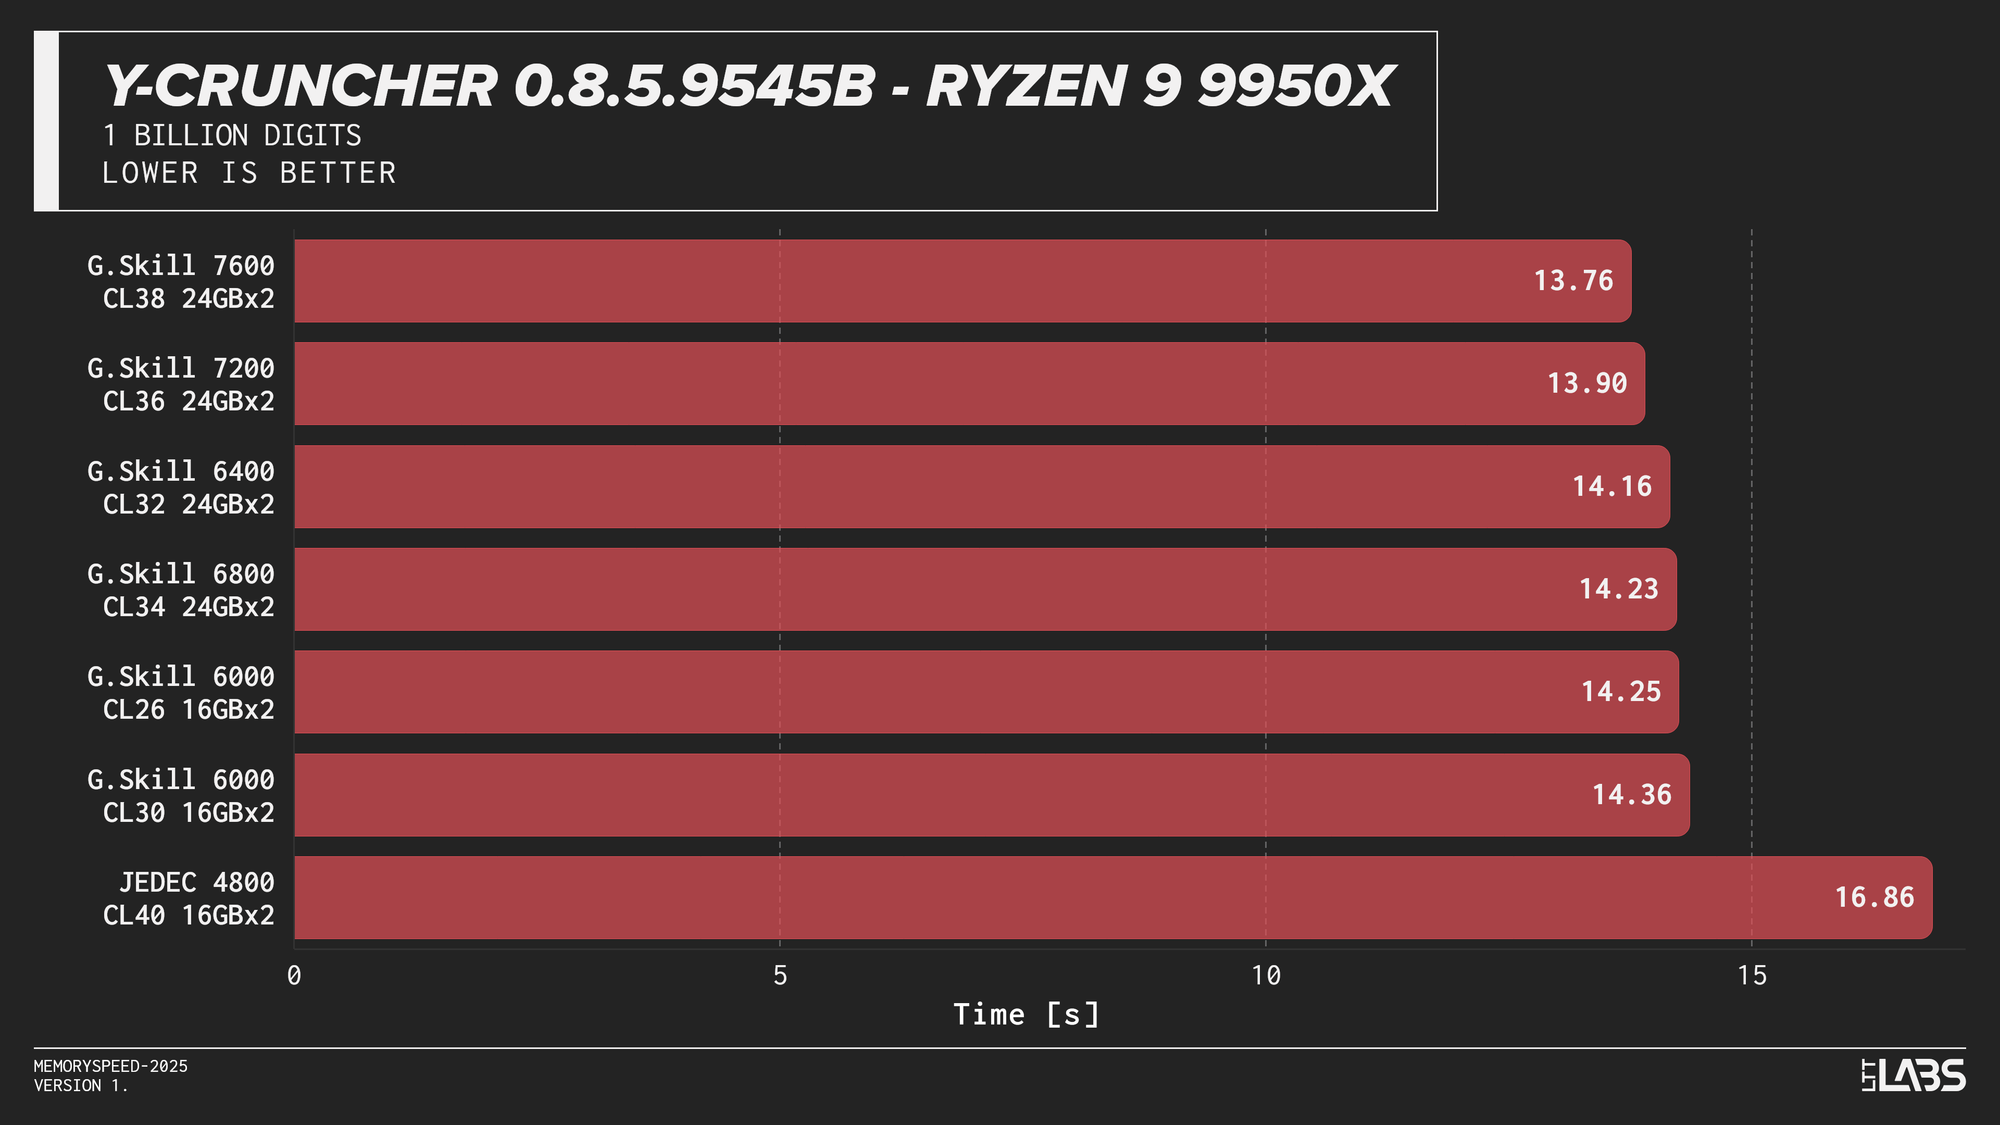
Y-Cruncher 0.8.5
Y-Cruncher showed moderate scaling with memory speed, reflecting its use of large numerical datasets that exceed cache and place sustained demand on memory bandwidth.
JEDEC configurations were consistently the slowest across all platforms. Moving to tuned memory provided measurable improvements, with additional gains at higher speeds on Intel systems. The Ryzen 9 9950X showed near-linear scaling with faster speeds topping the chart, though returns diminished beyond the 6000 MT/s range. The Core Ultra 9 285K also scaled linearly but benefited more noticeably from higher data rates. The Core i9-14900K showed smaller differences once operating above JEDEC until reaching the 8400 MT/s kit, which showed a significant improvement. On the Ryzen 7 9800X3D, the race between kits was much tighter due to the added L3 V‑Cache mitigating memory pressure.
Gaming
To evaluate gaming performance, results are grouped into separate sections for 1080p rasterization, 2160p rasterization, Ray Tracing, and DLSS. Each section includes one carousel per CPU showing results across the same set of titles:
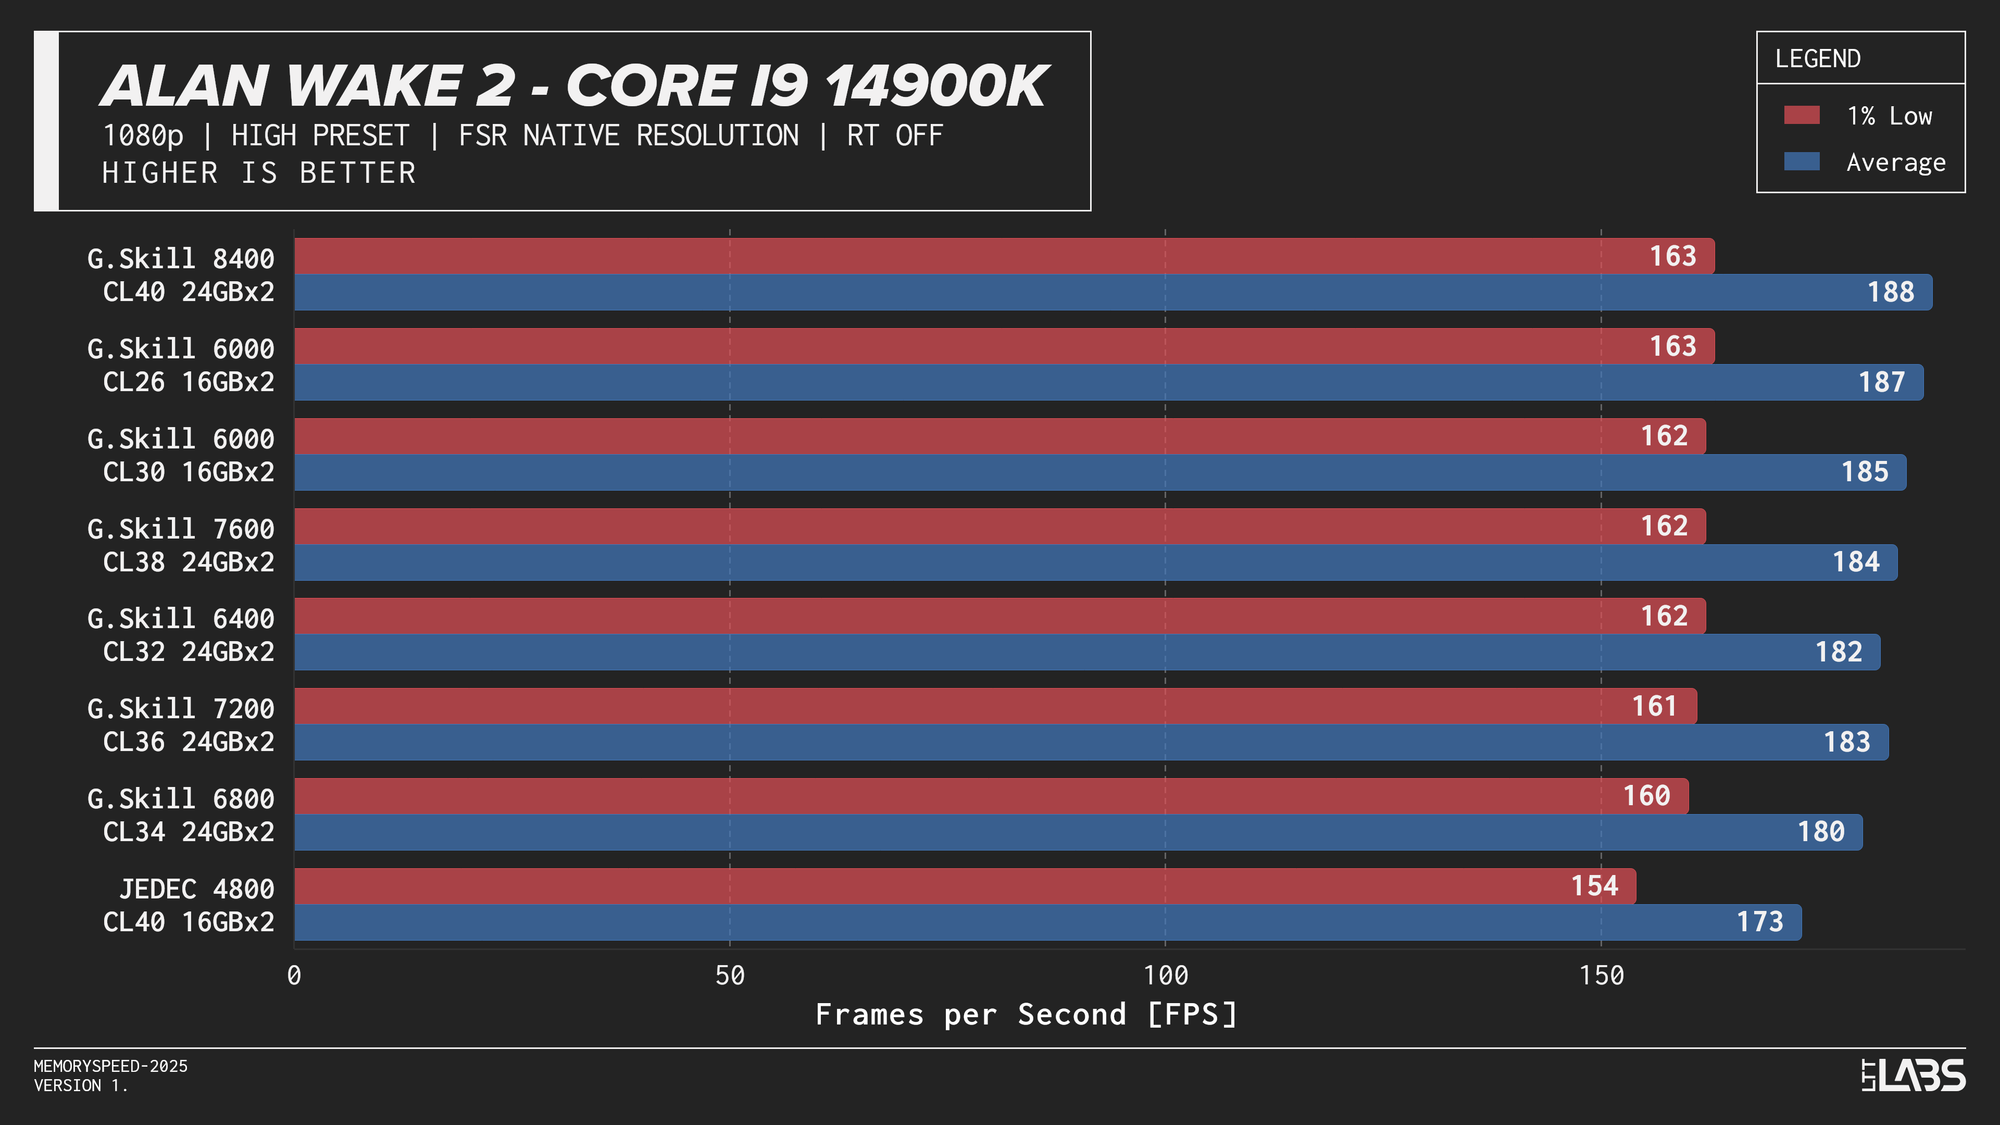
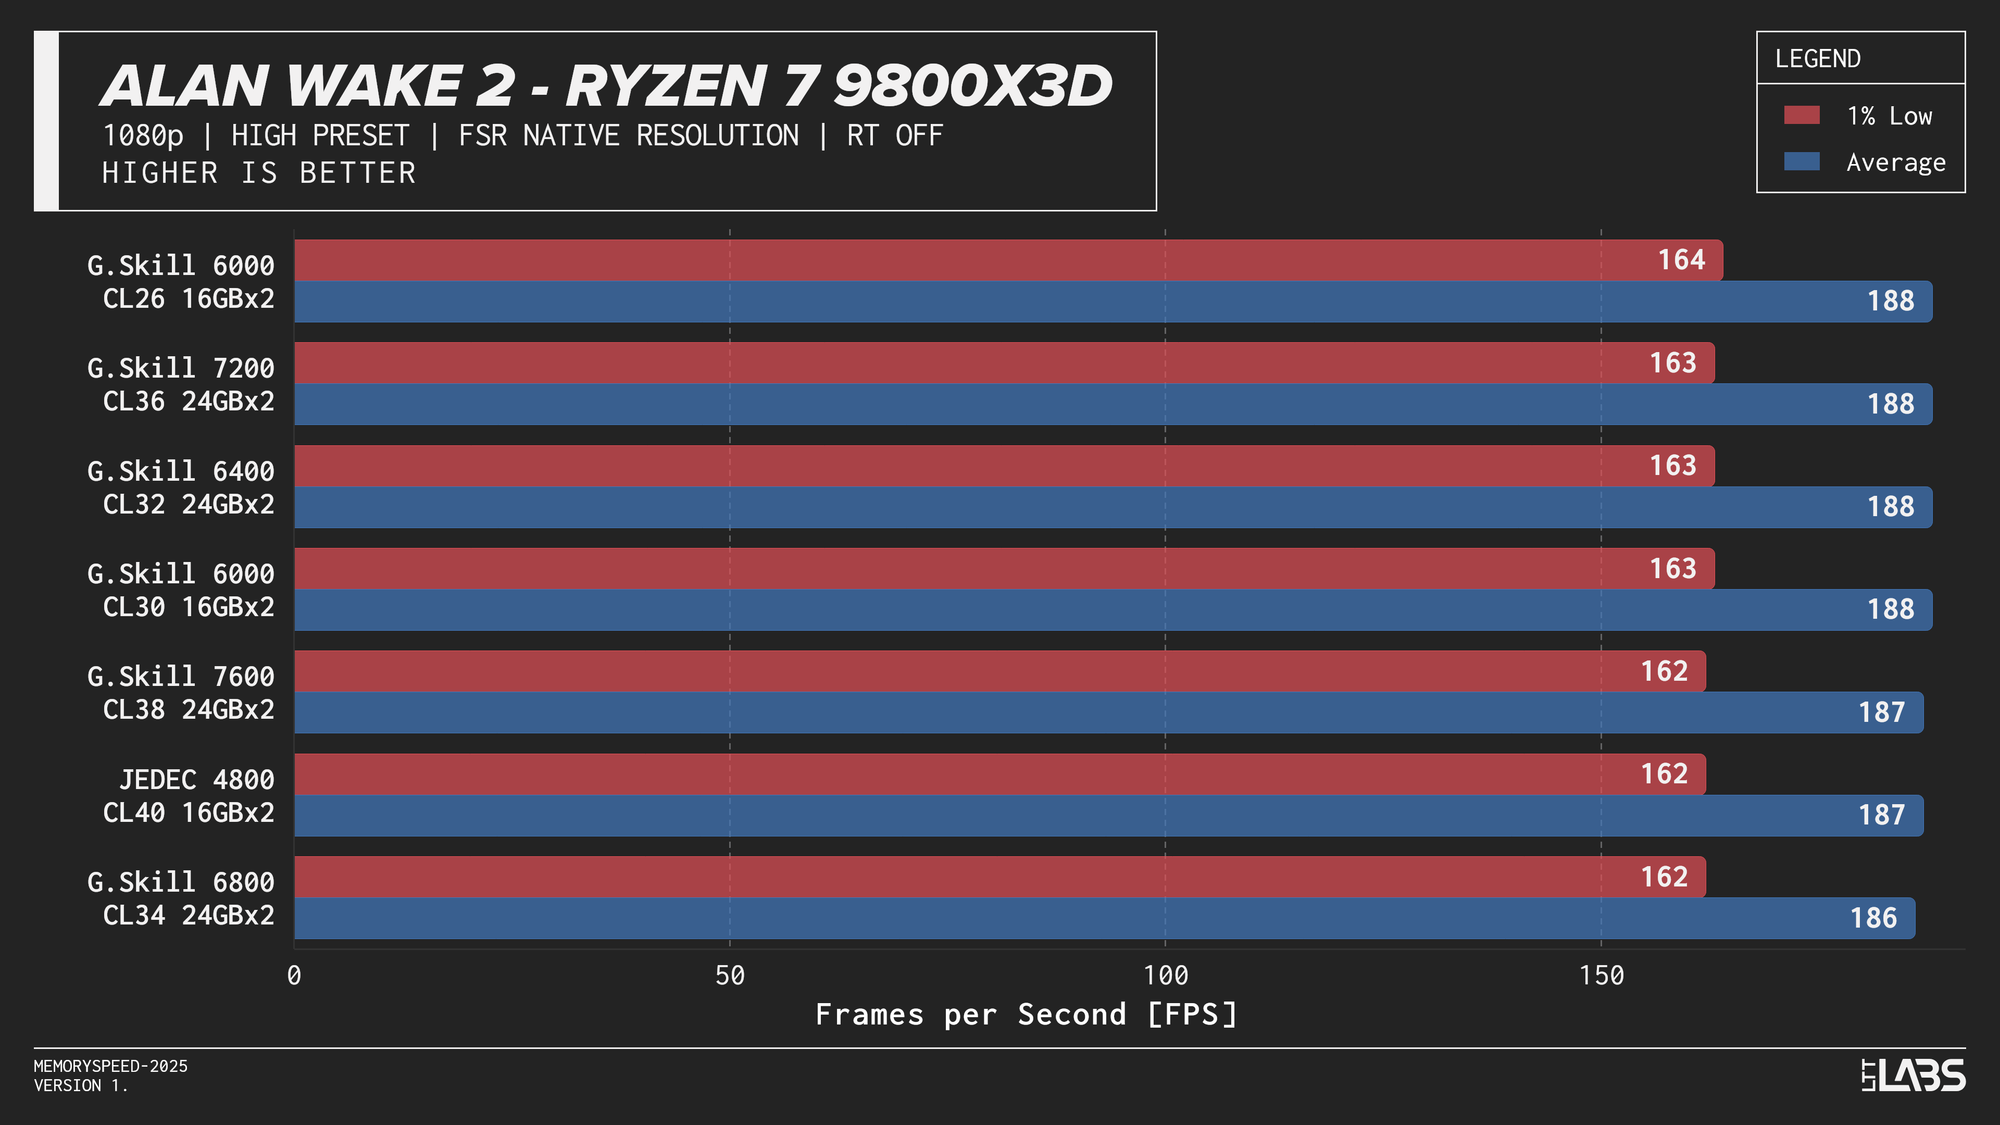
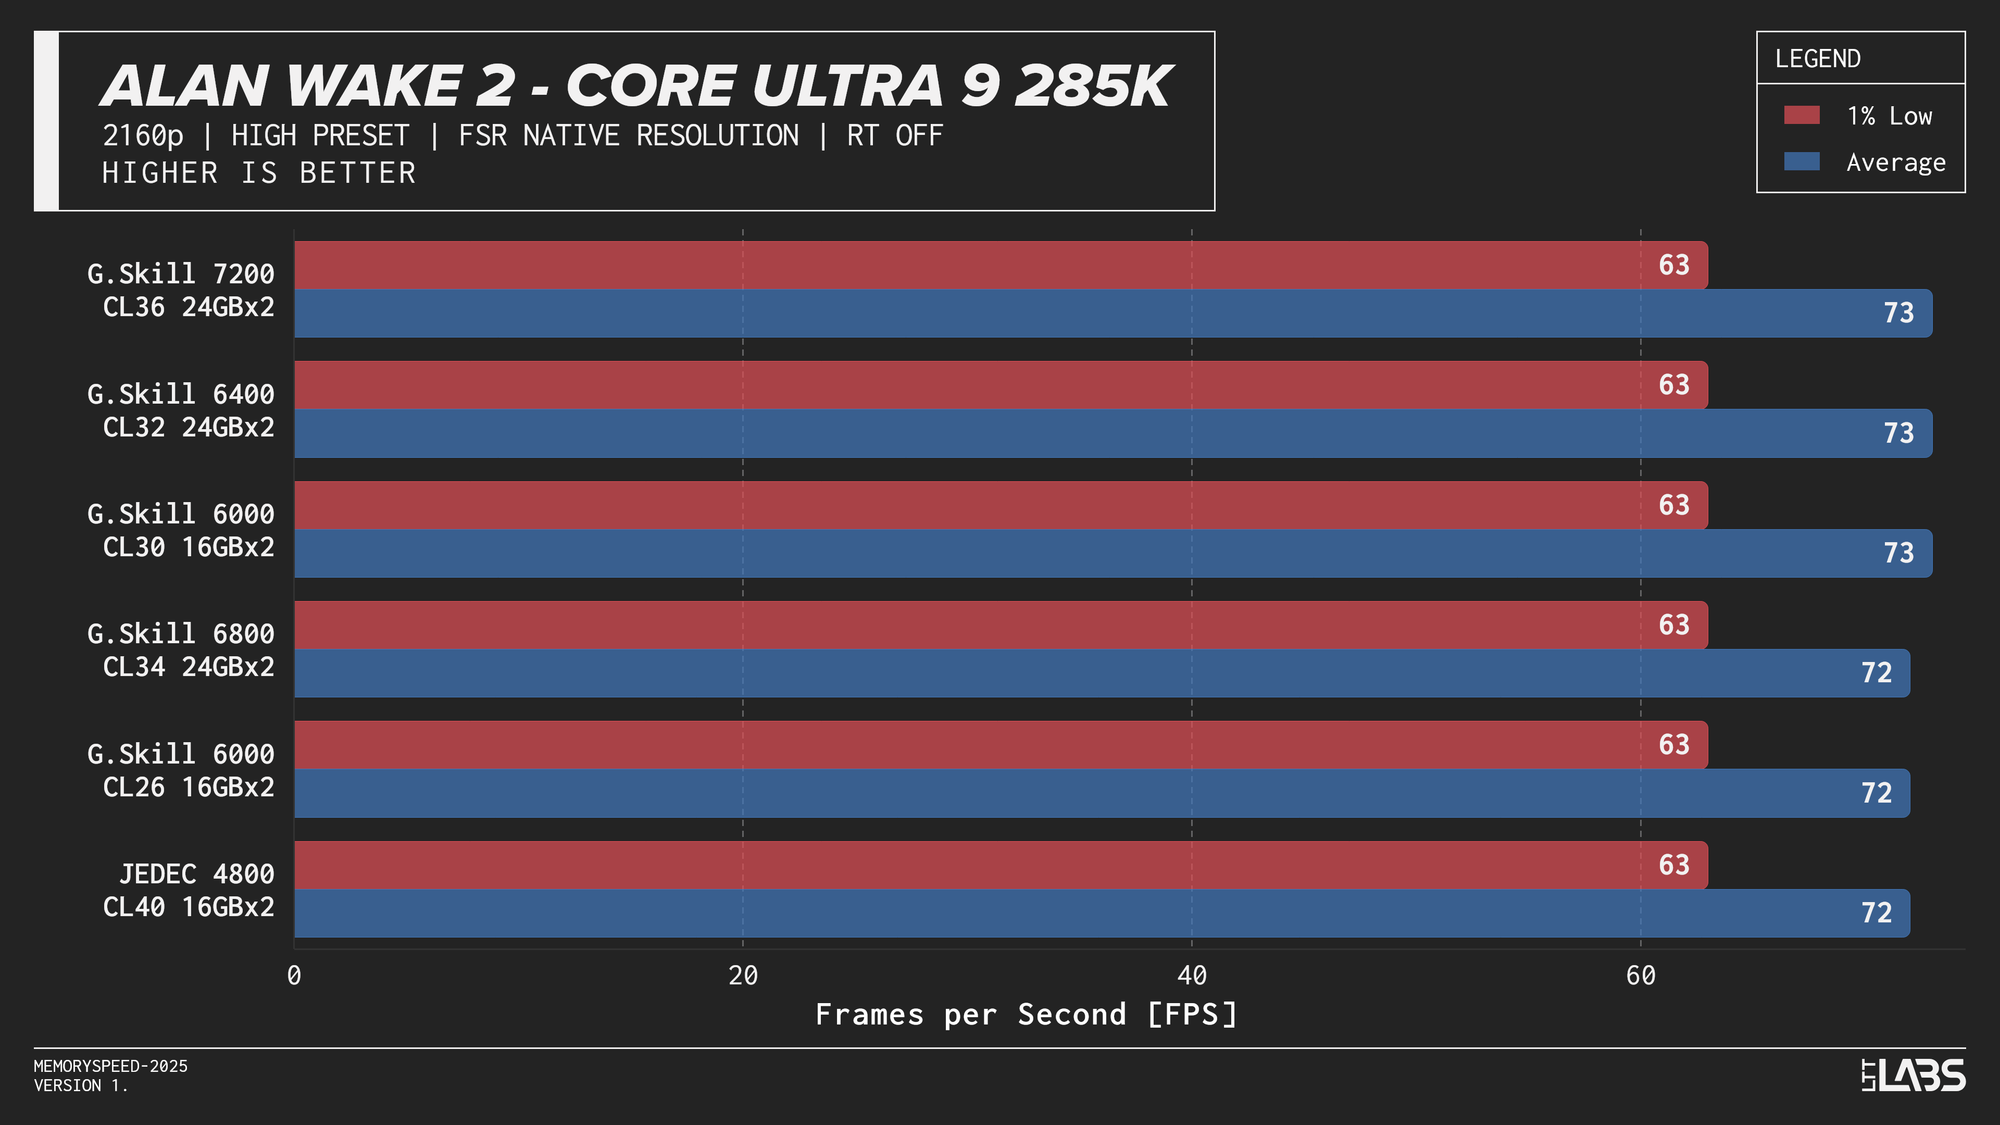
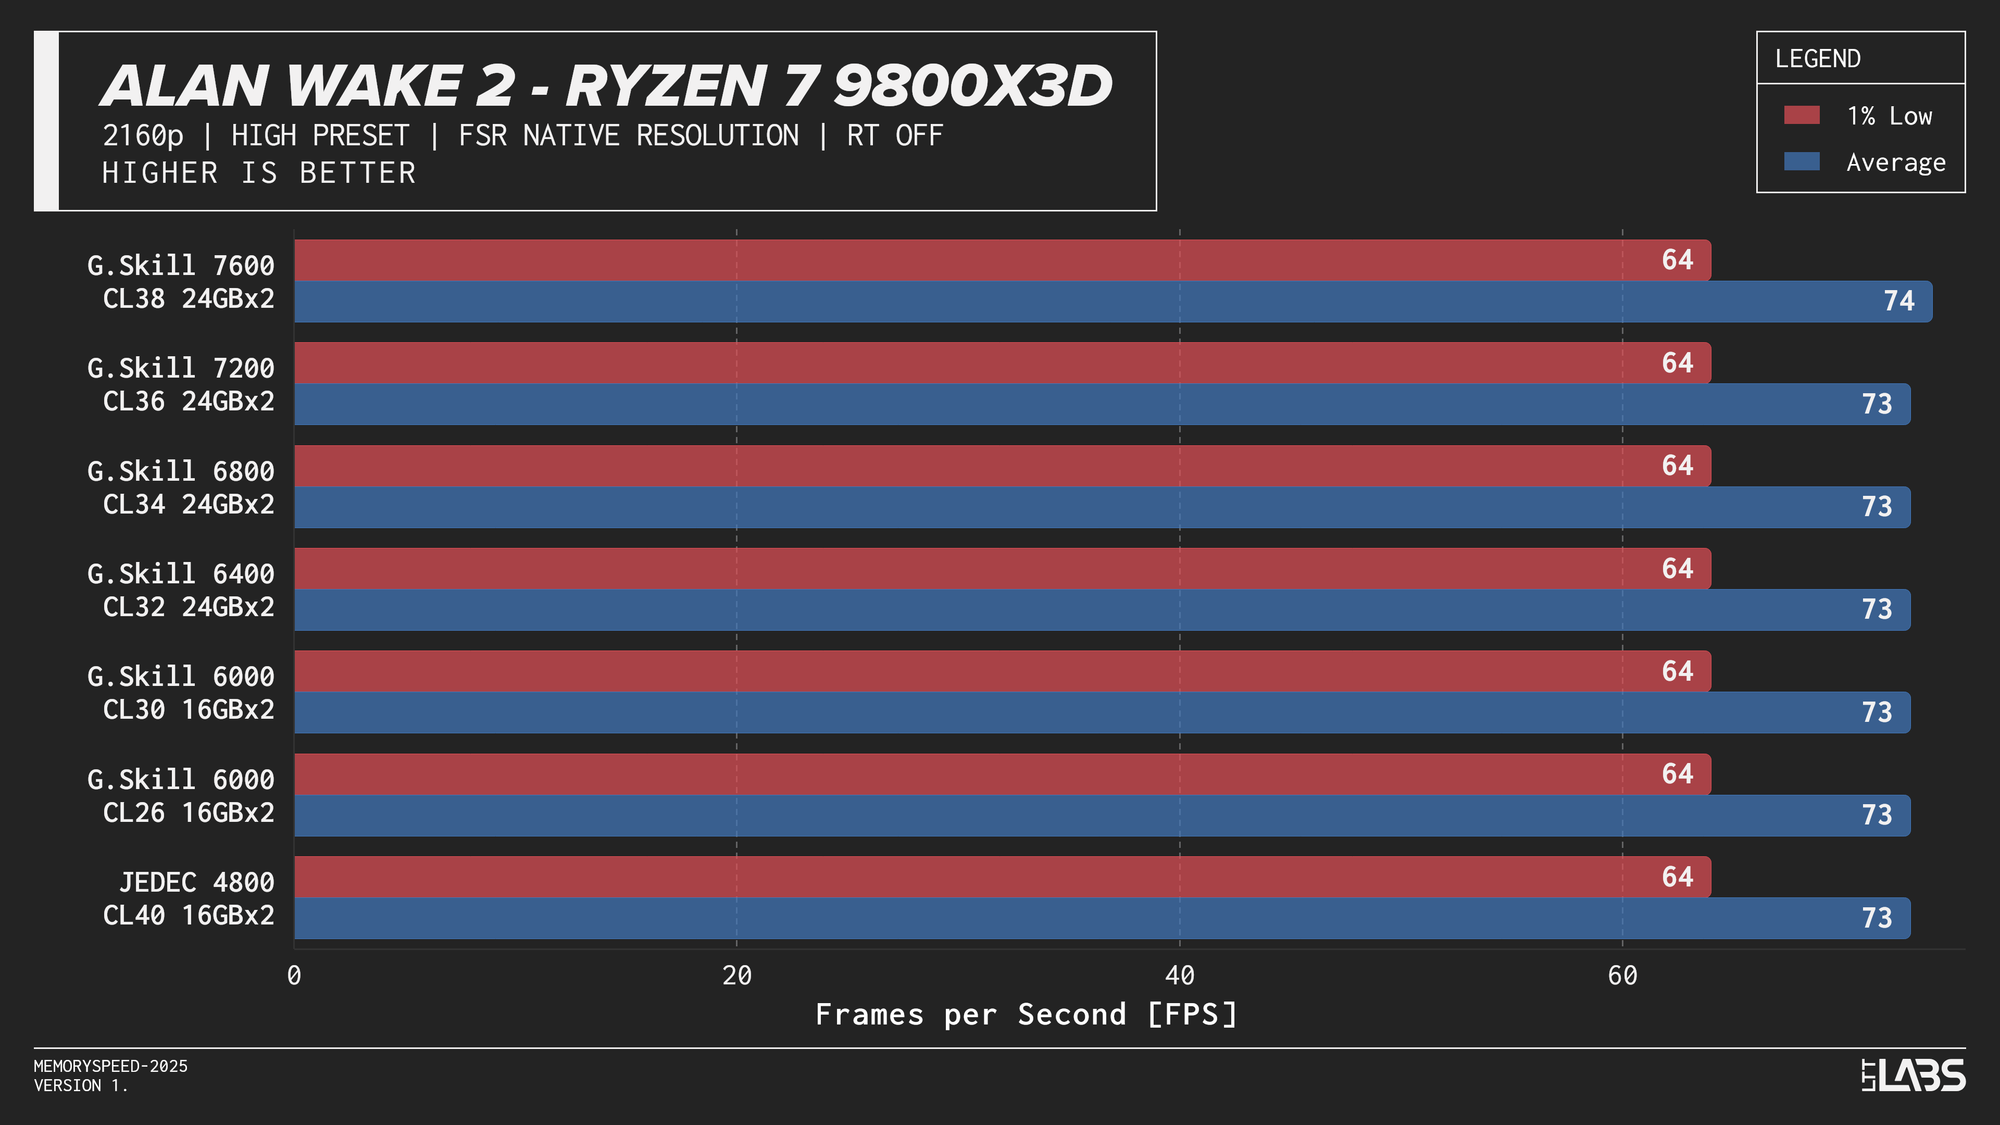
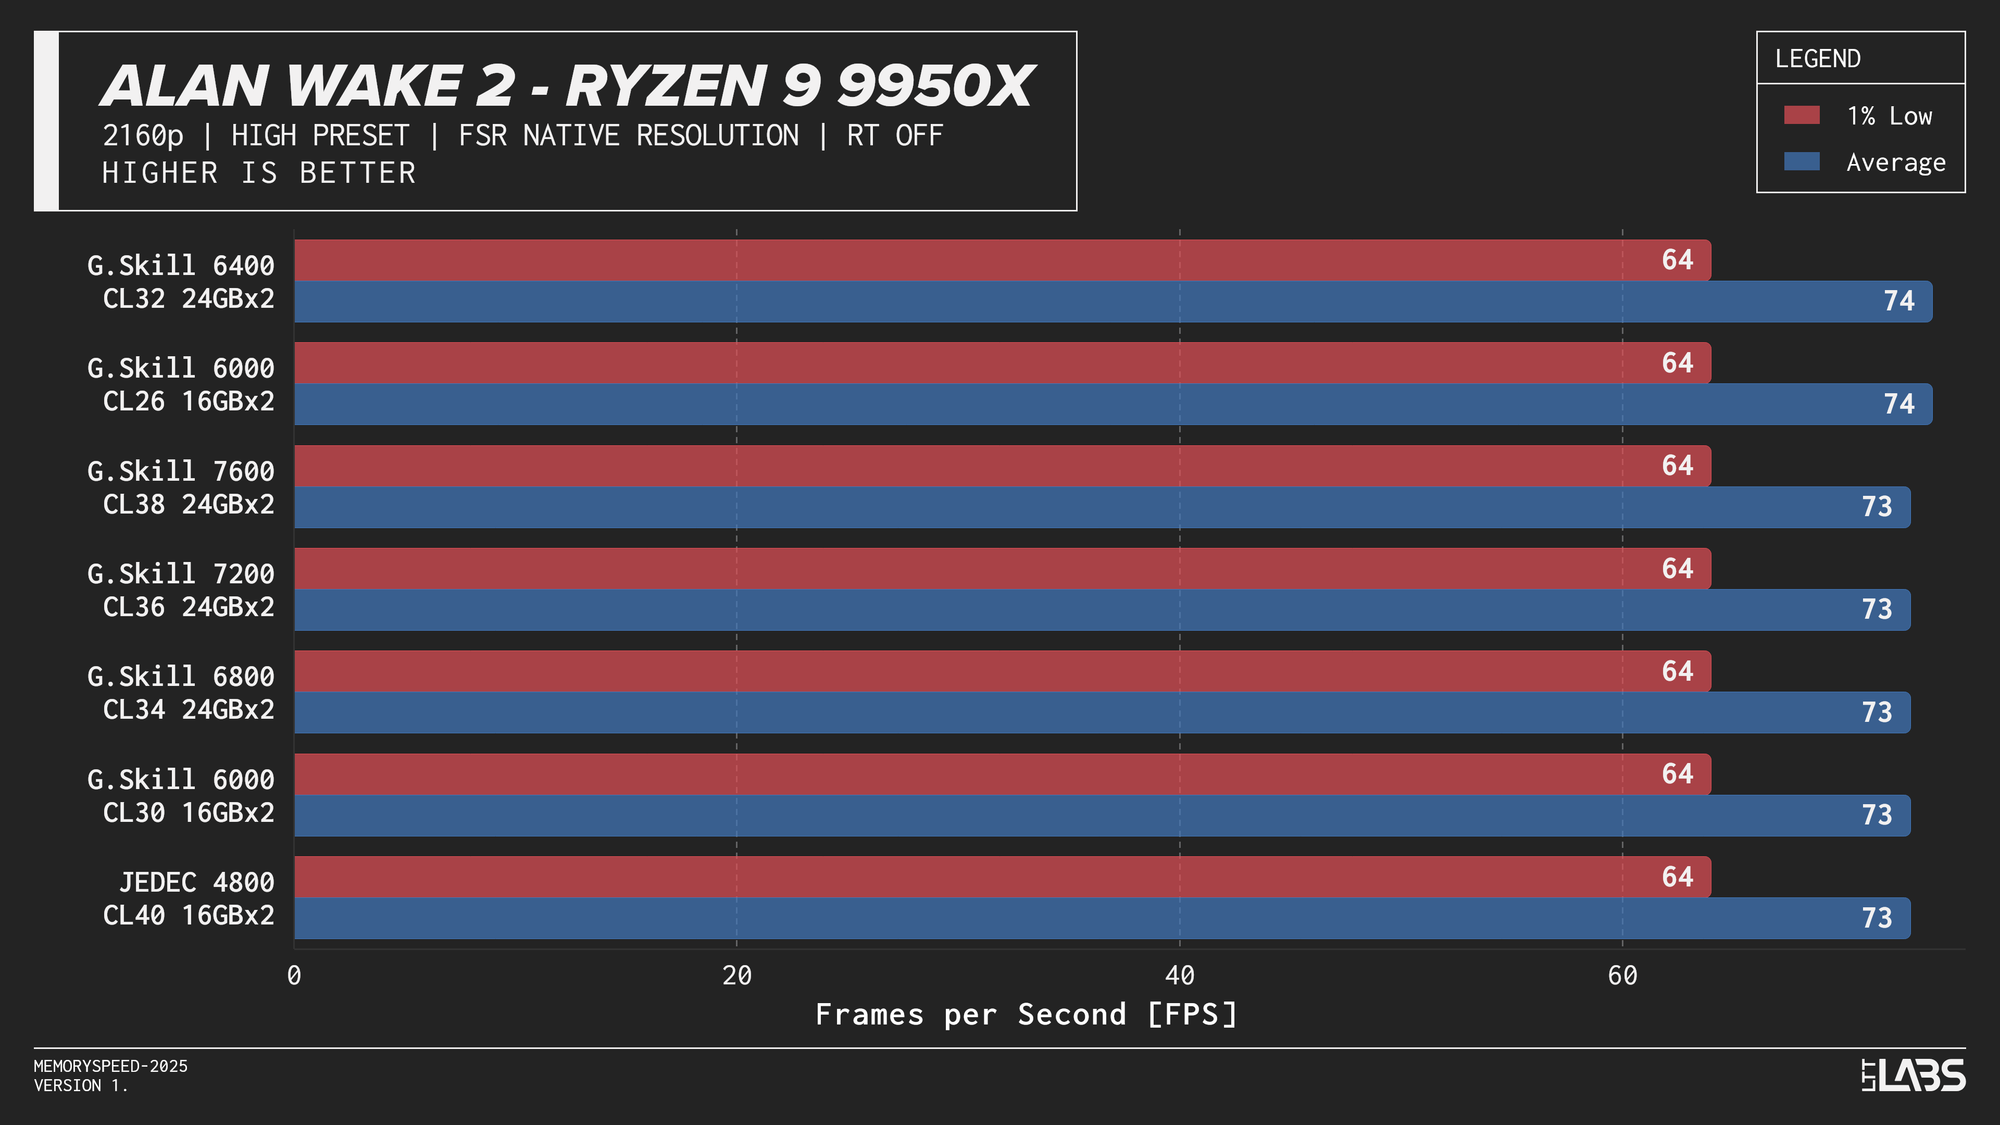
- Alan Wake 2: 1080p, 2160p, 2160p DLSS
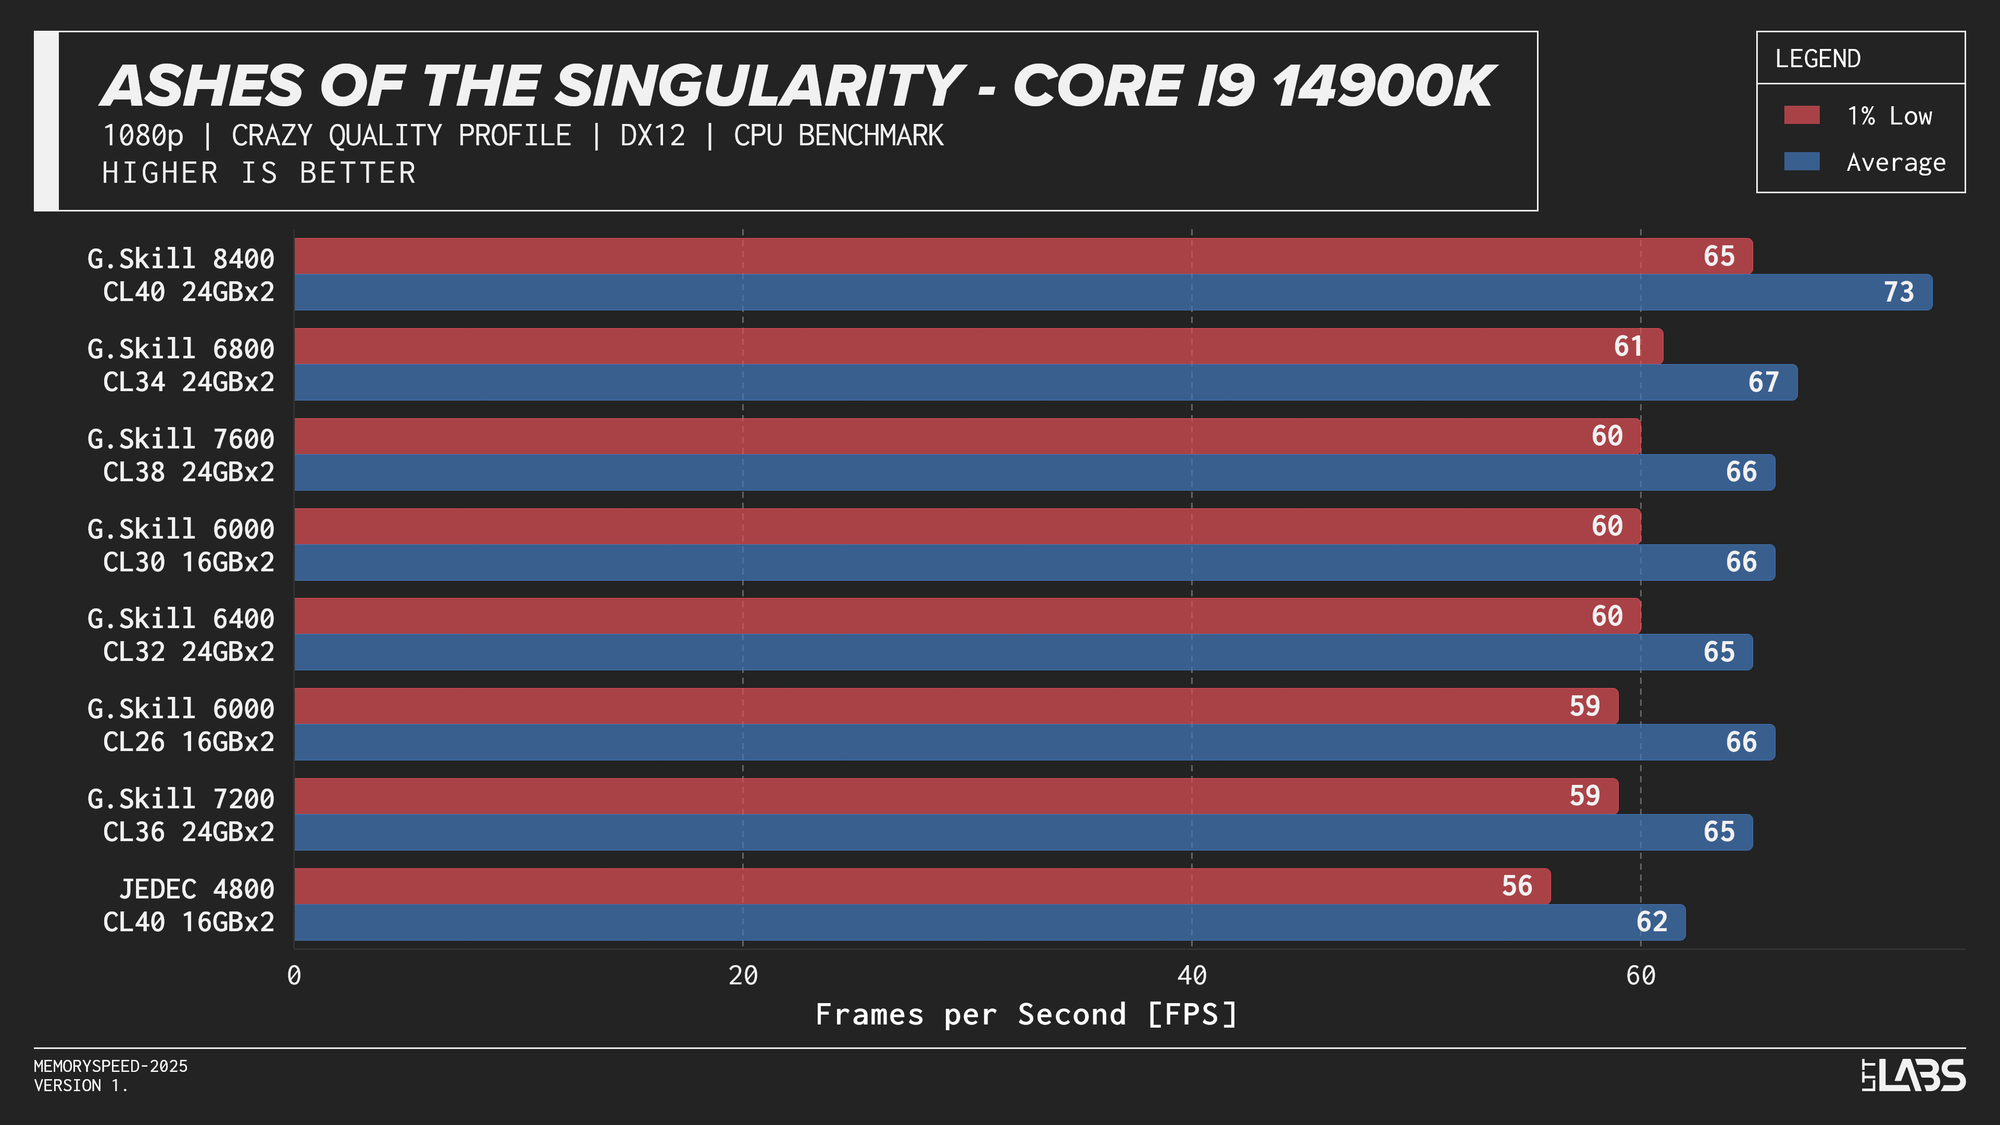
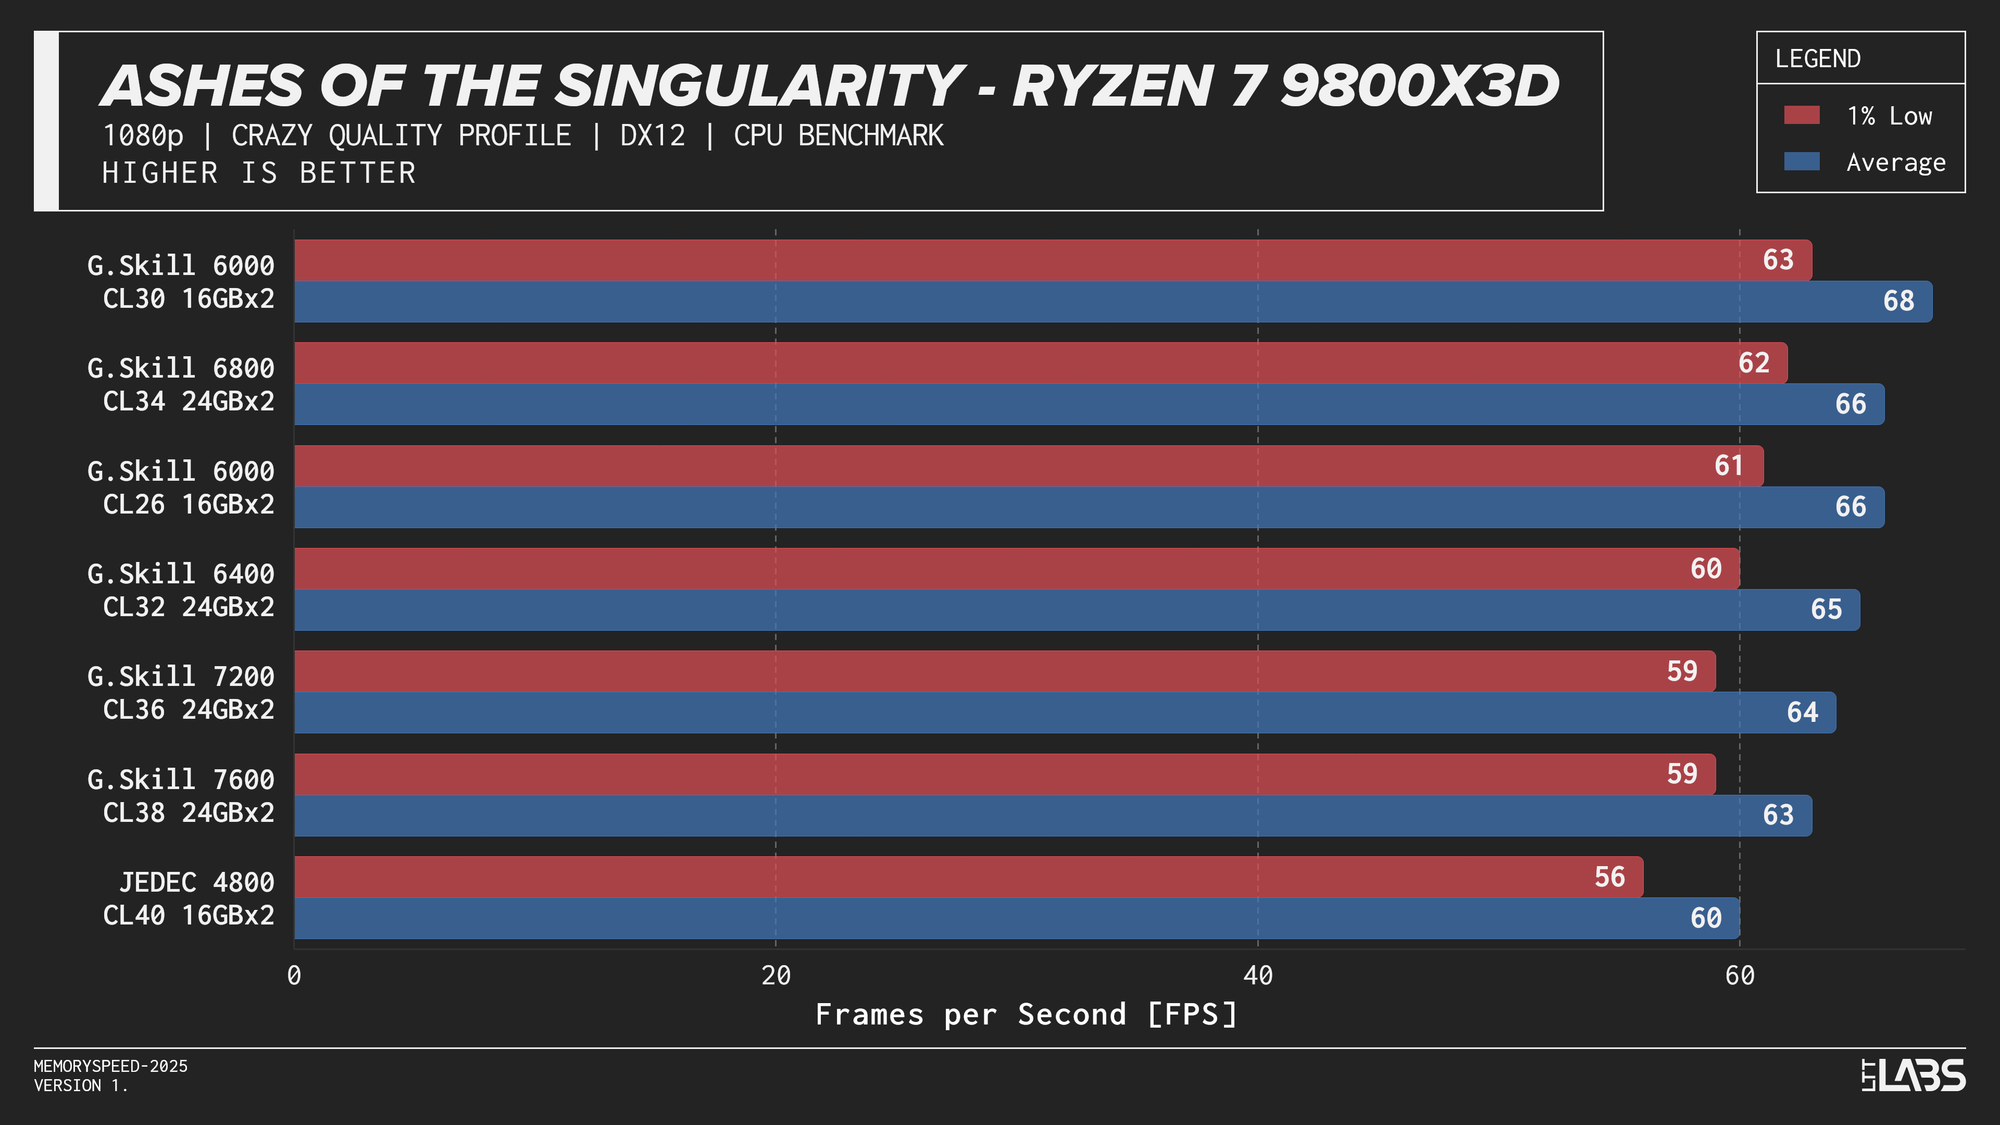
- Ashes of the Singularity: Escalation: 1080p
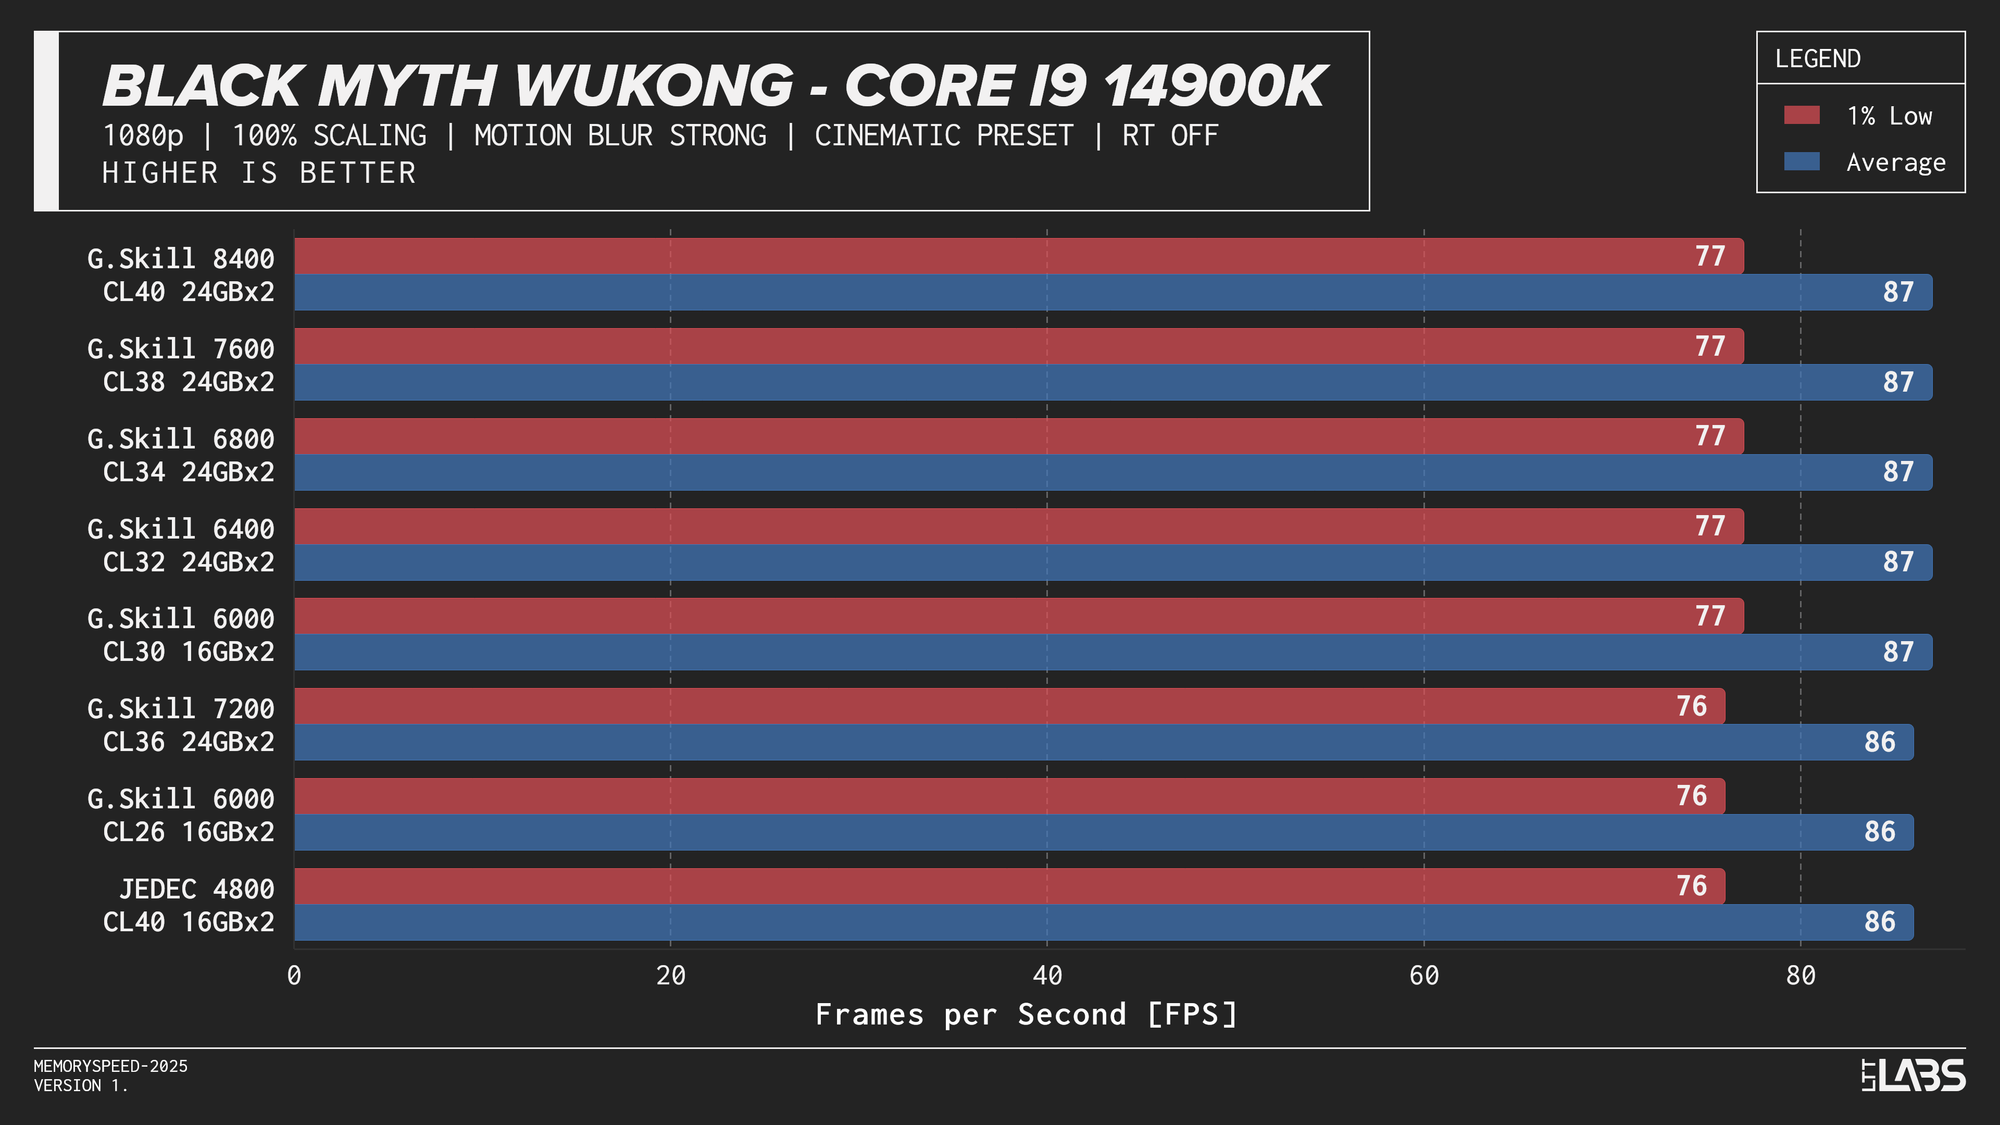
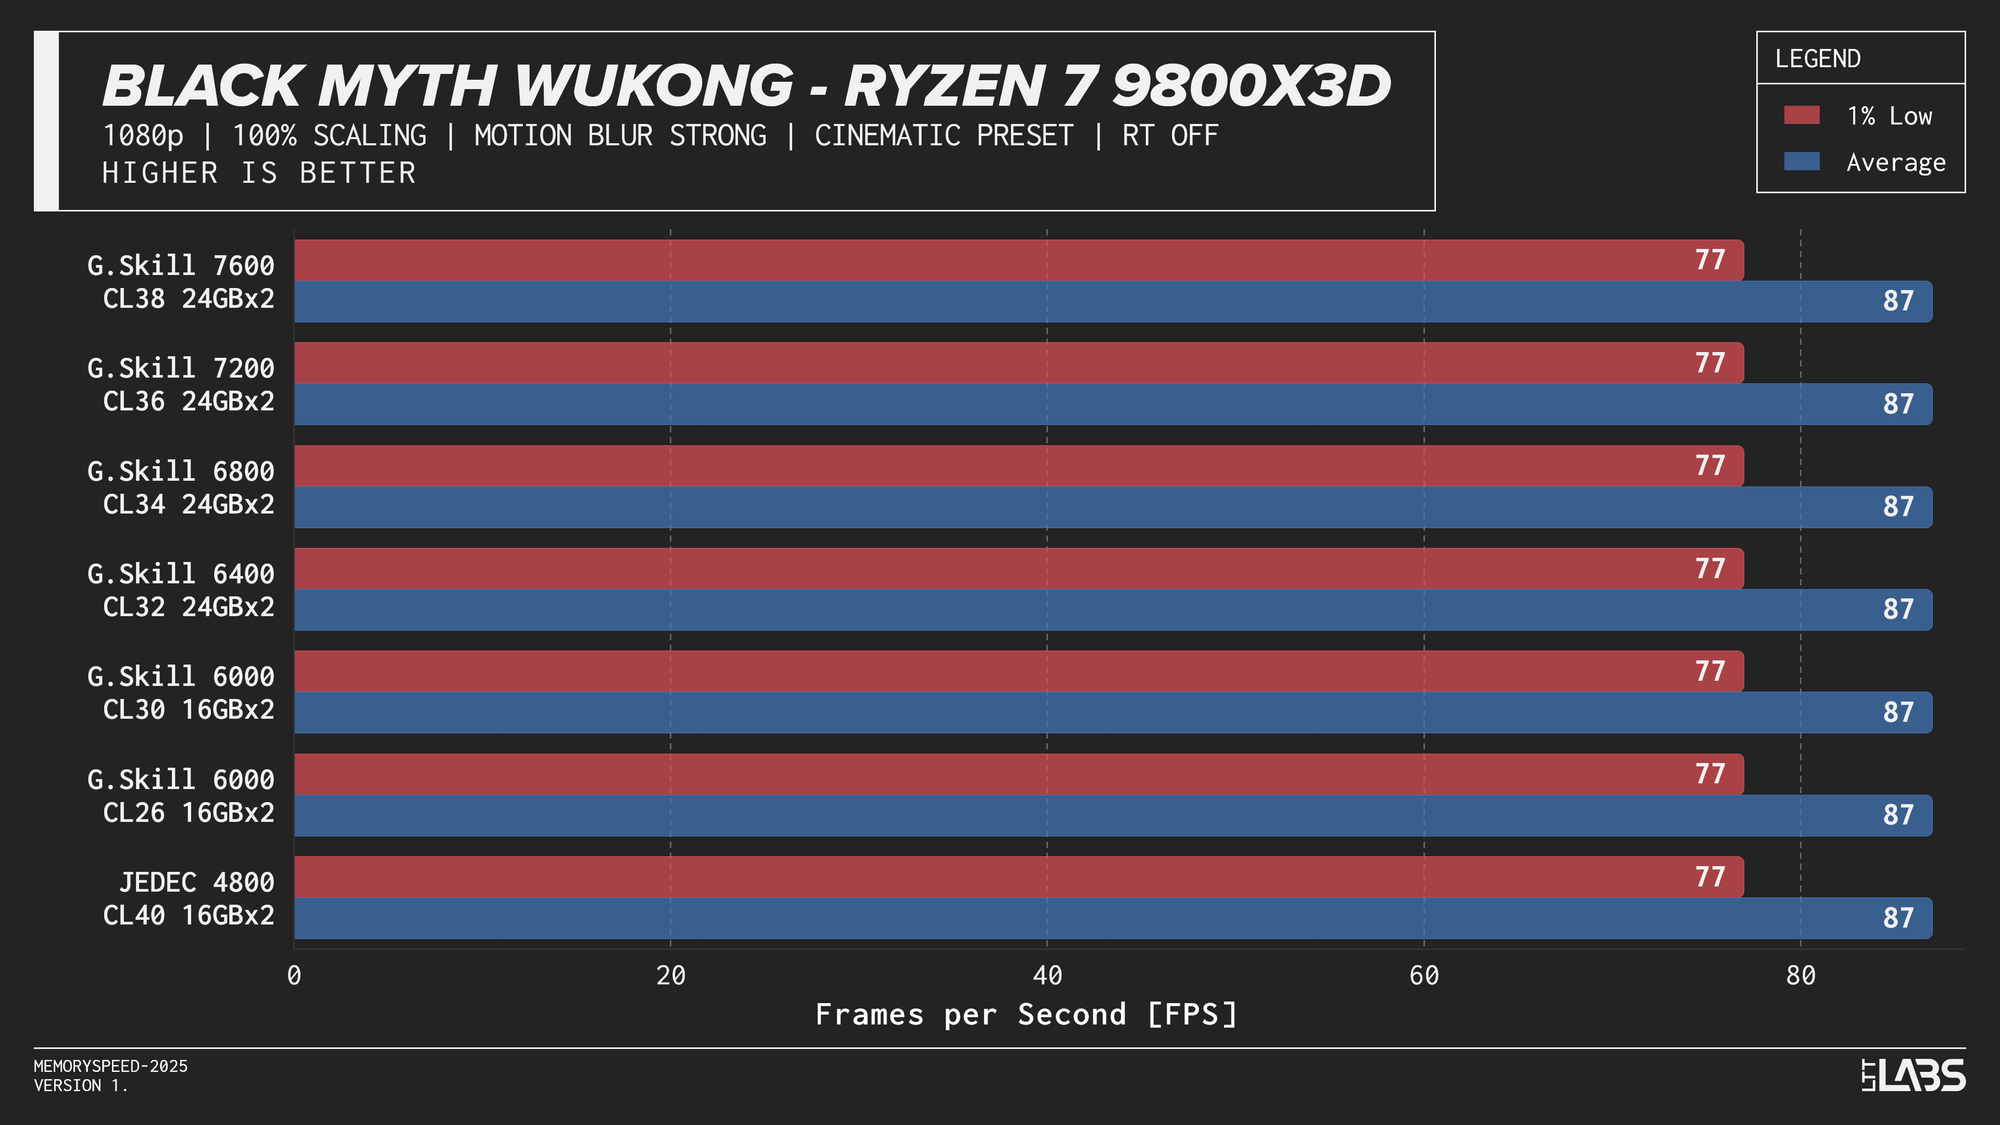
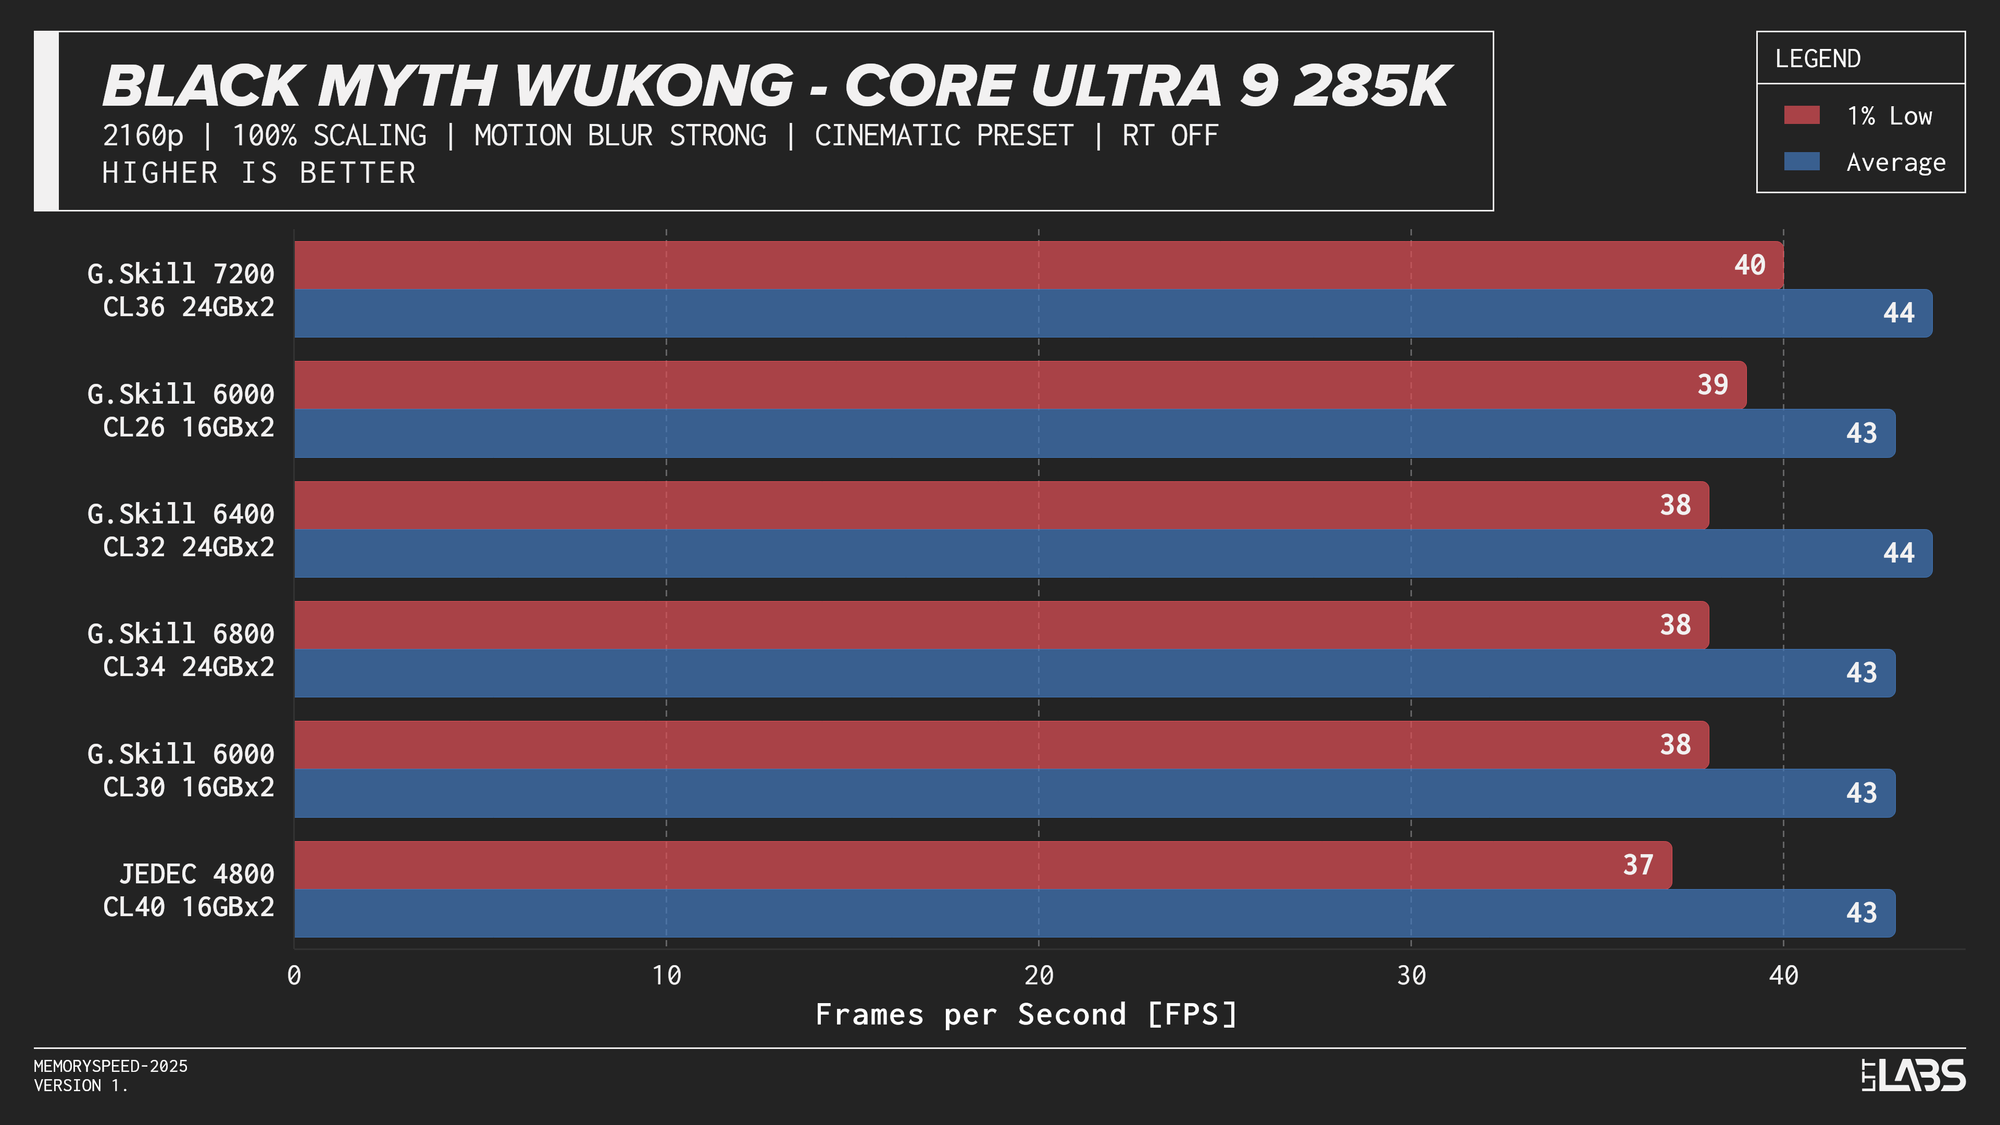
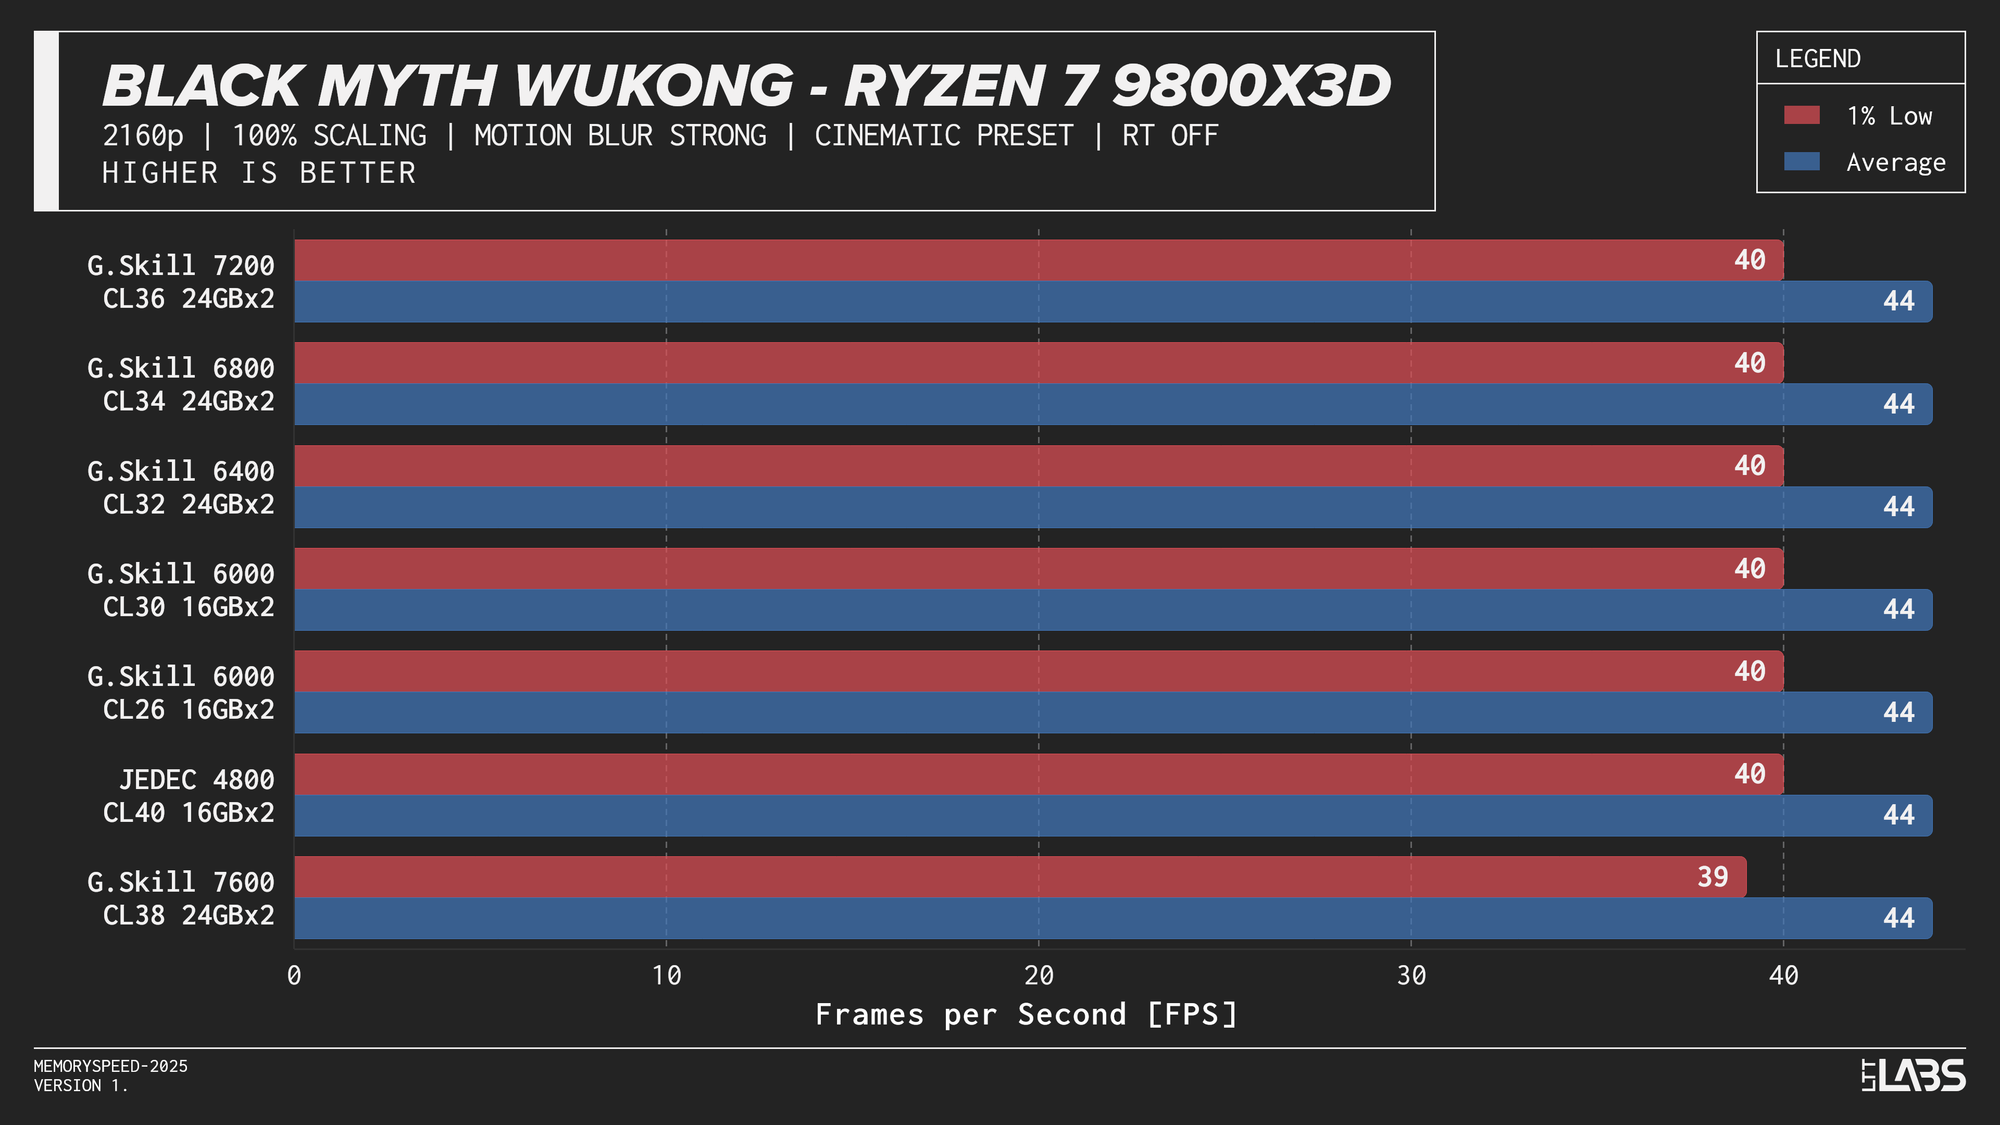
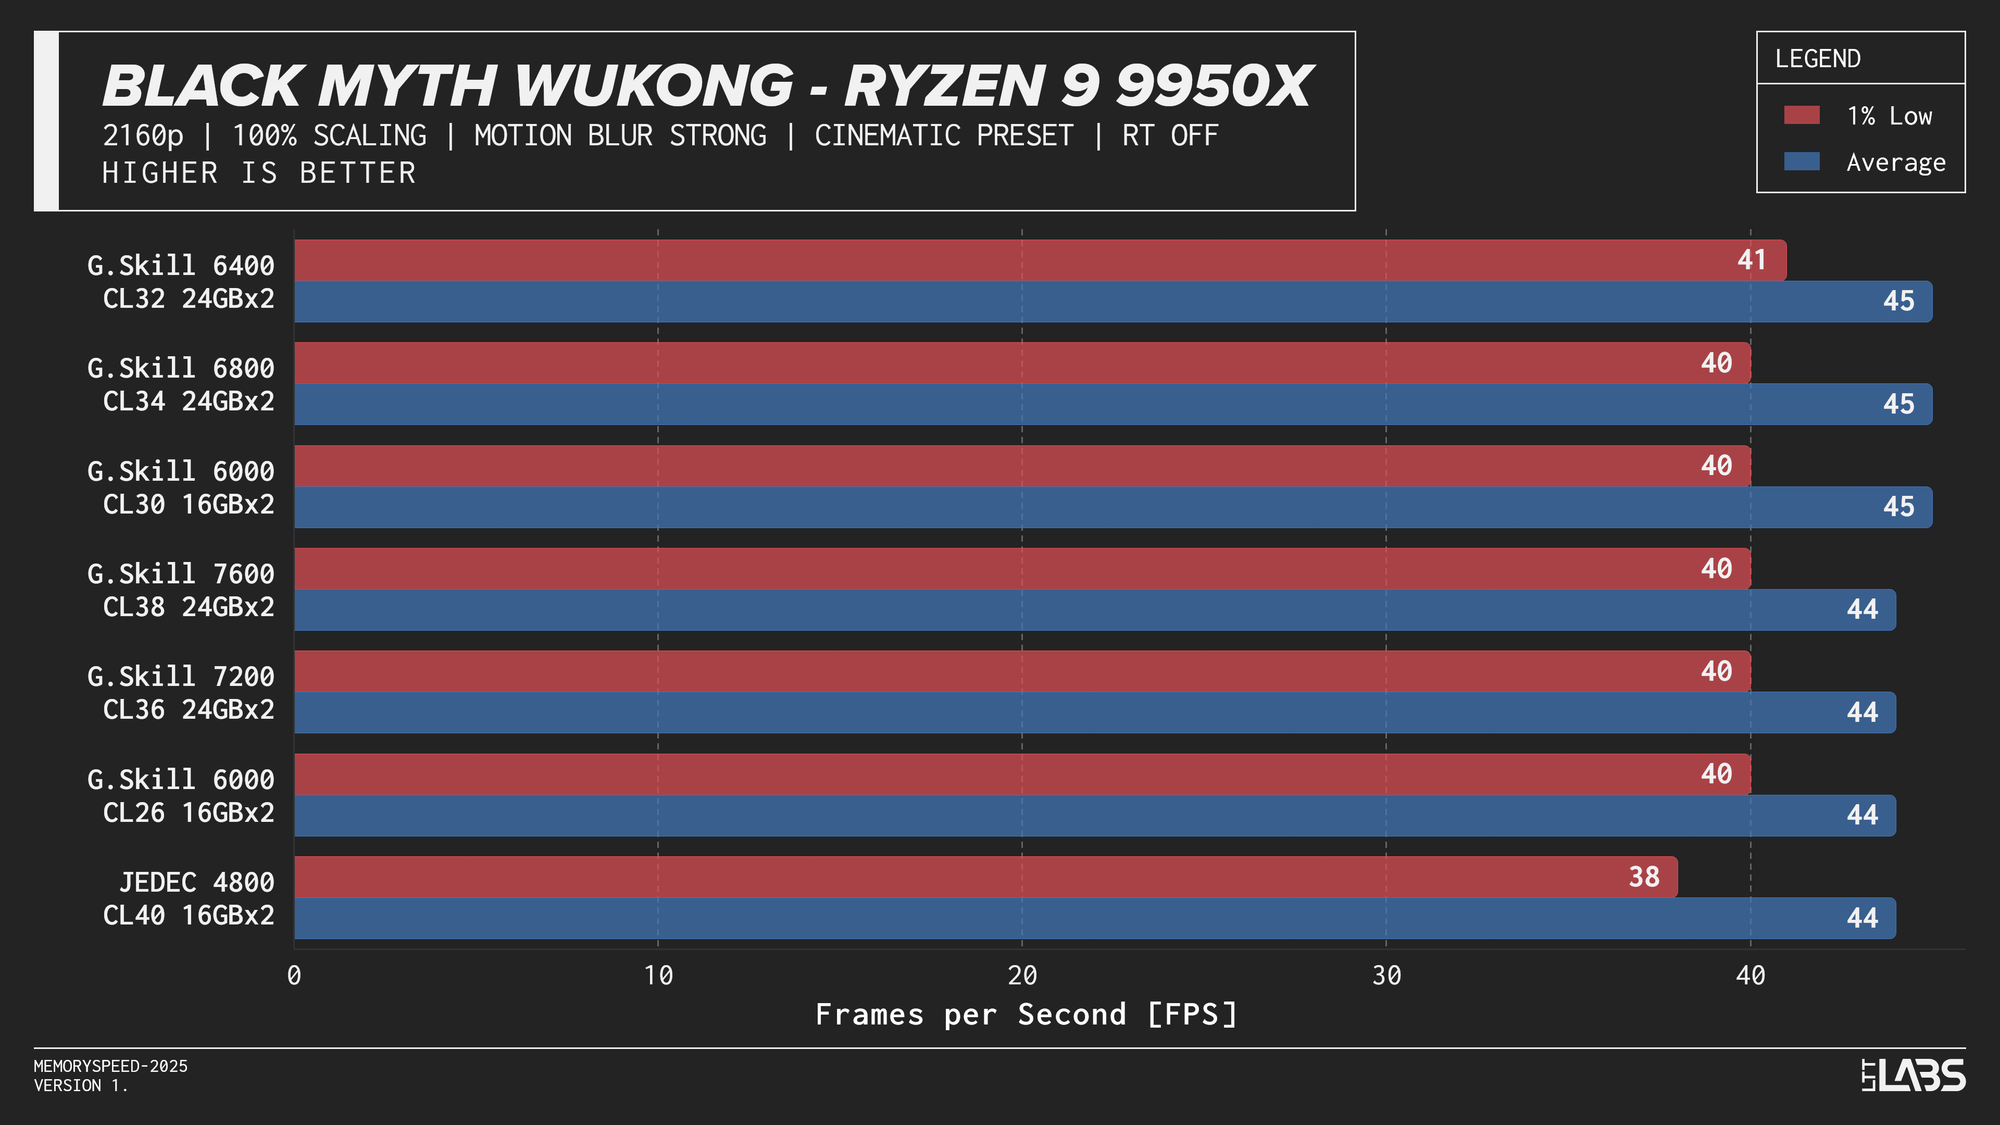
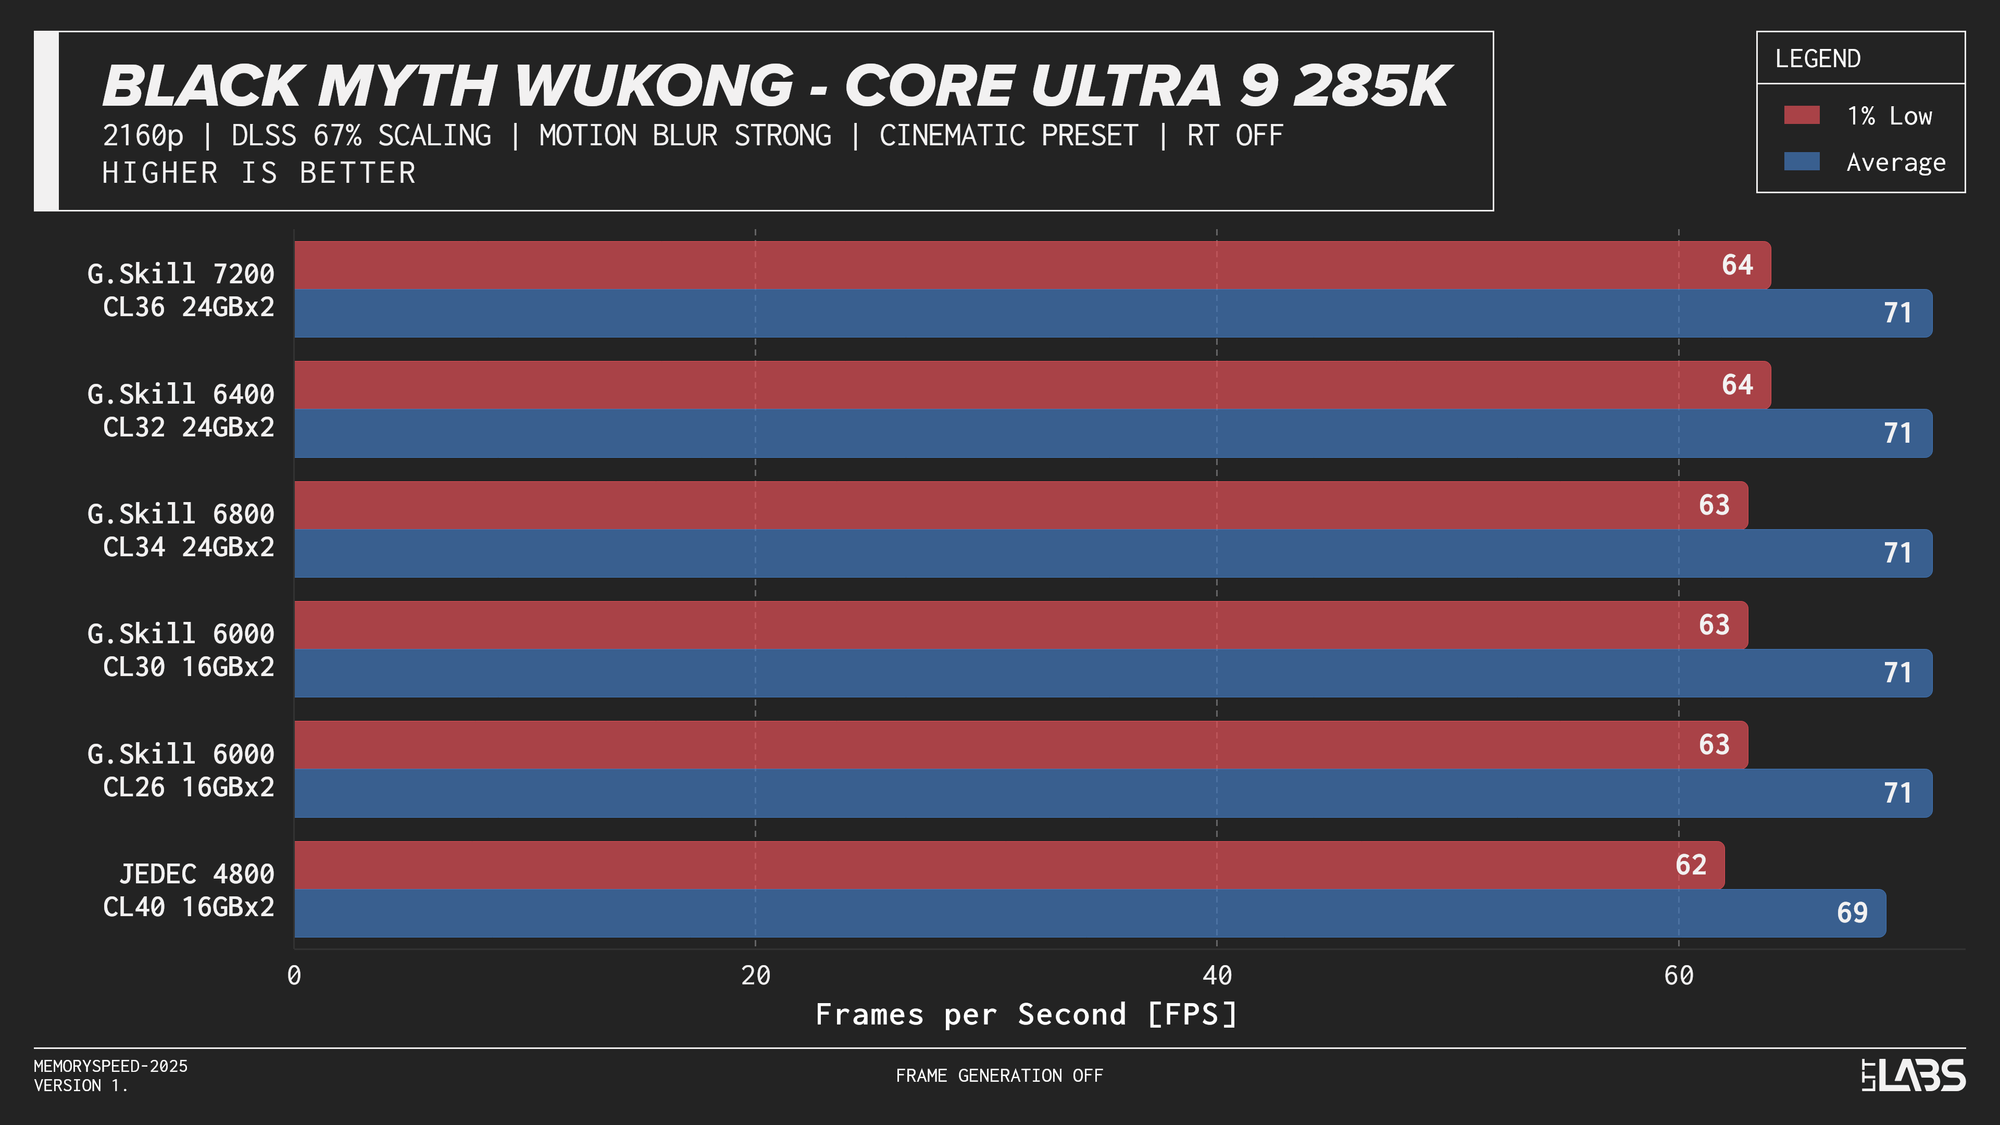
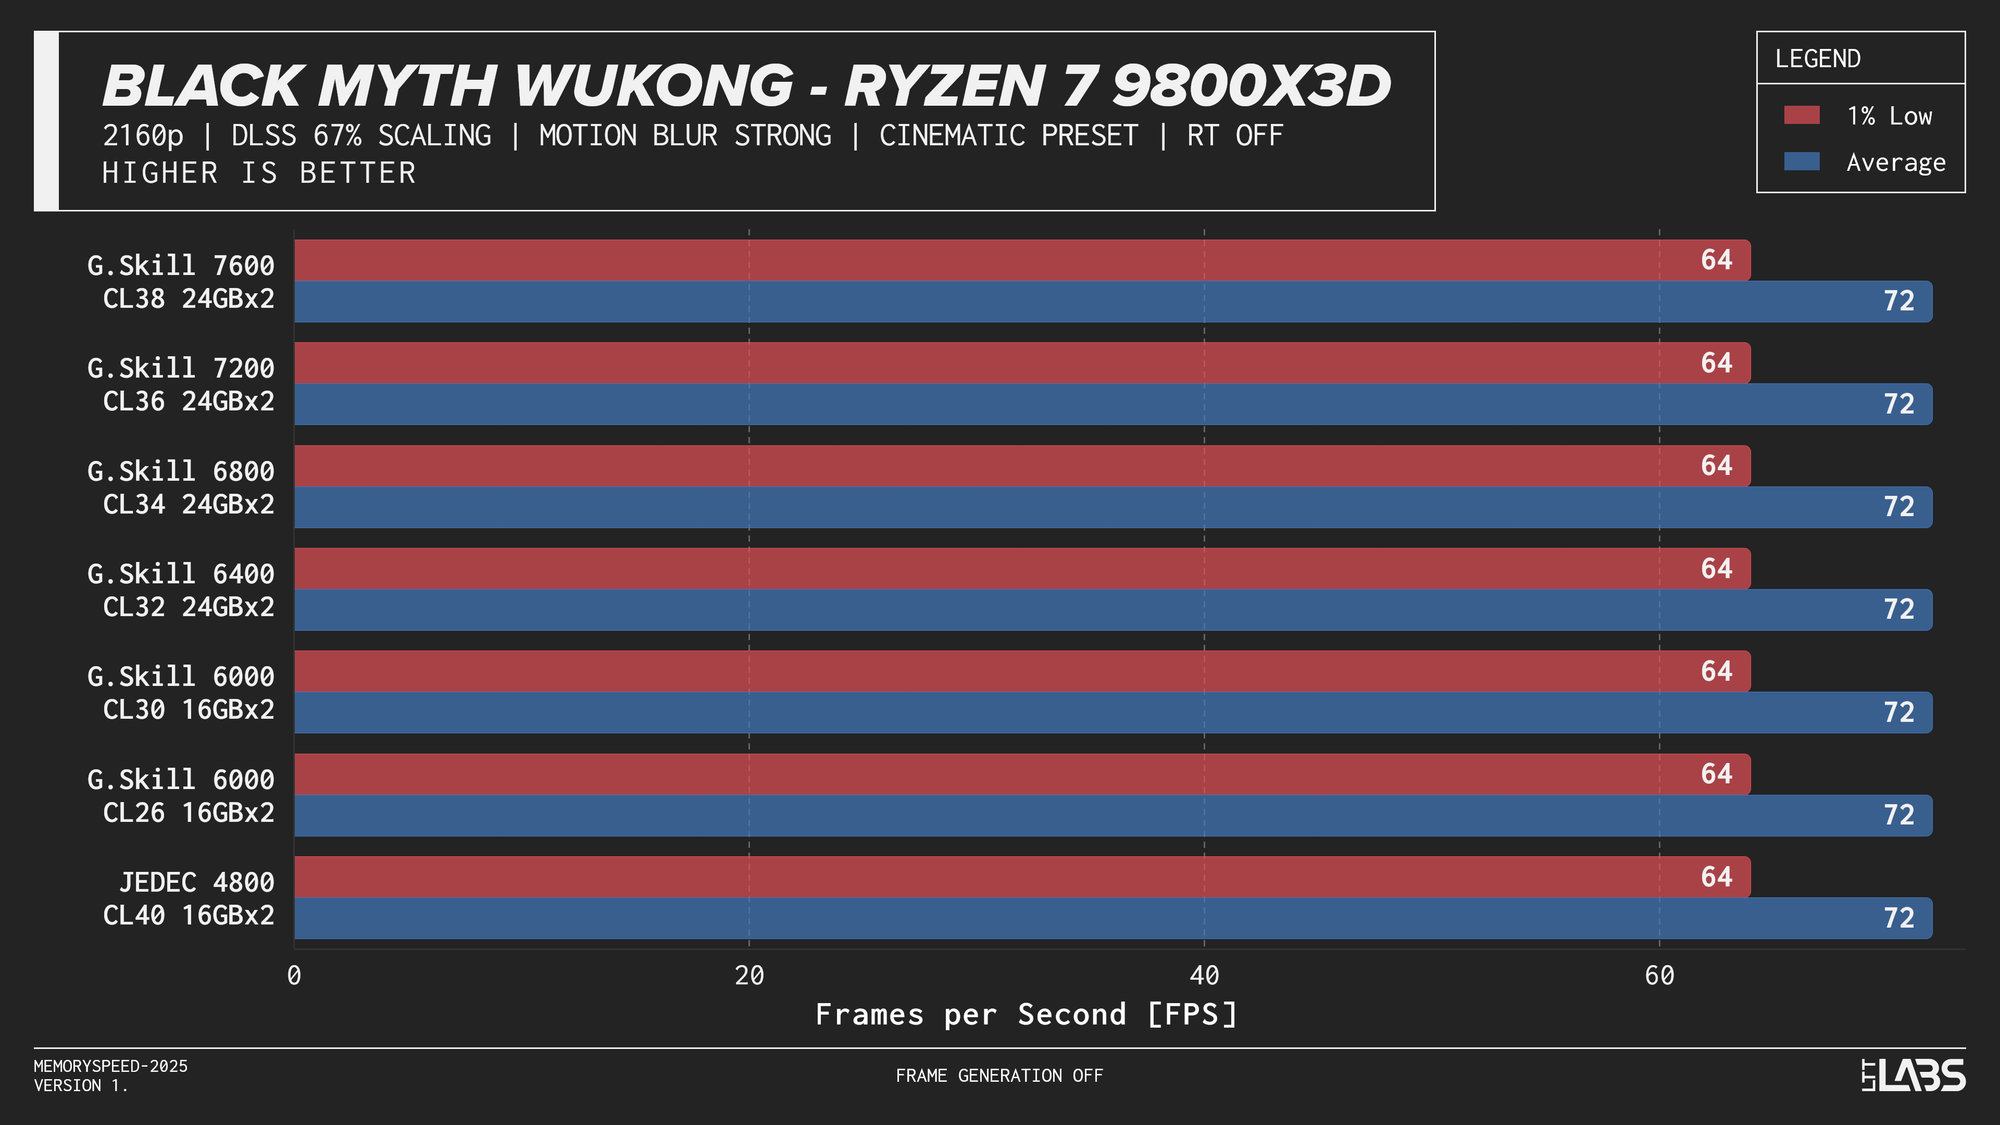
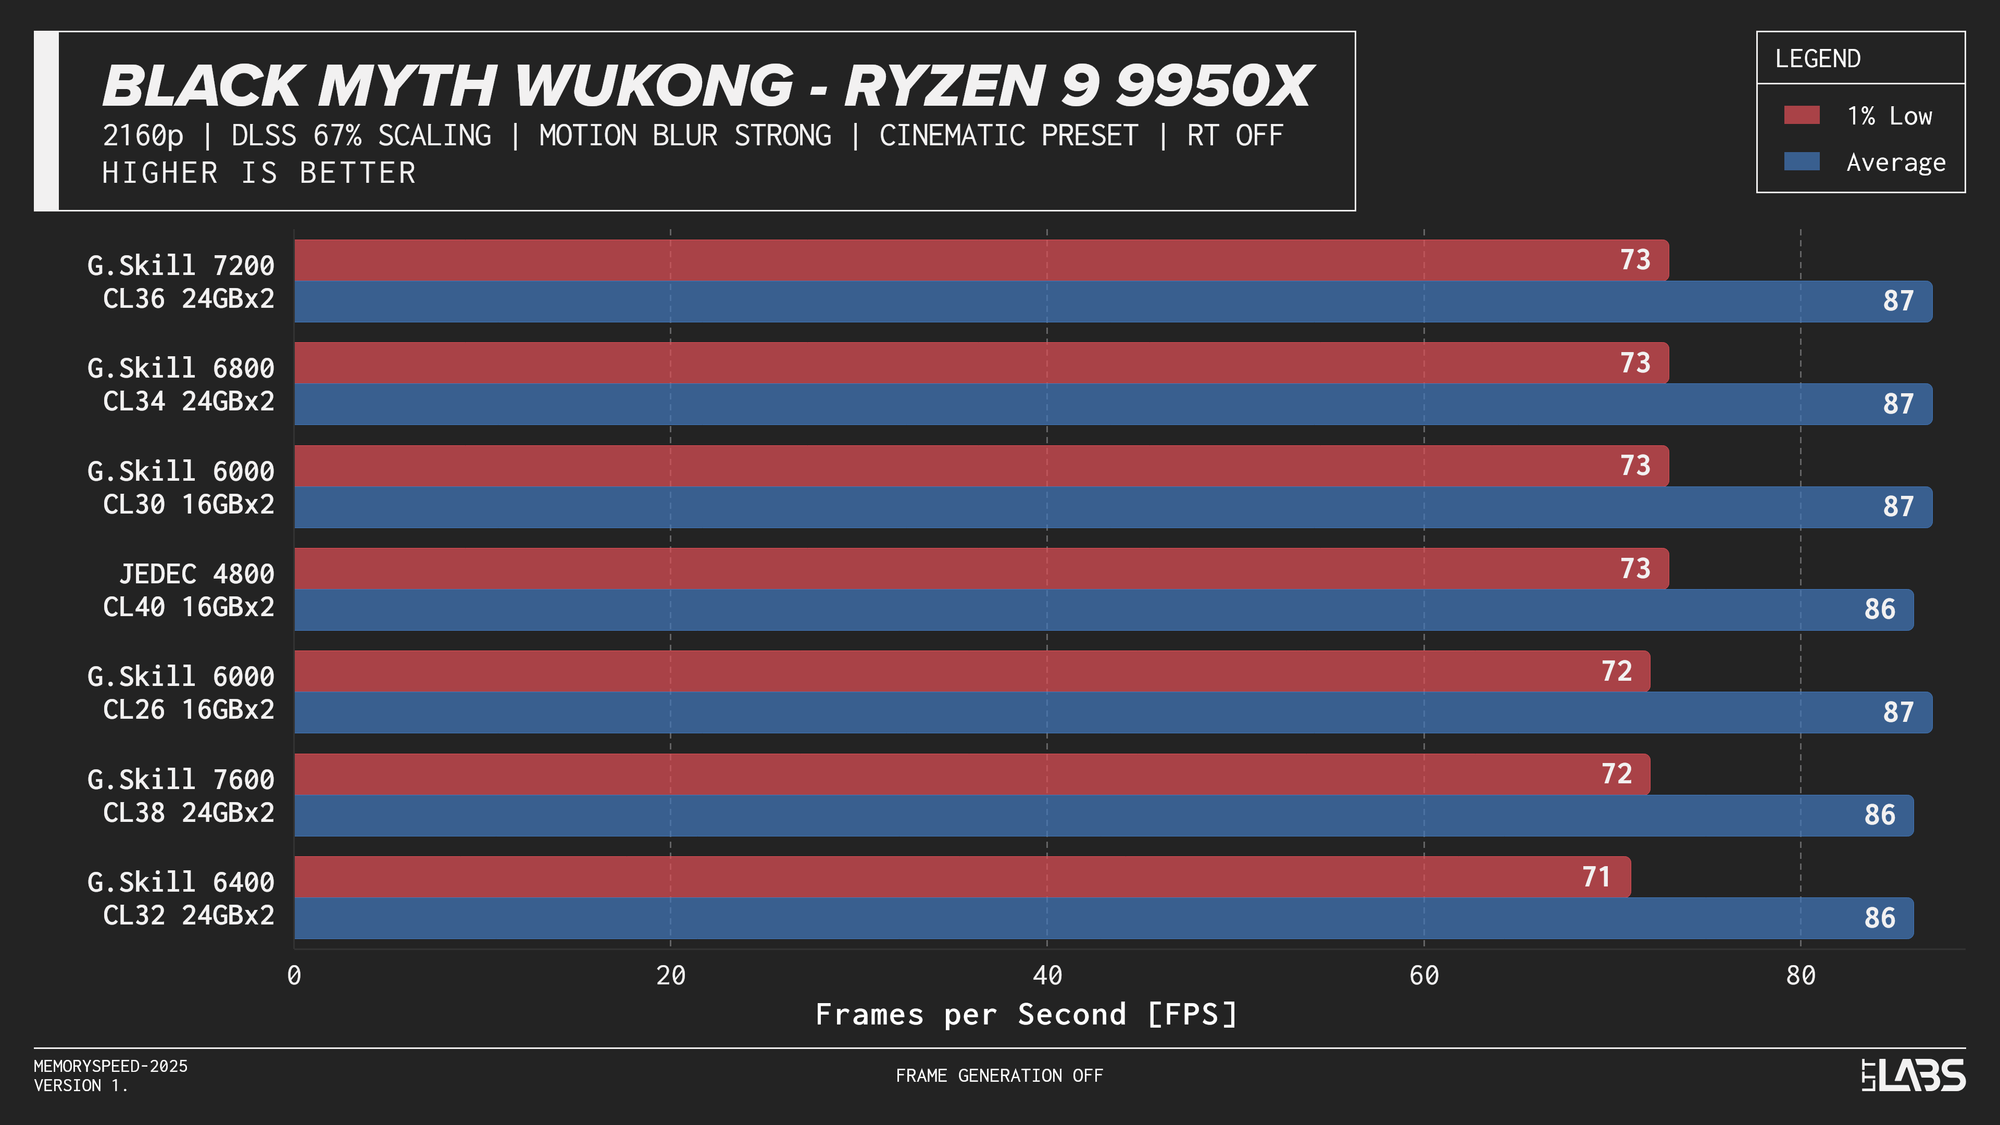
- Black Myth Wukong: 1080p, 2160p, 2160p DLSS
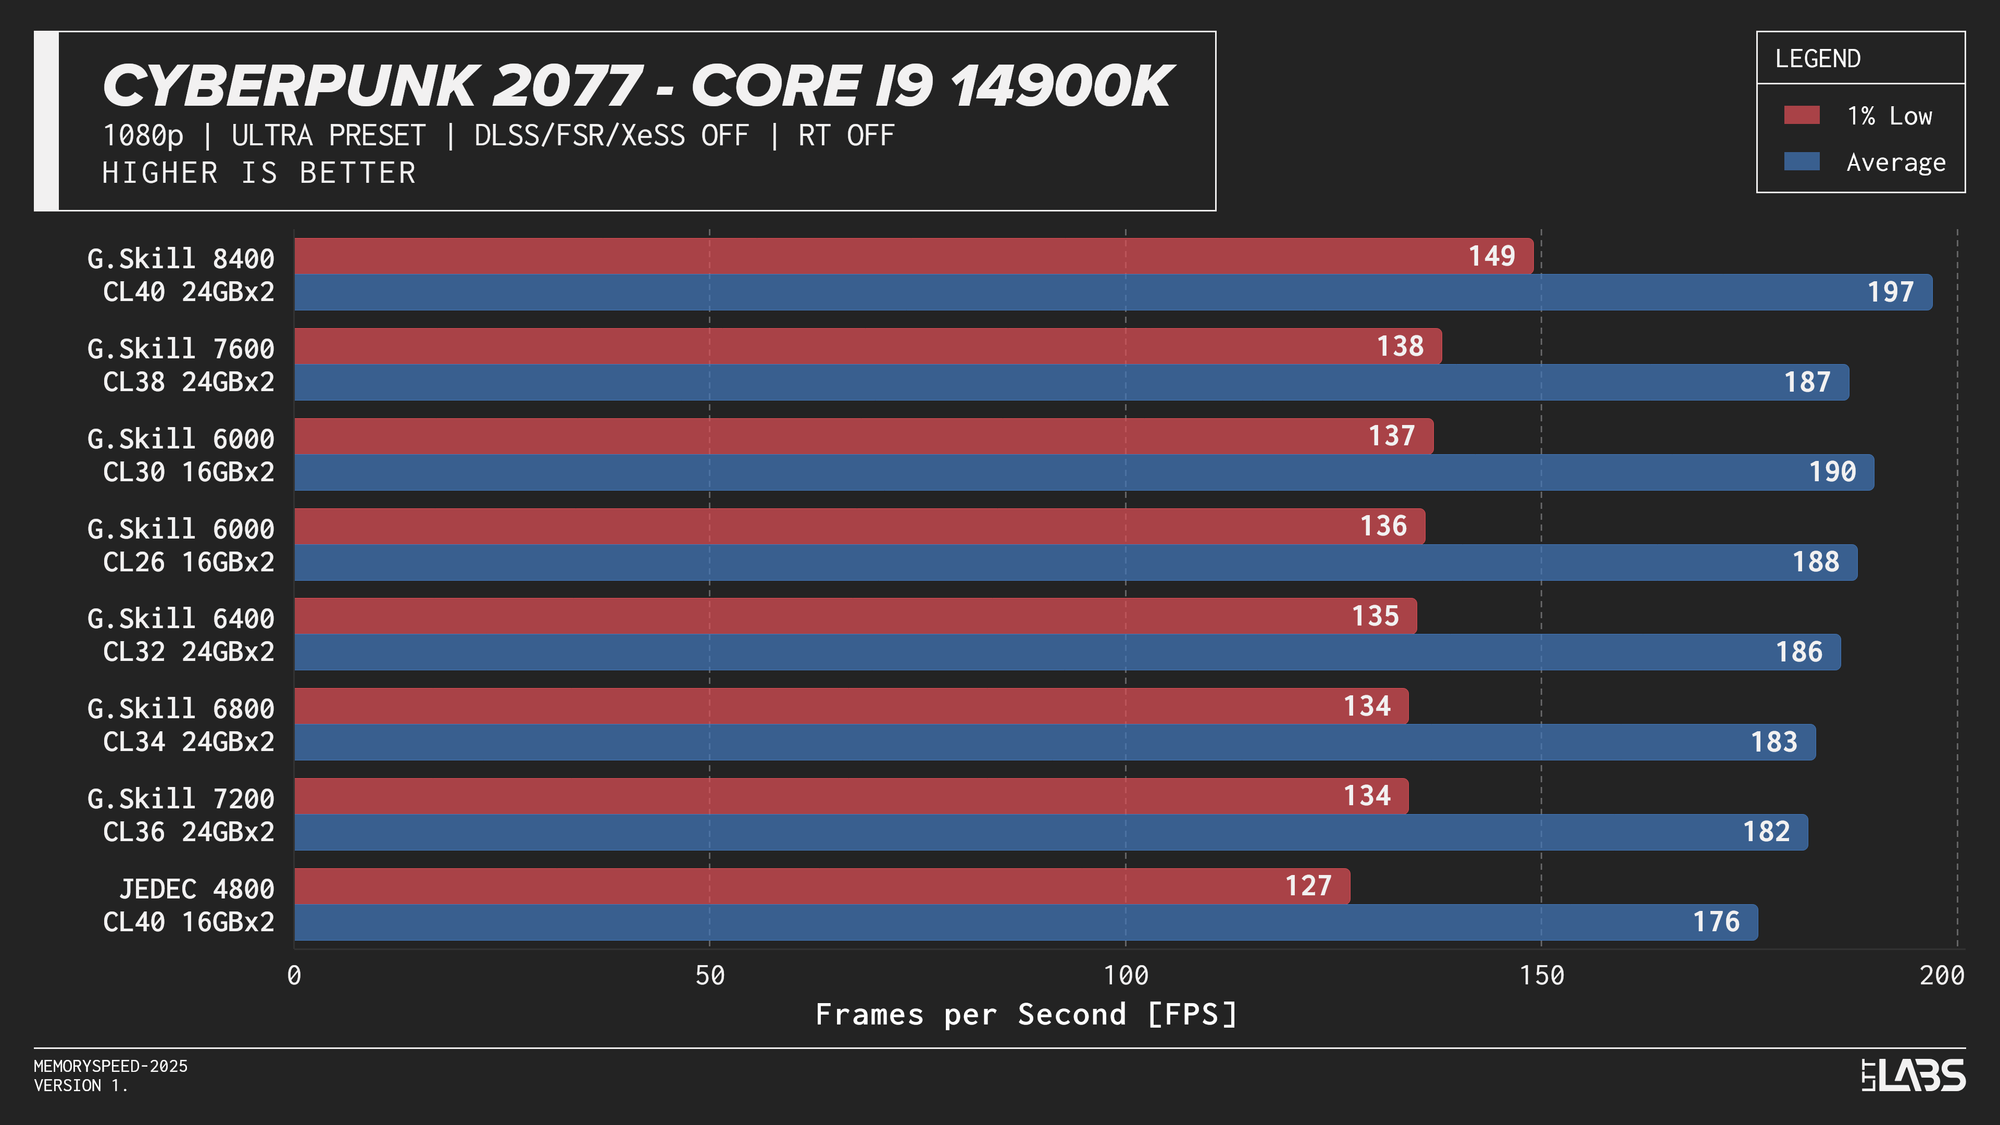
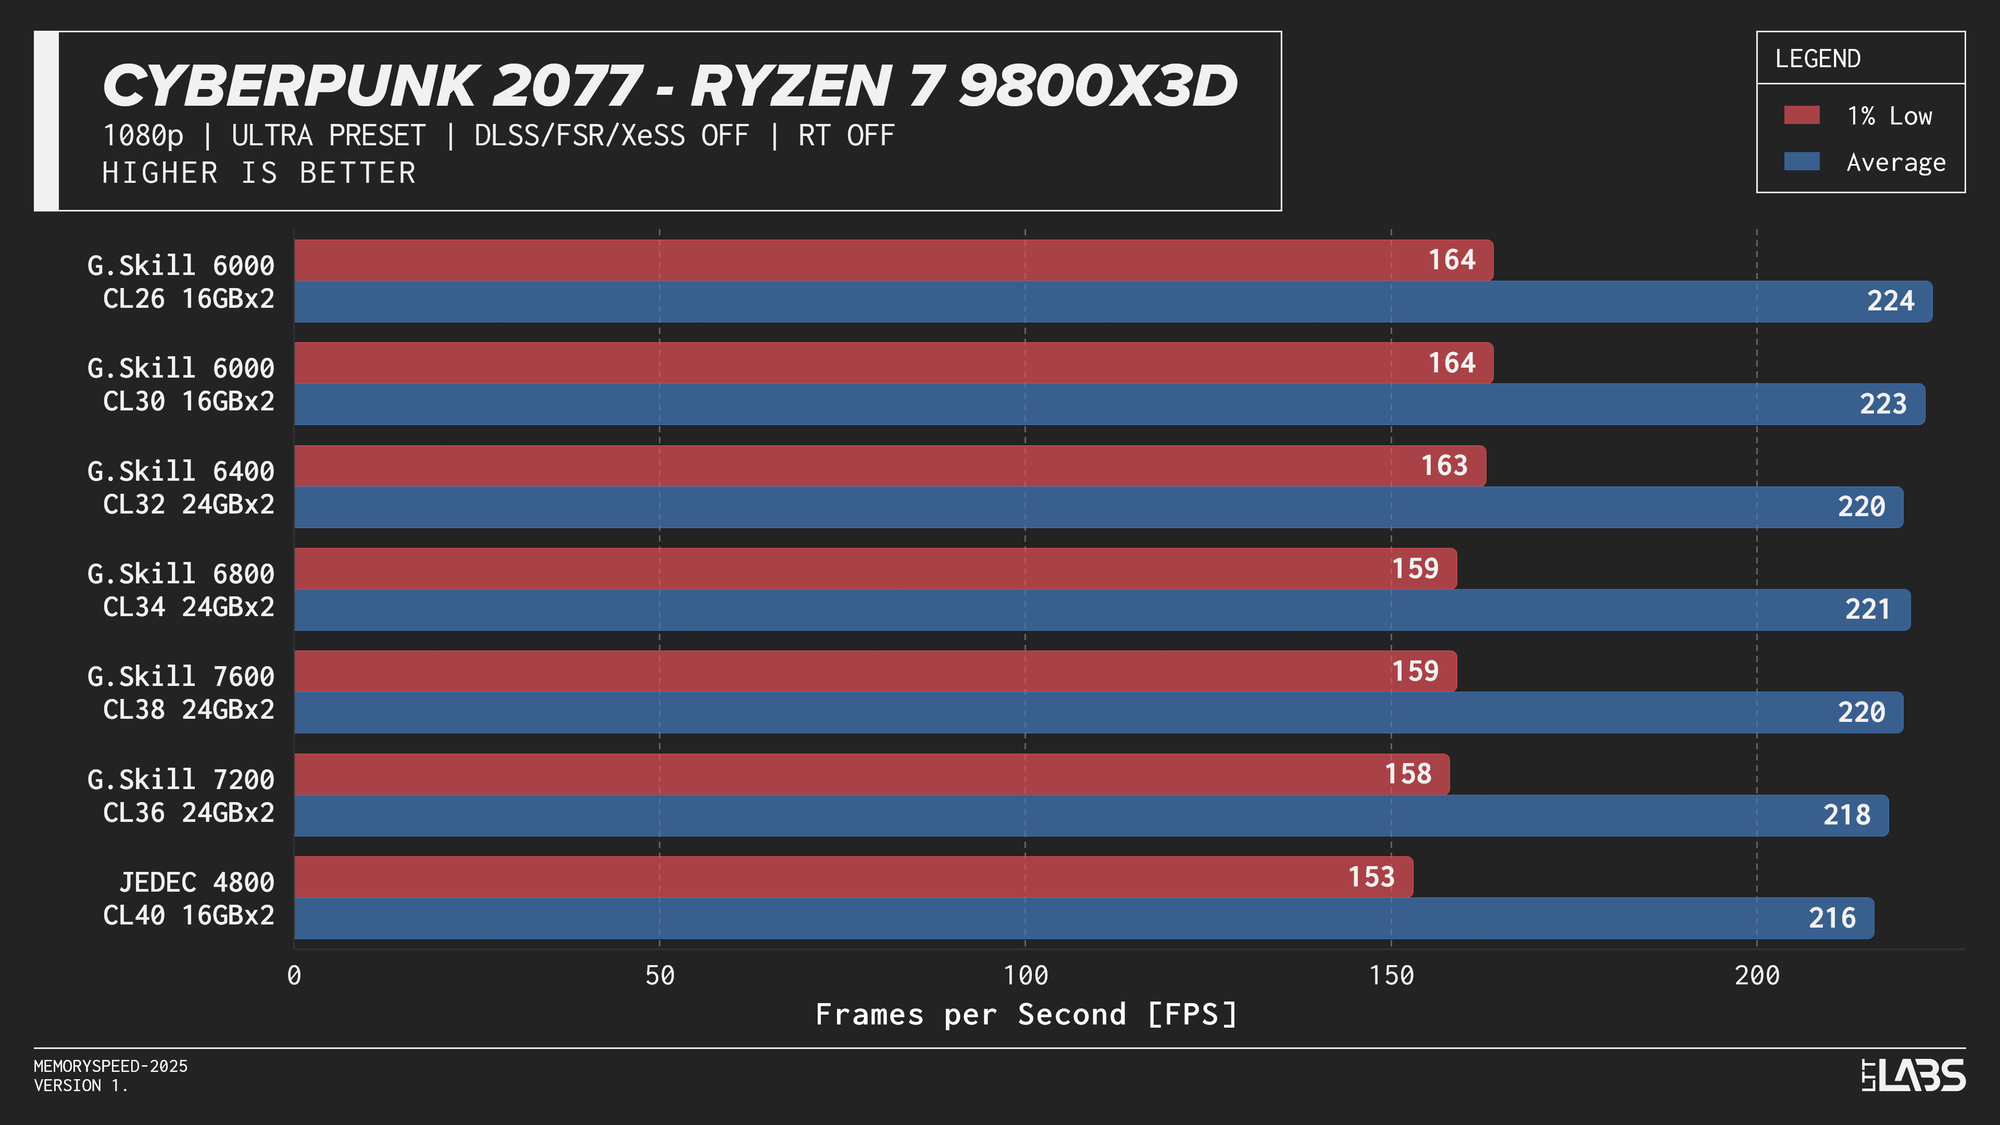
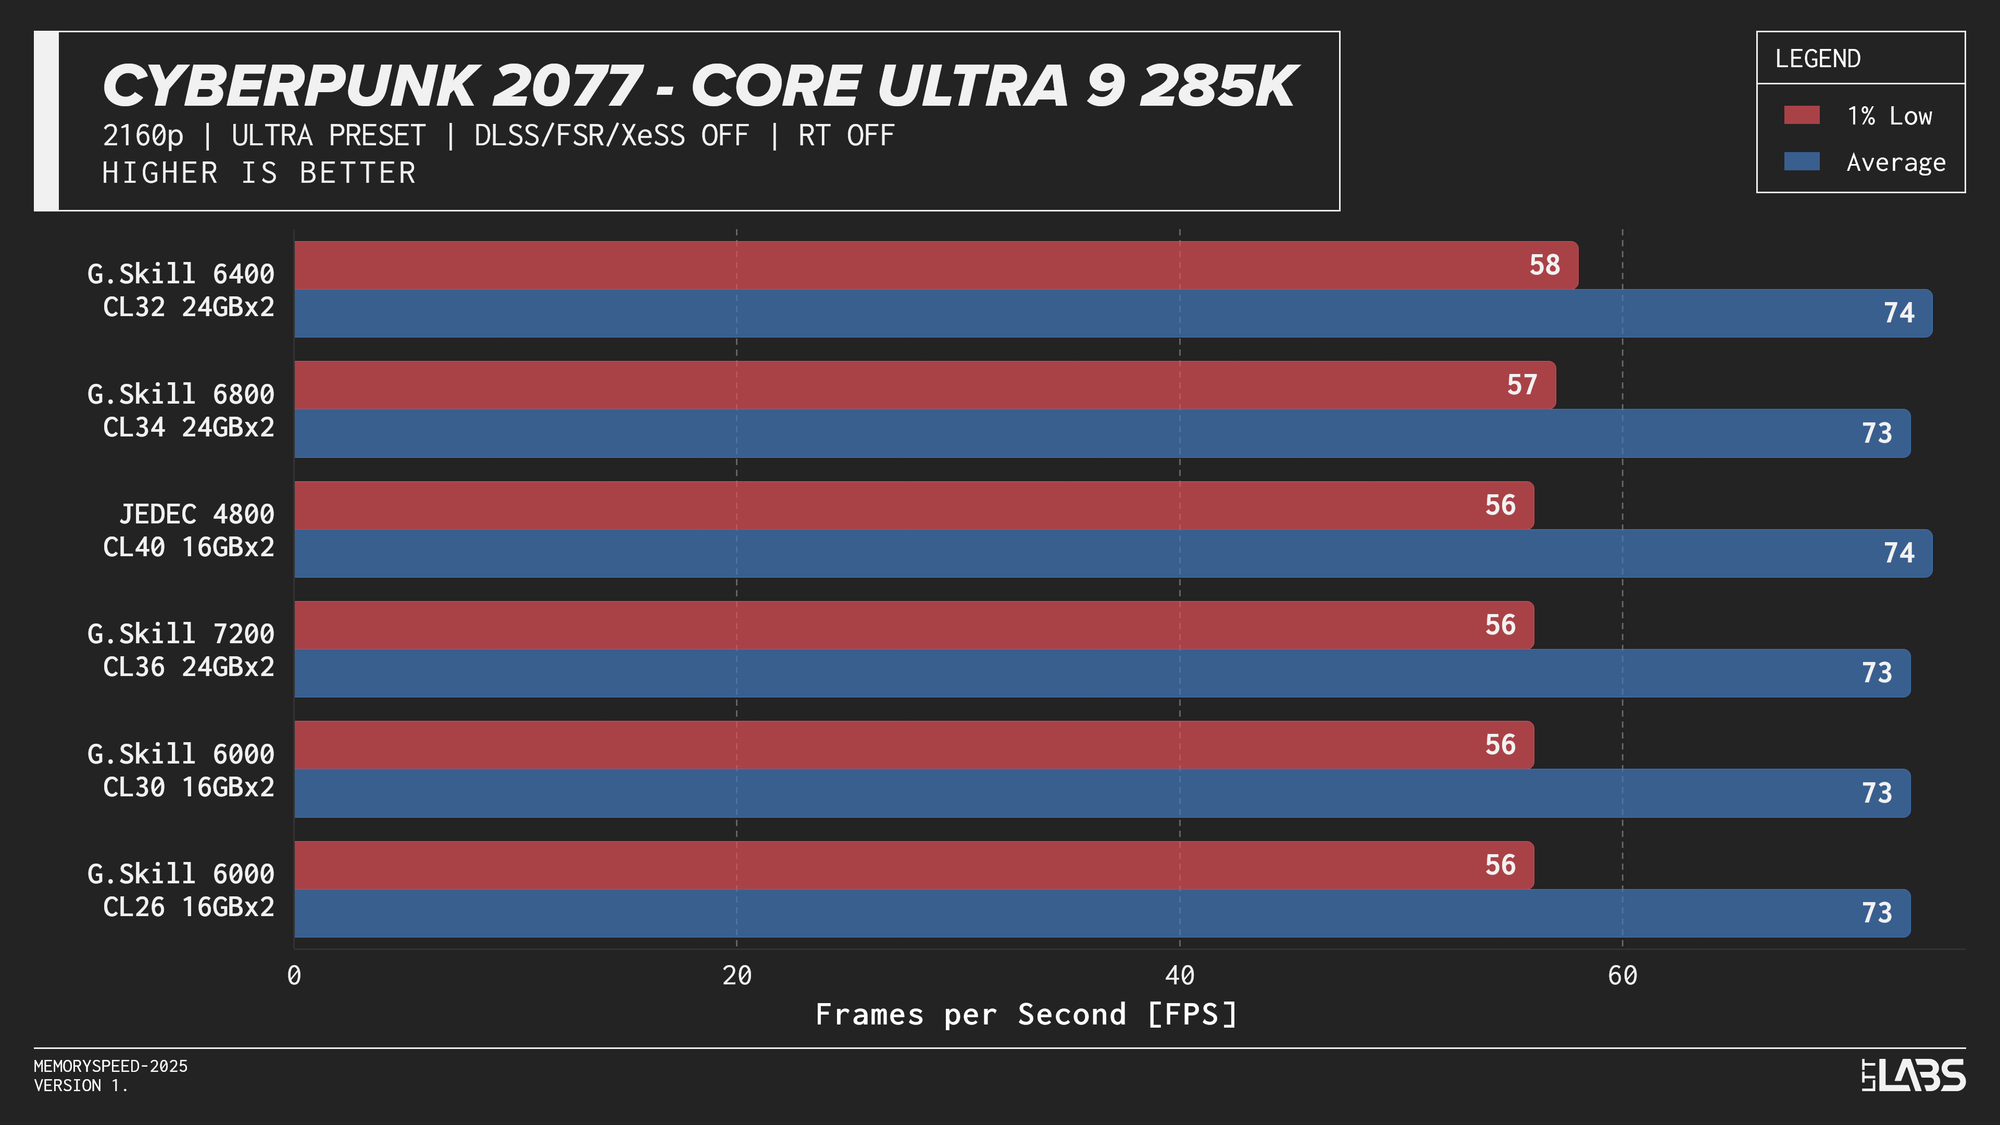
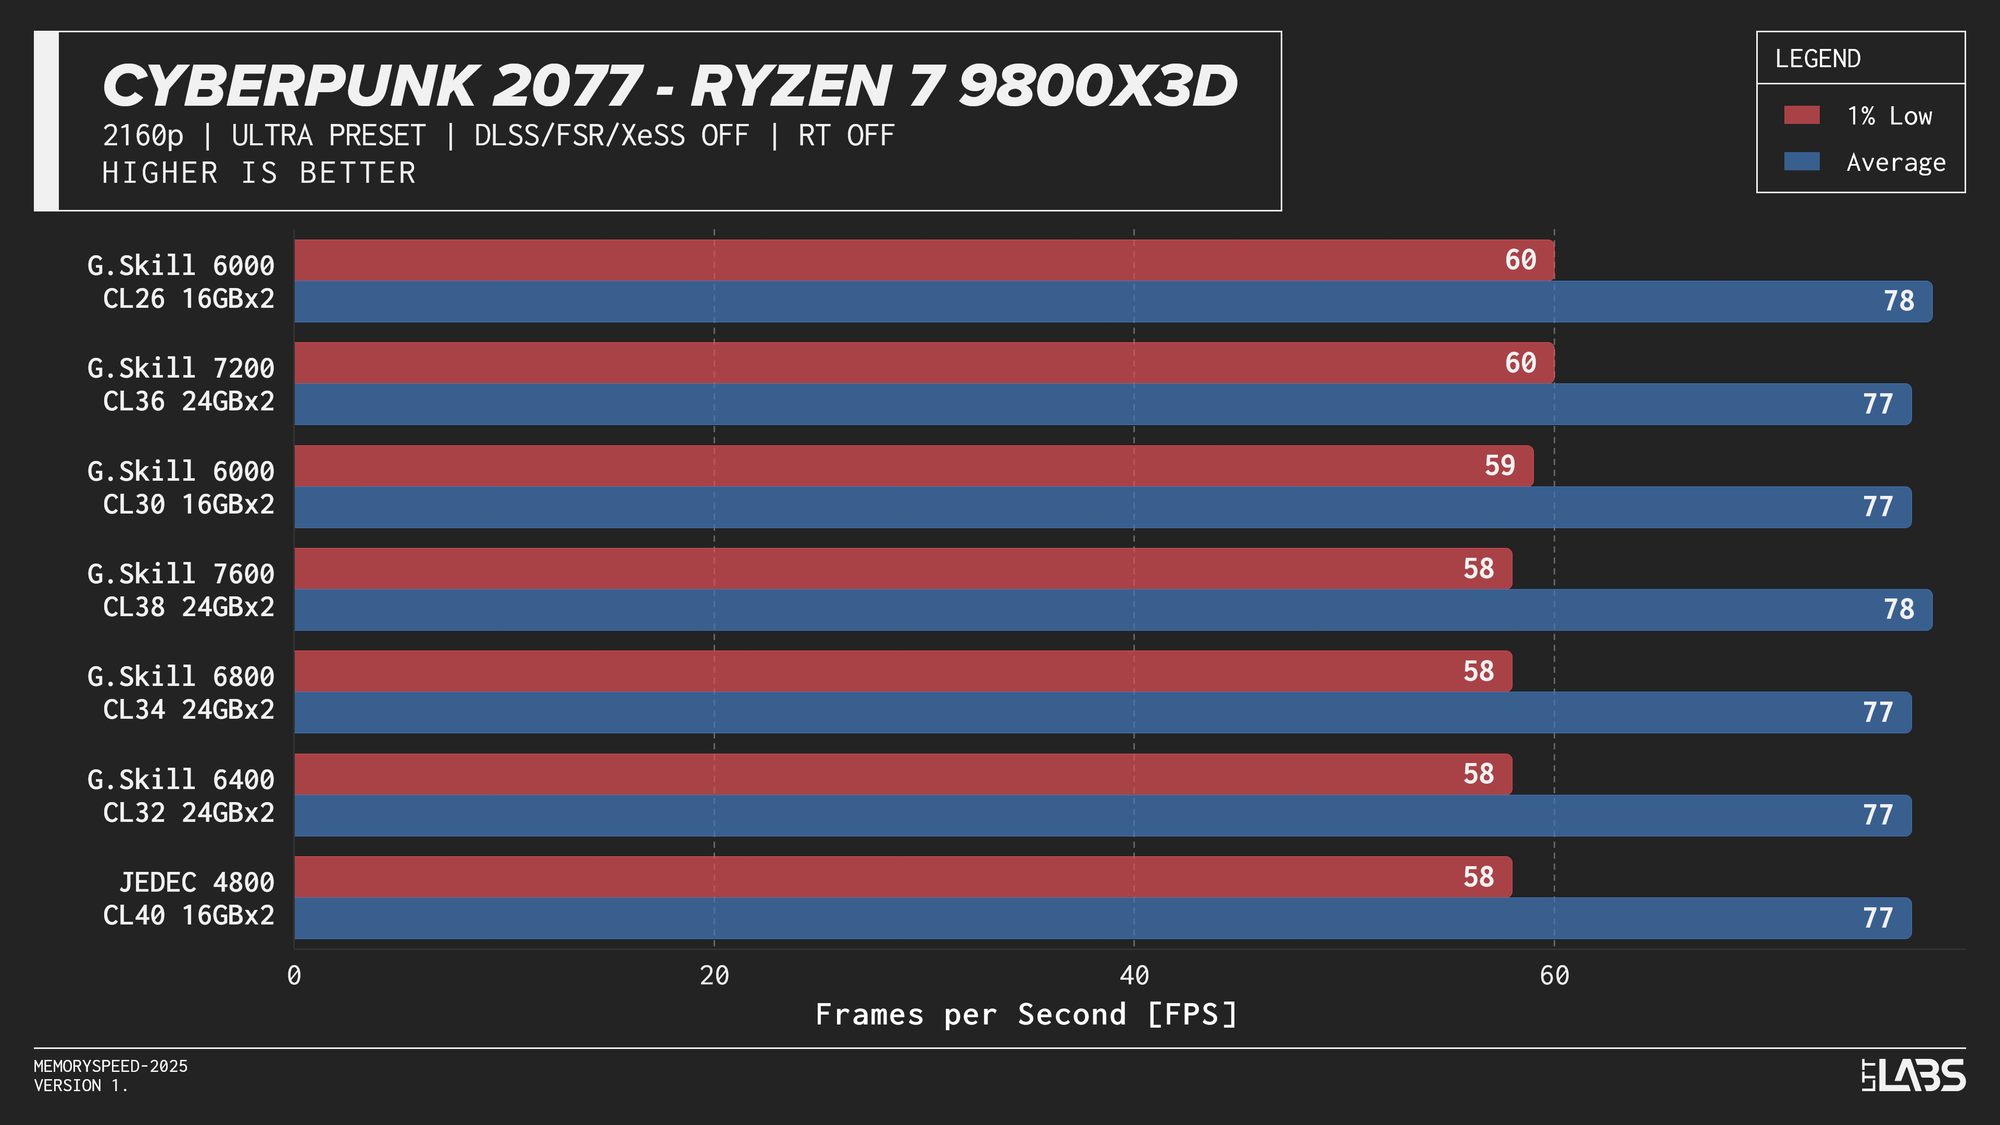
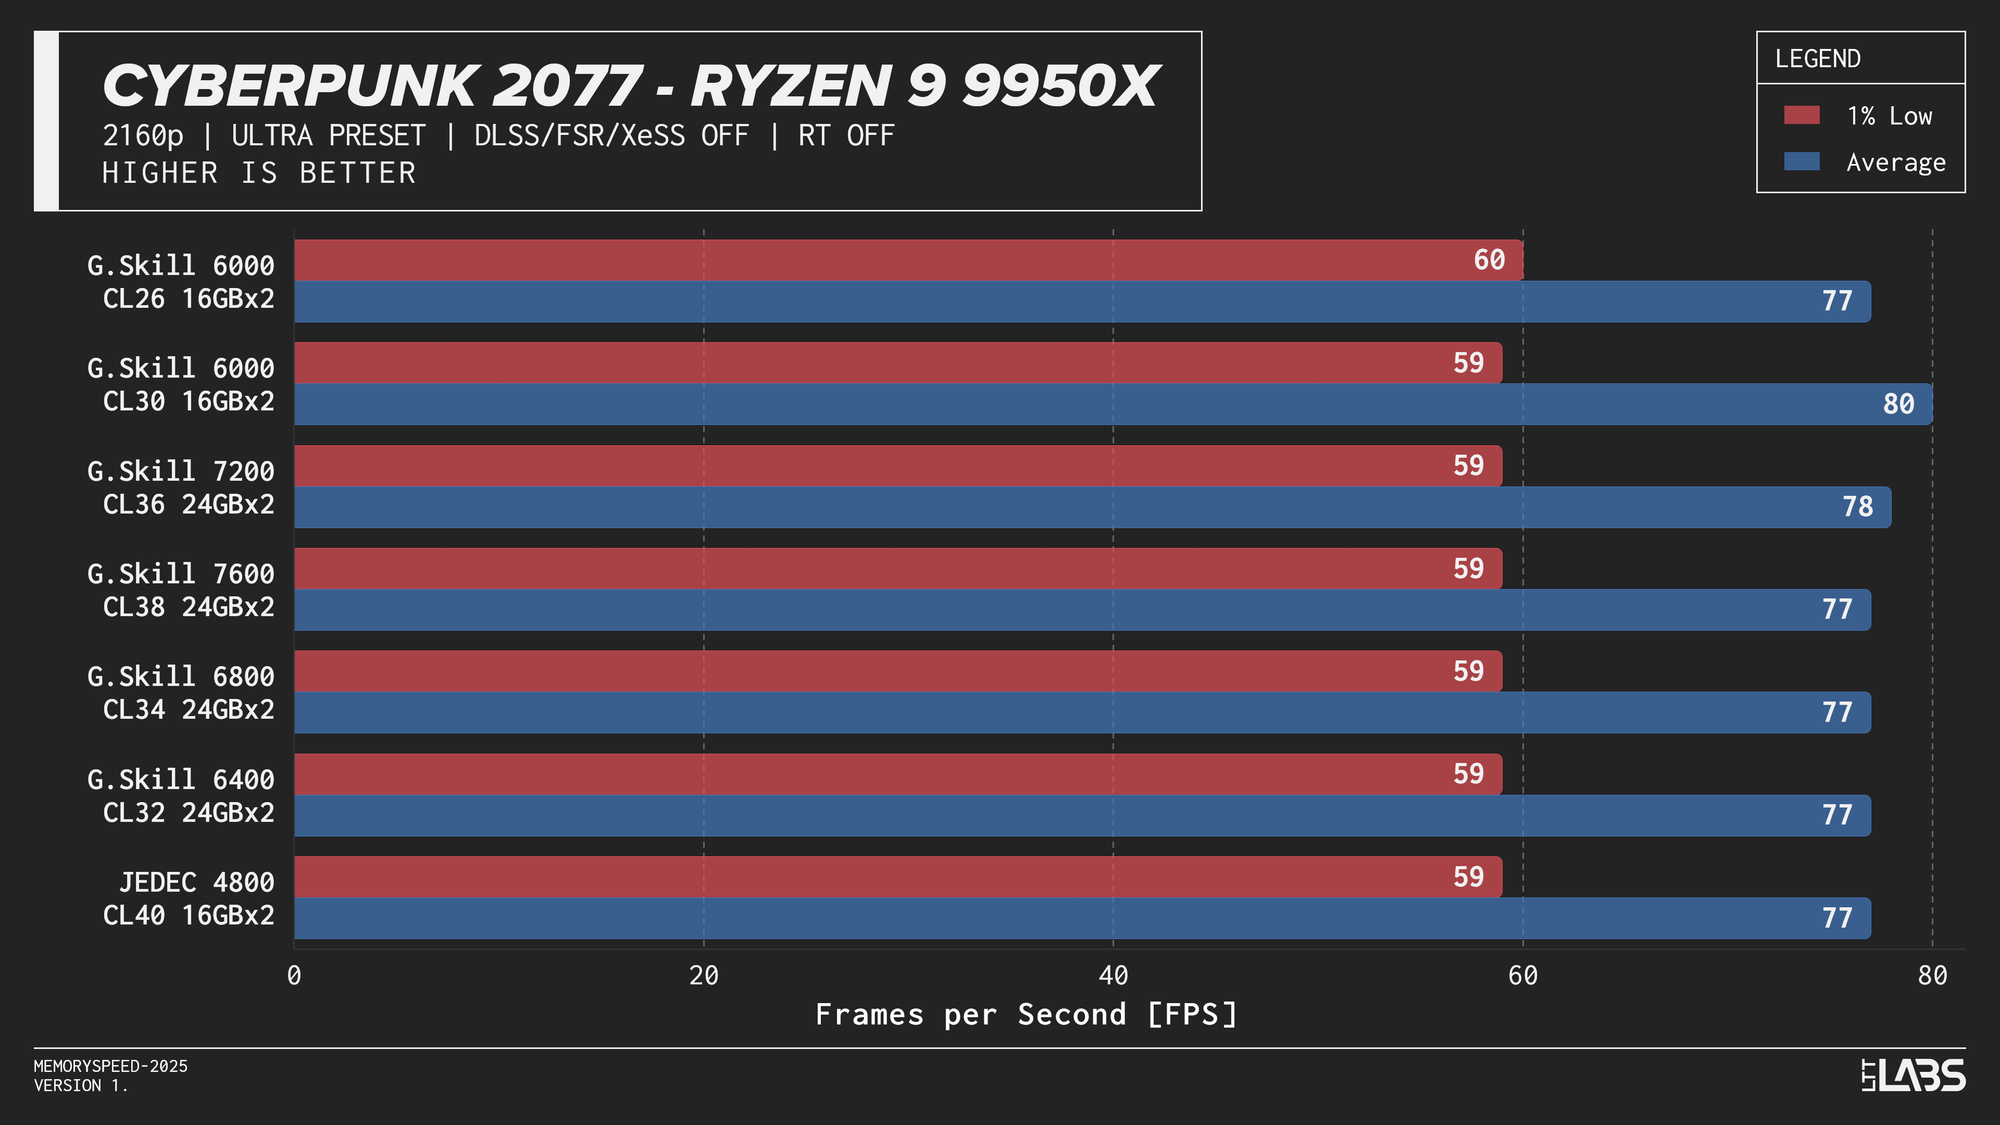
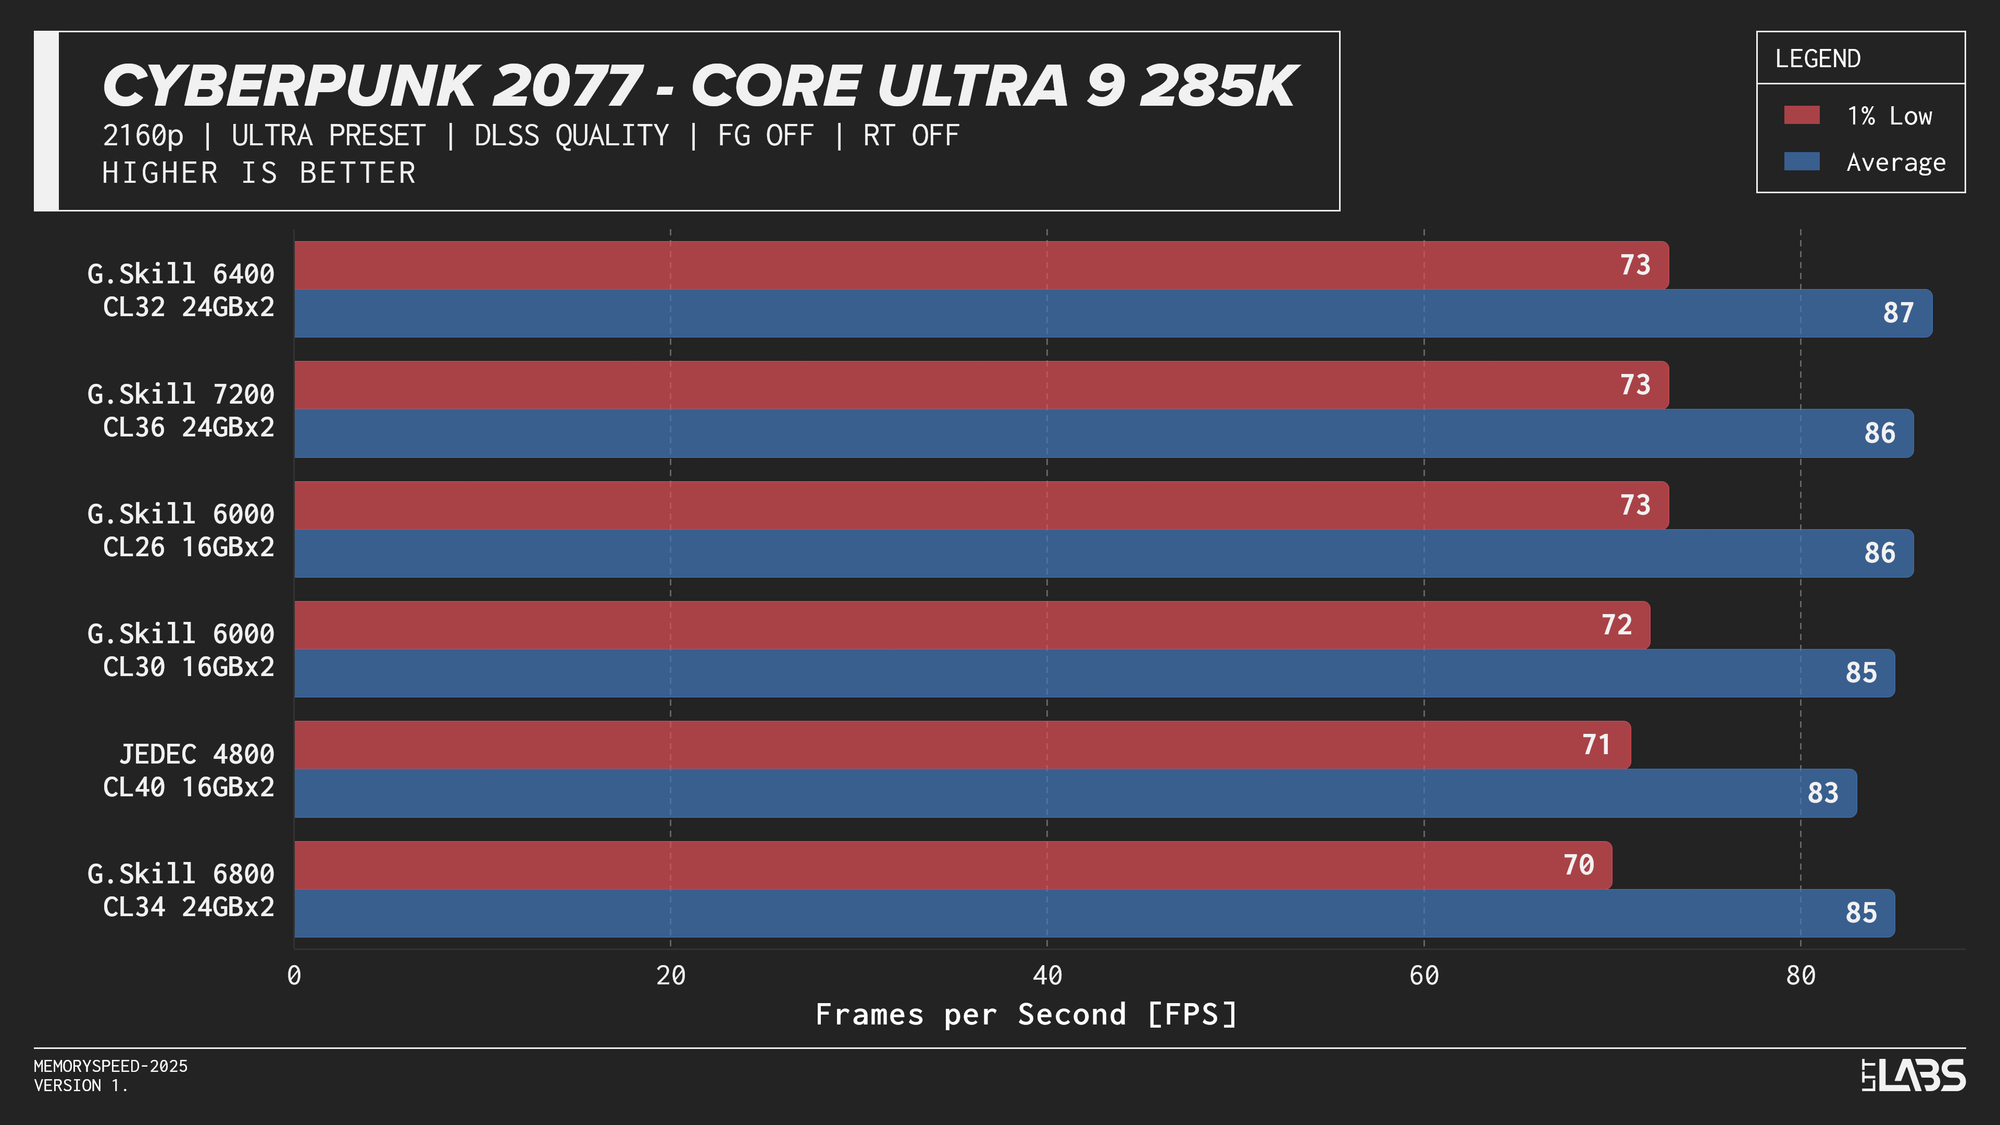
- Cyberpunk 2077: 1080p, 1080p RT, 2160p, 2160p RT, 2160p DLSS
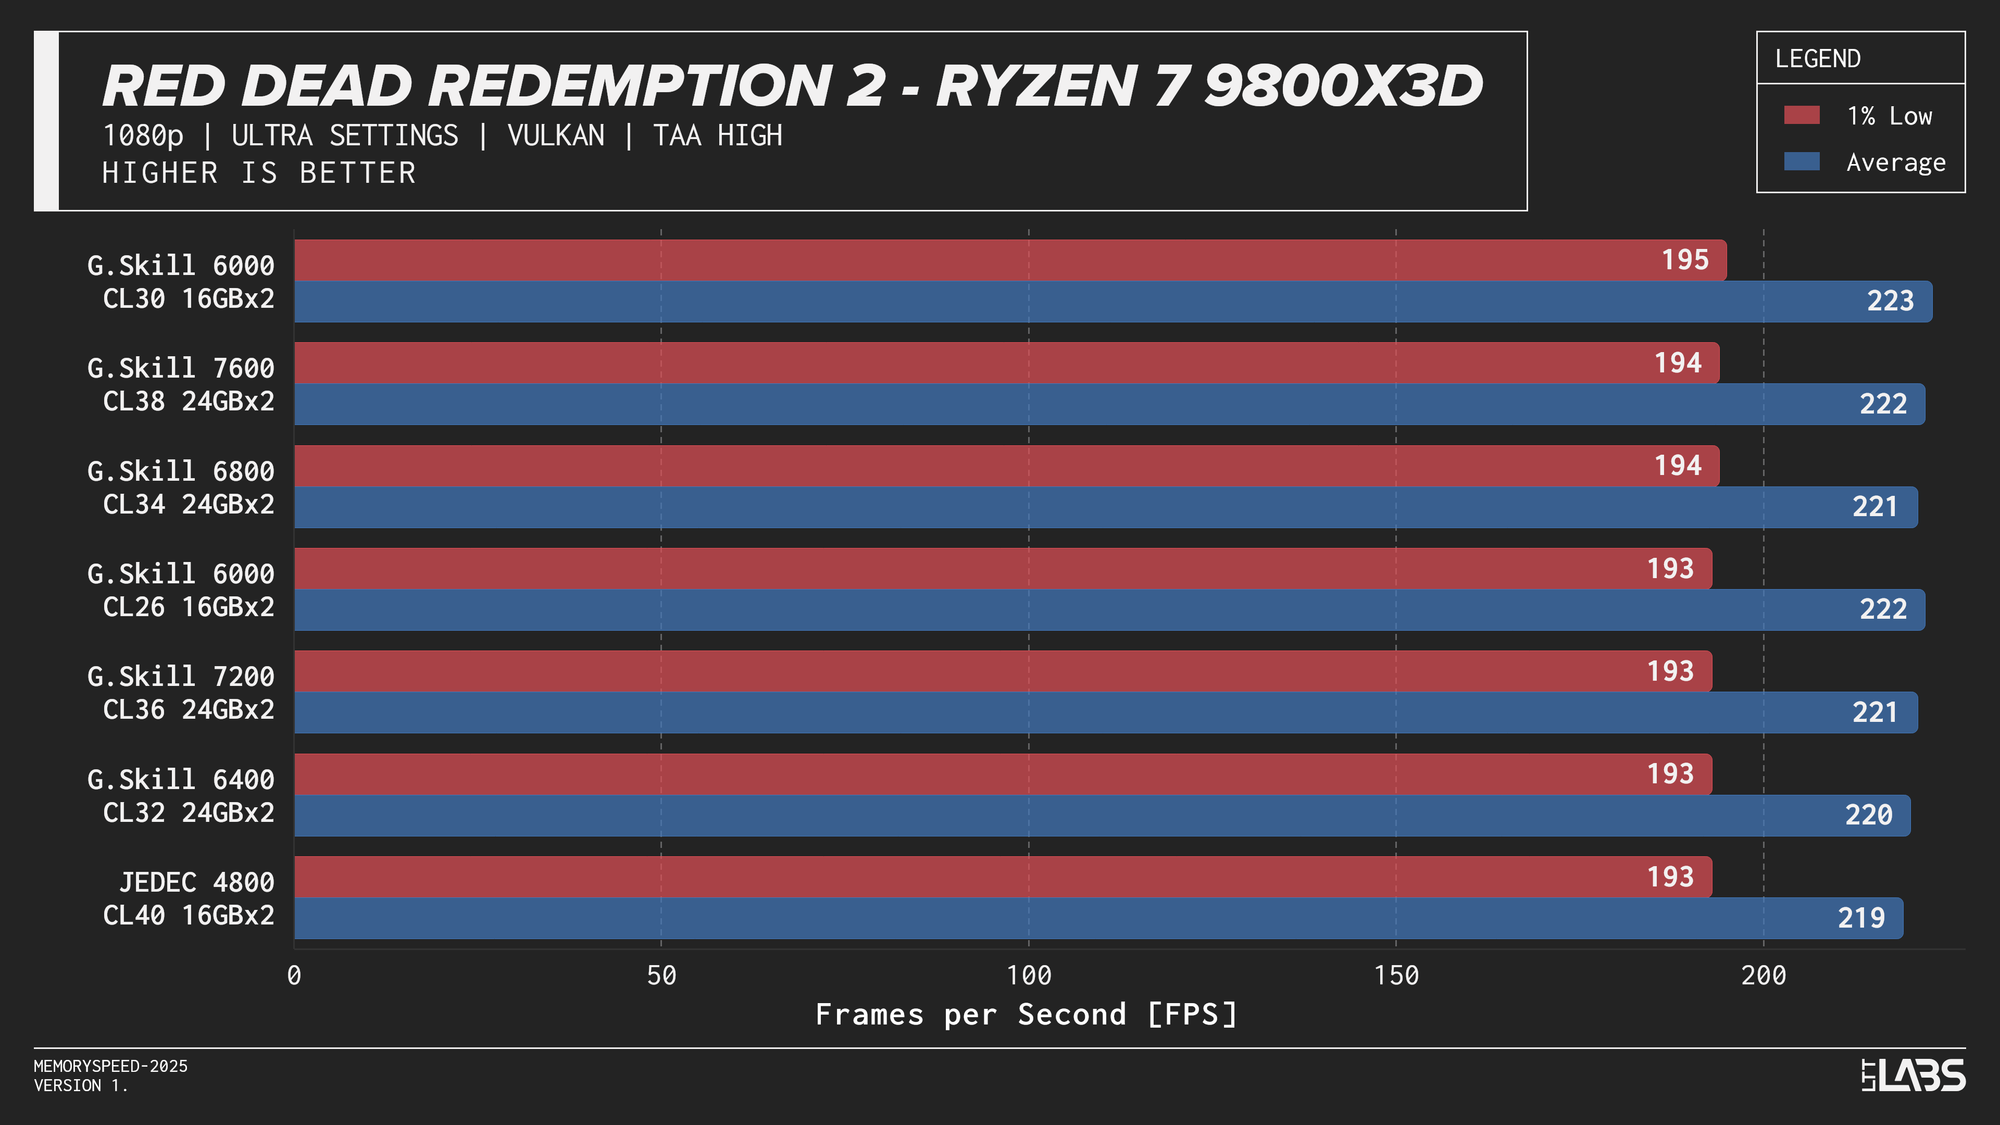
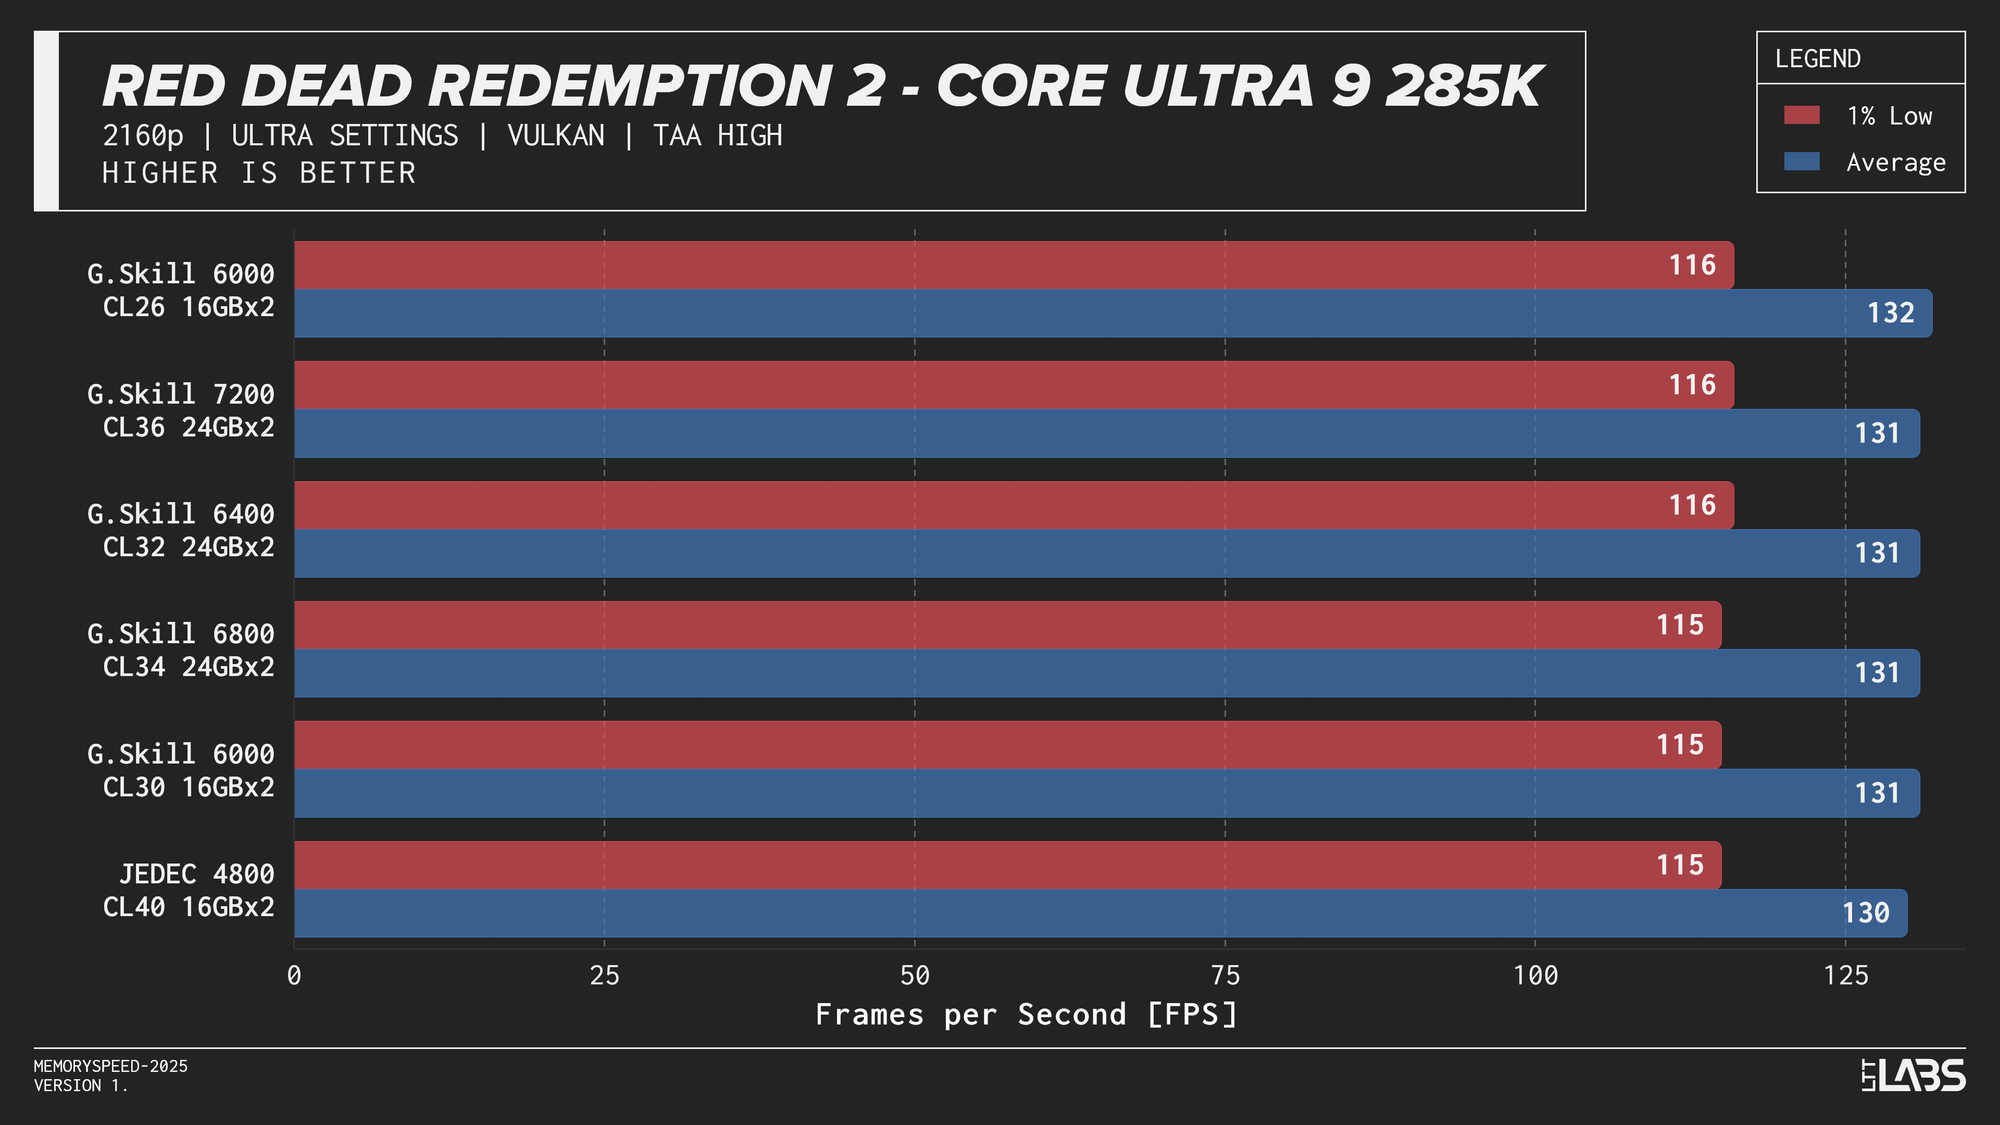
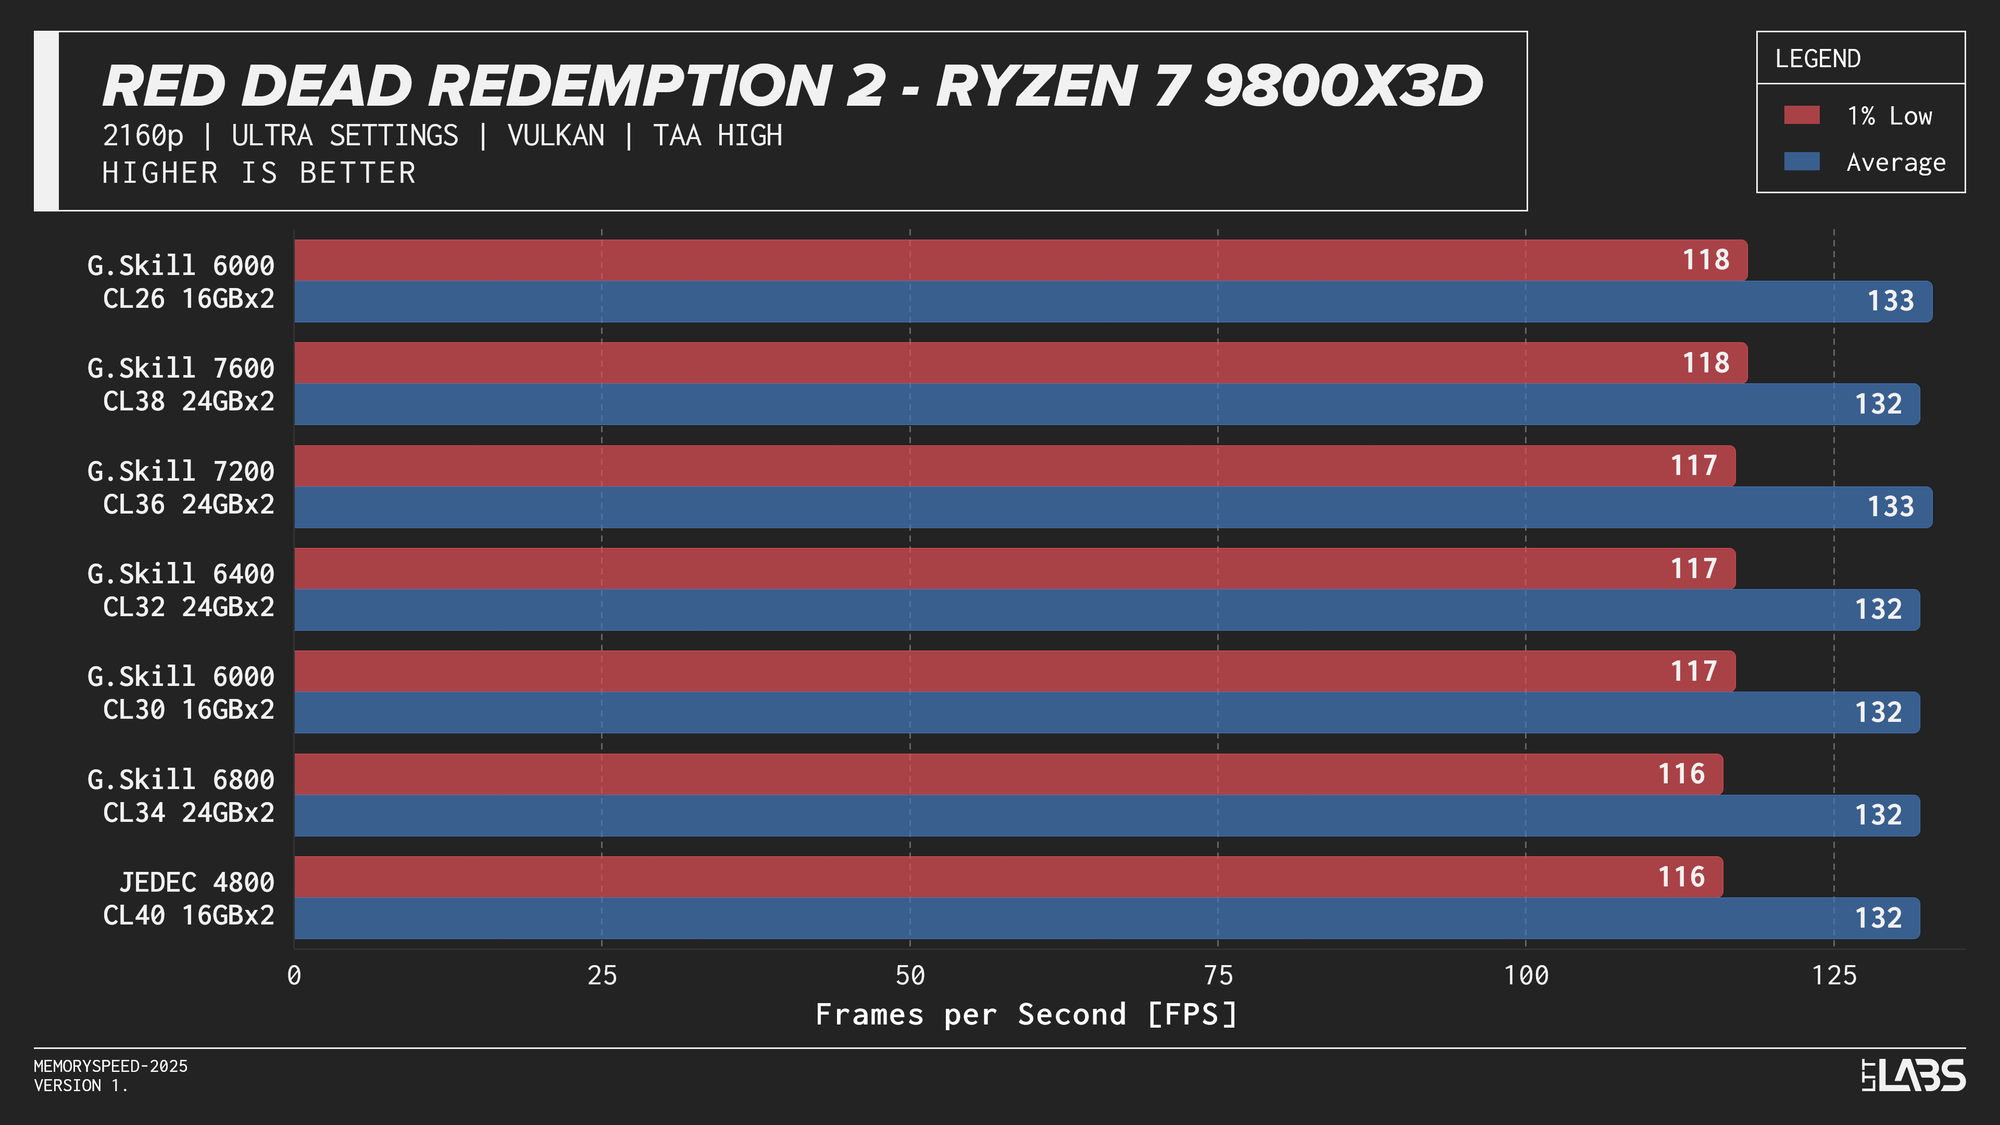
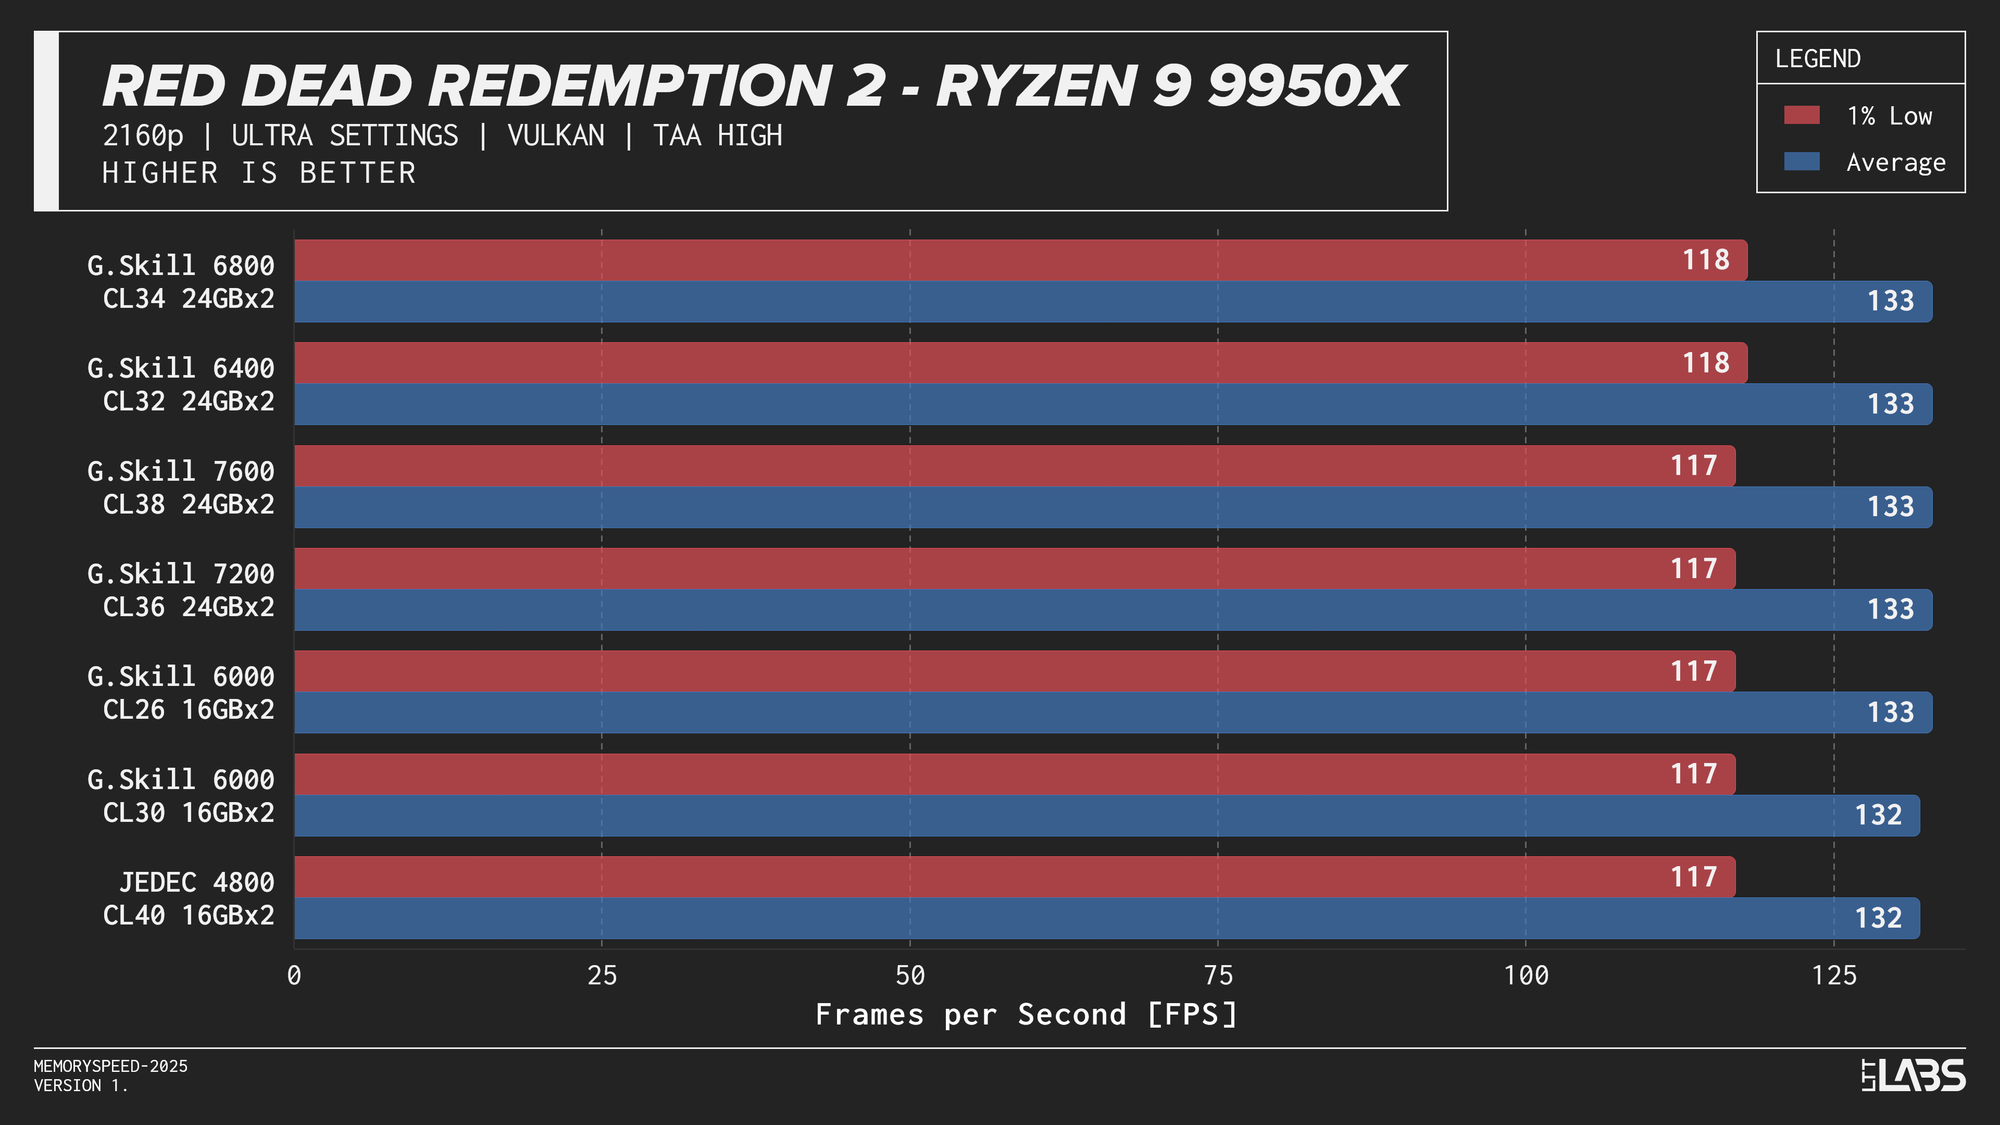
- Red Dead Redemption 2: 1080p, 2160p
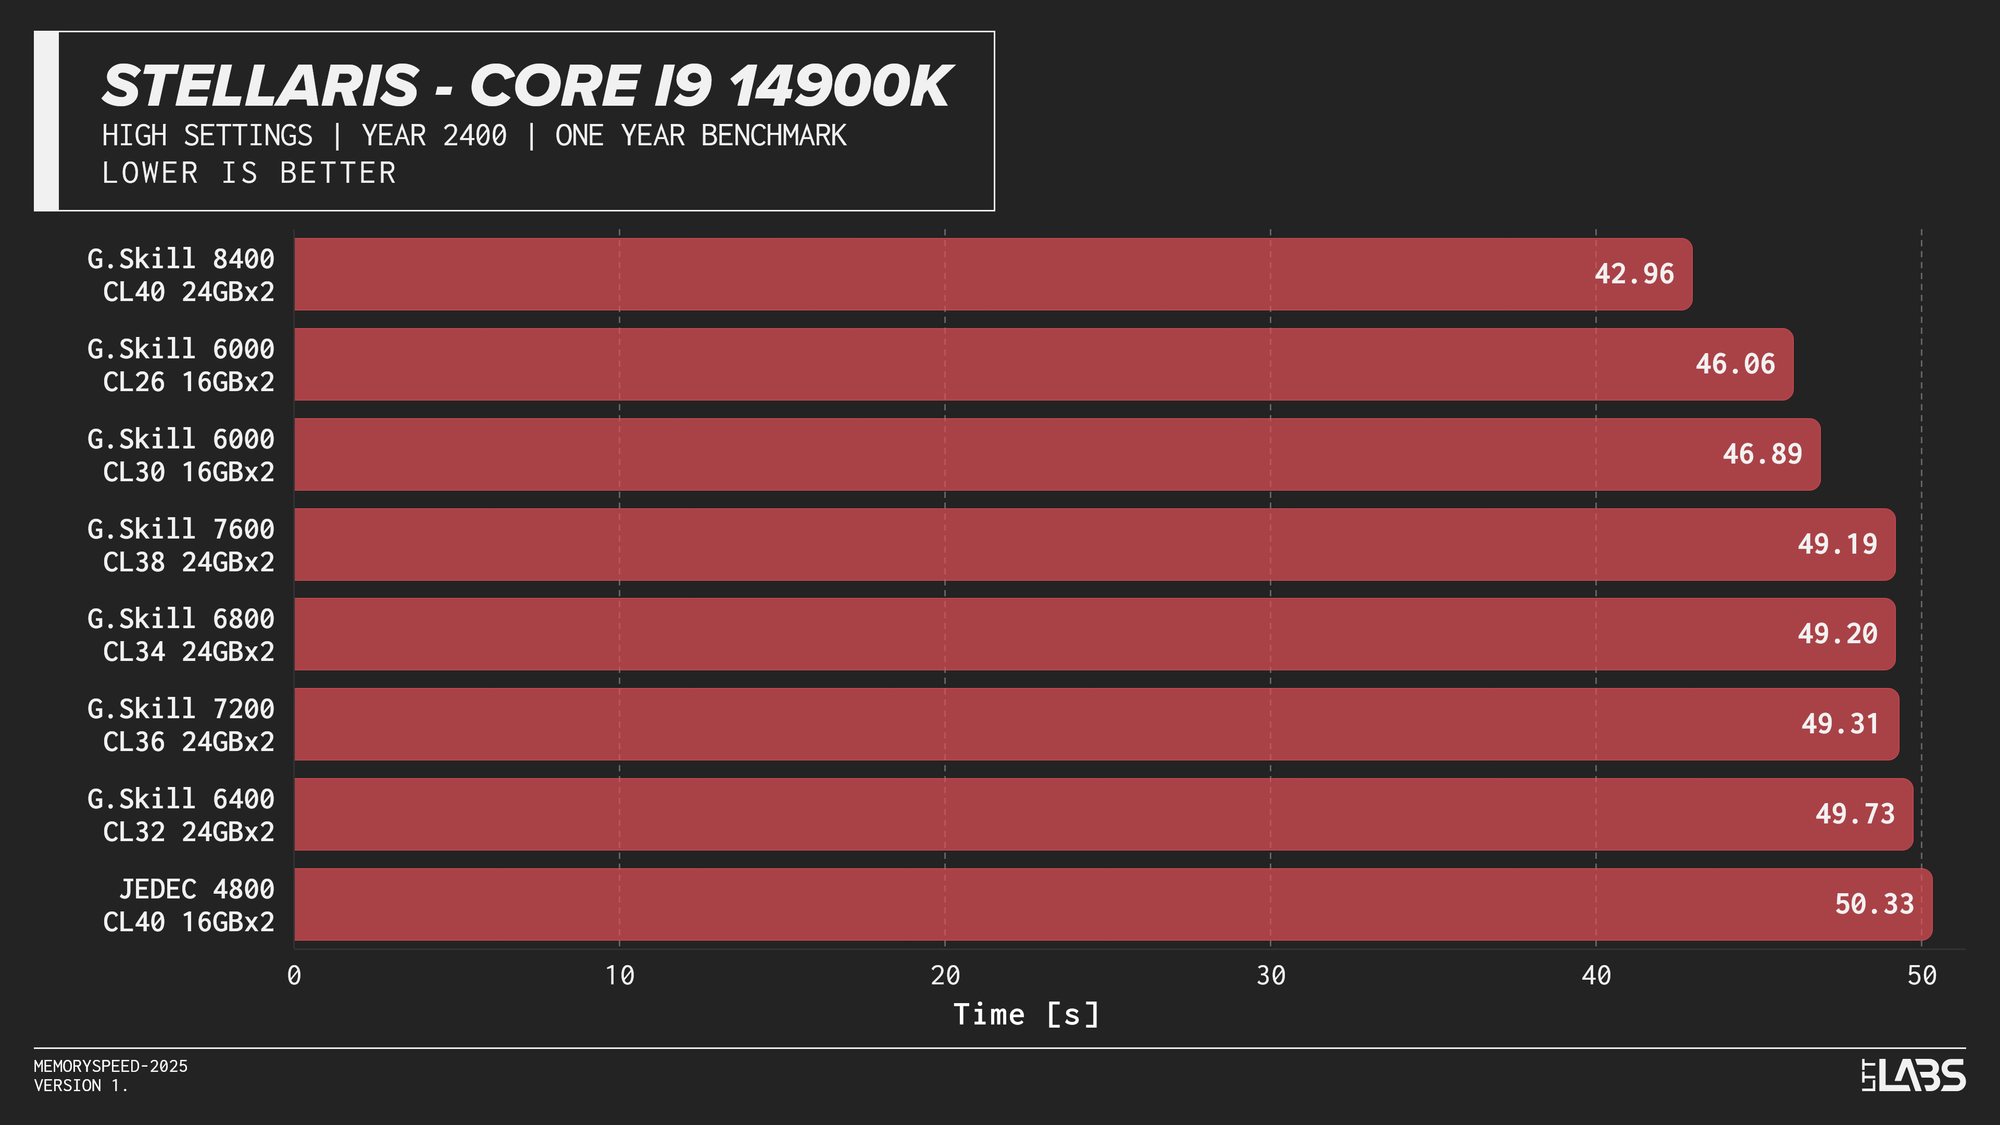
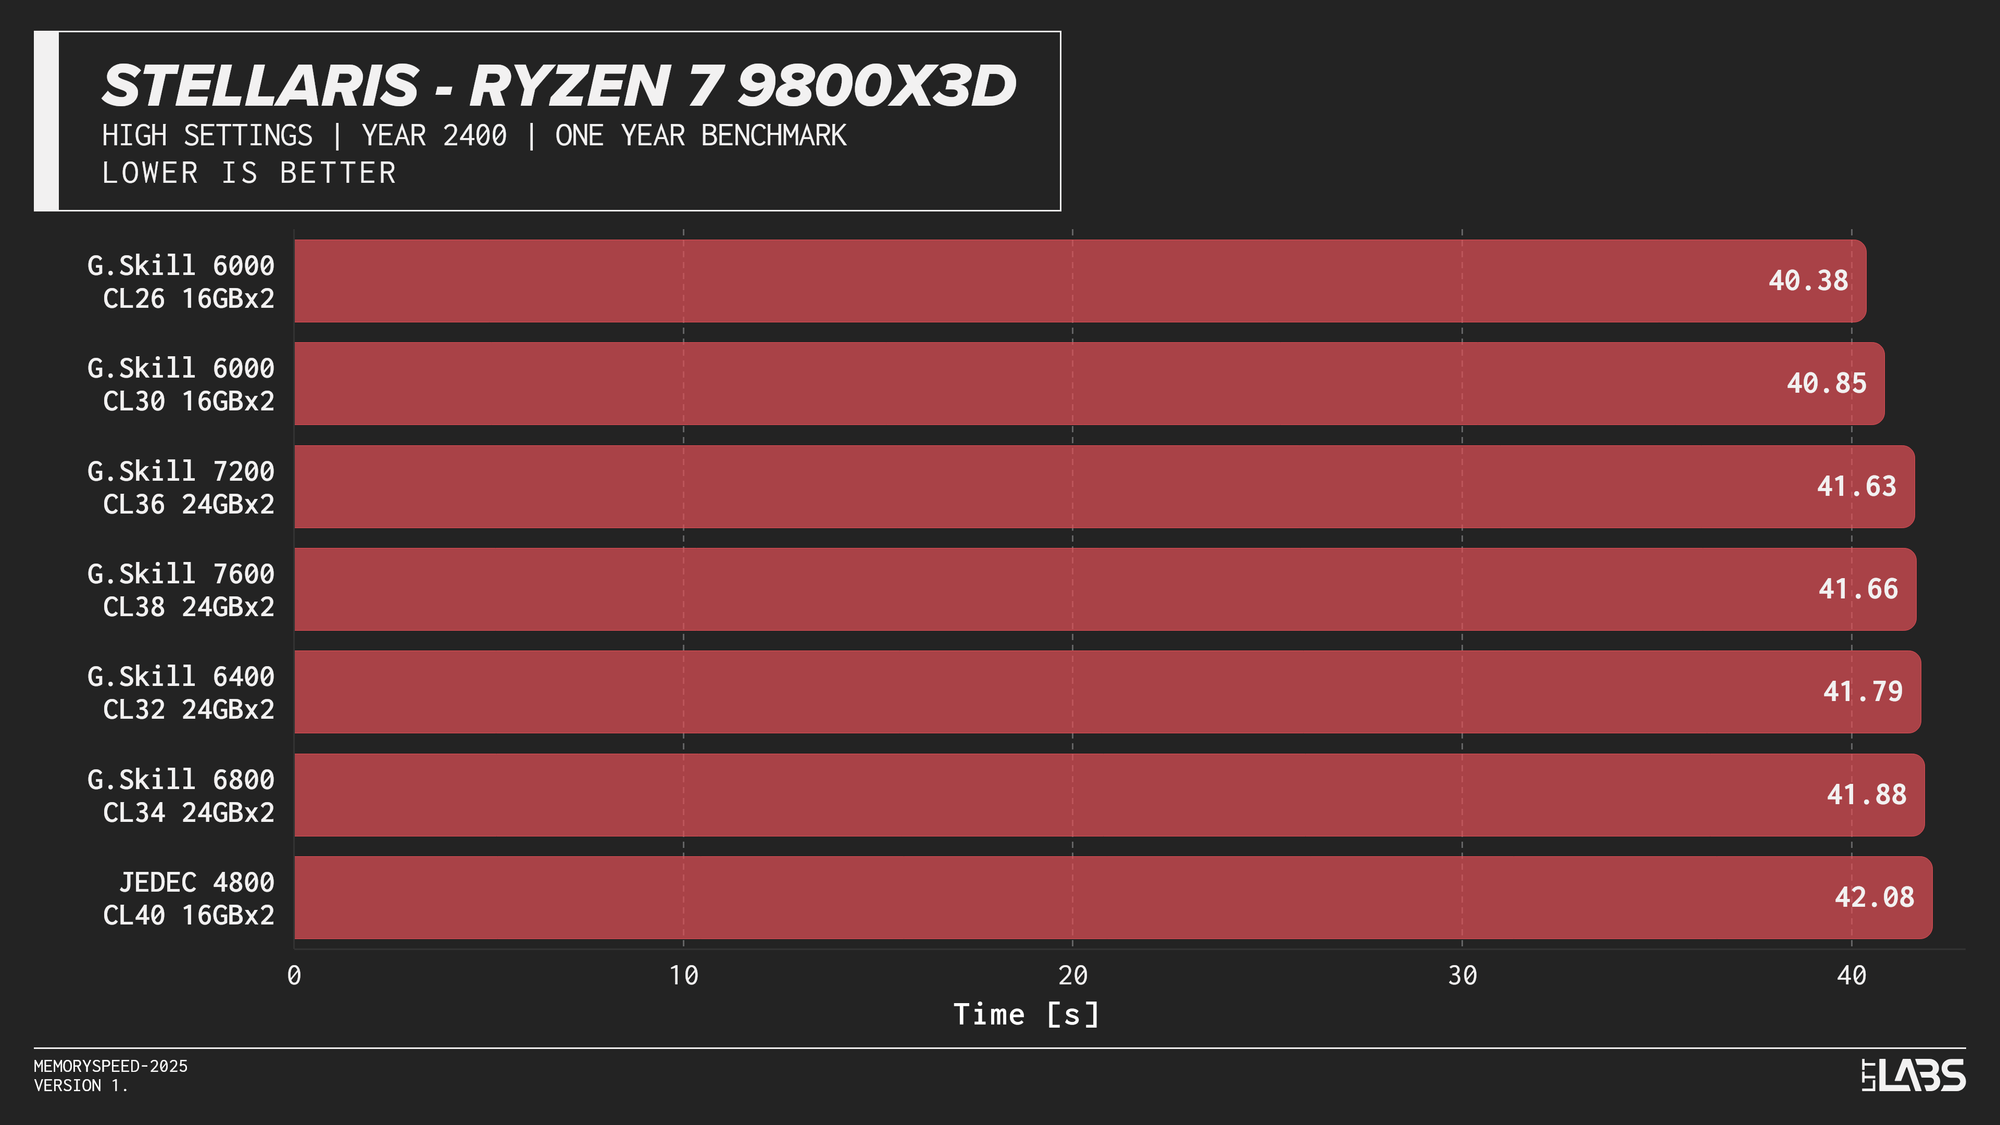
- Stellaris: 1080p
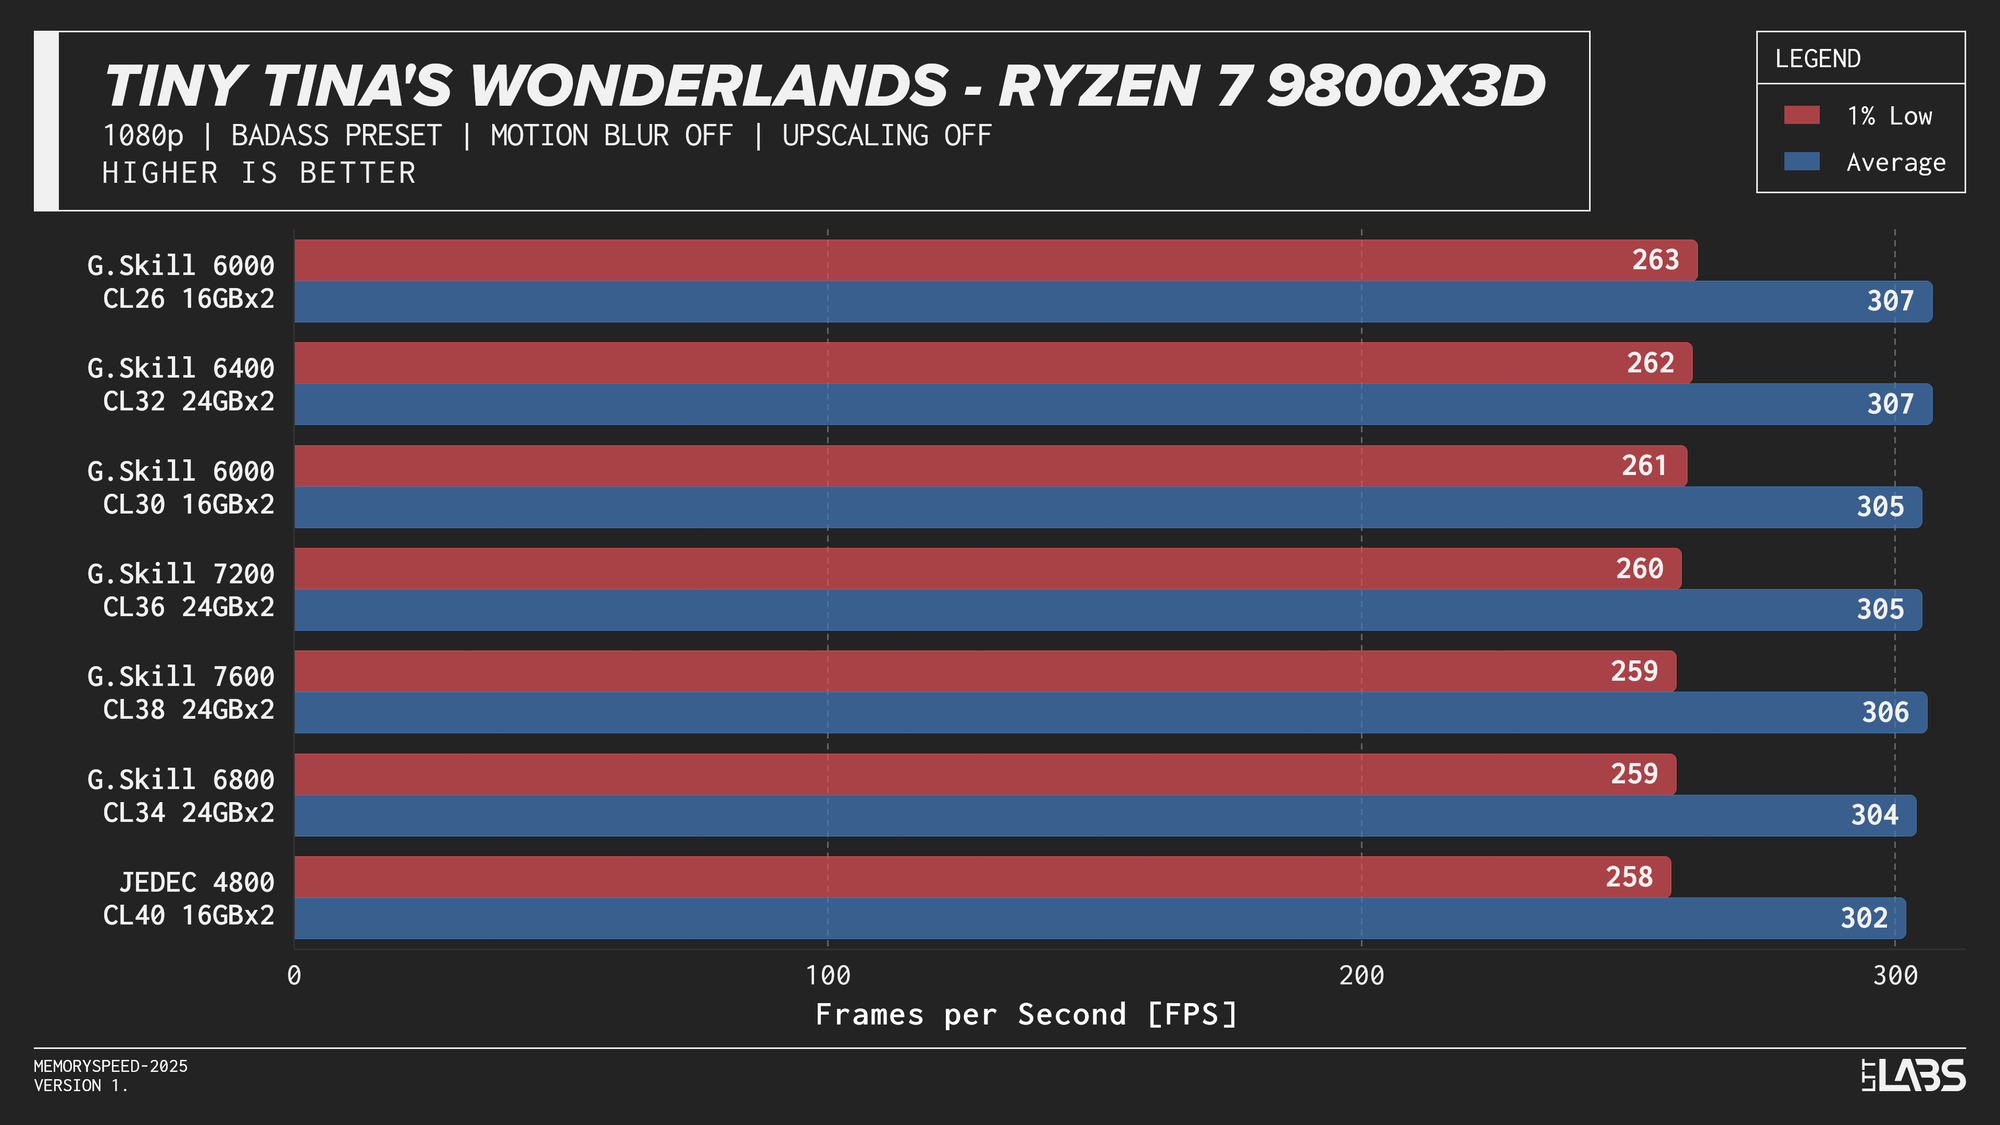
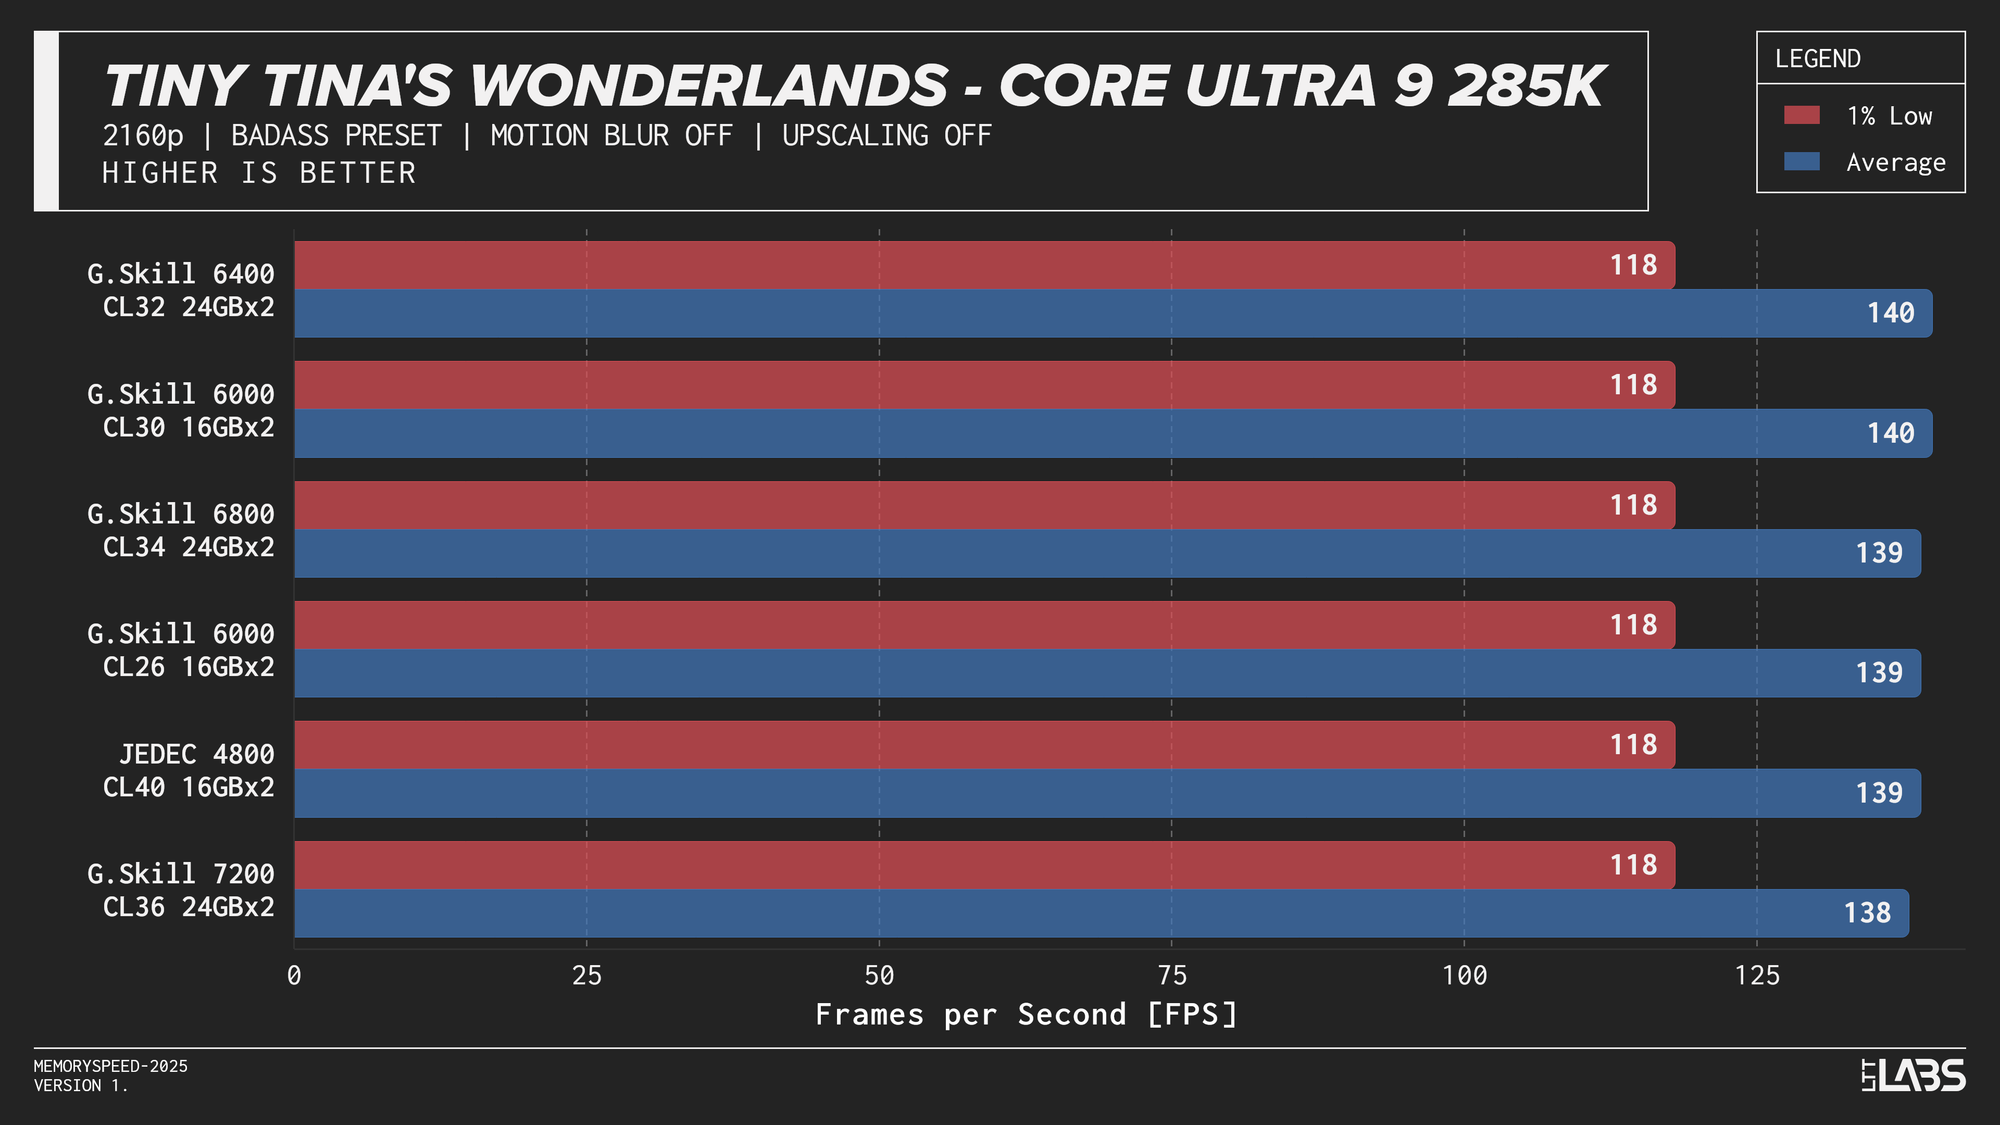
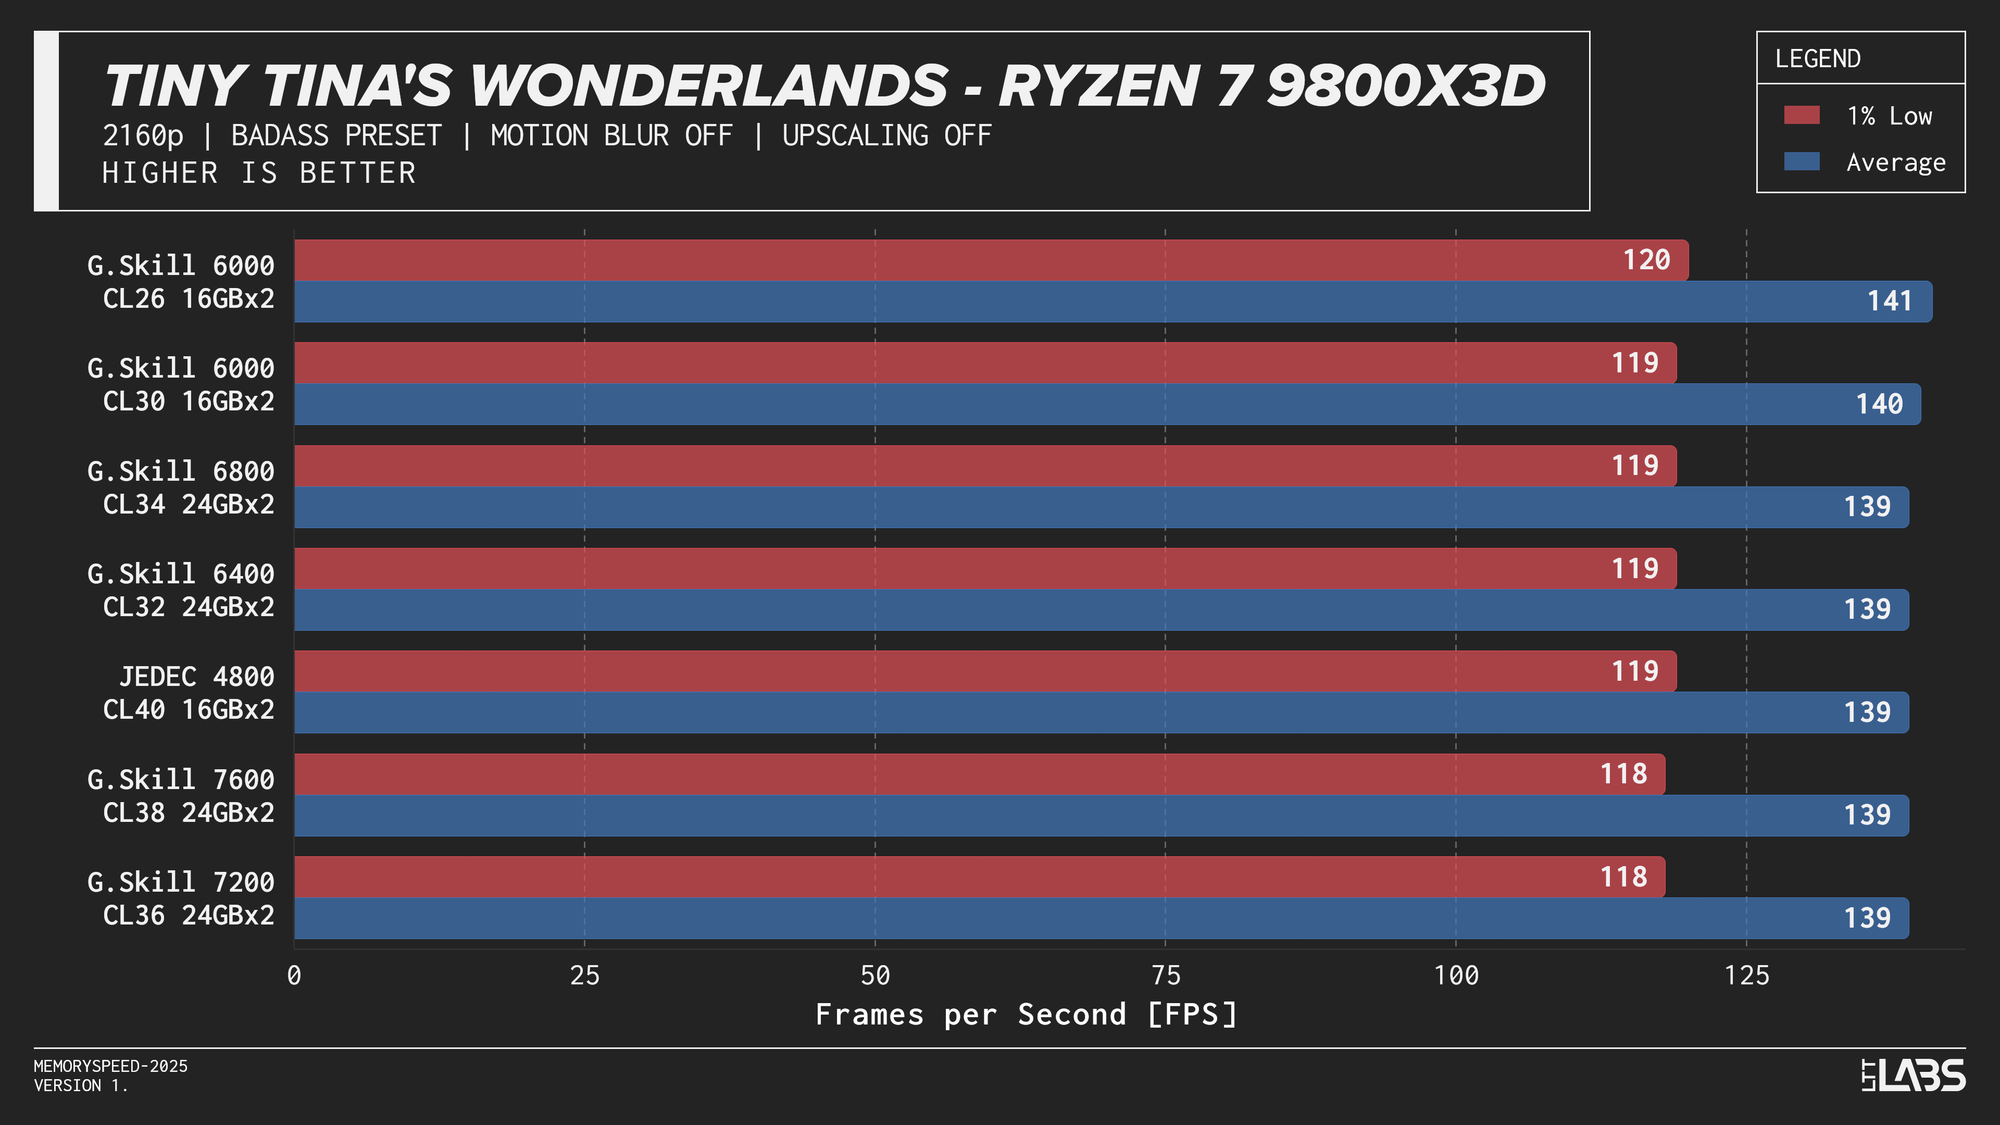
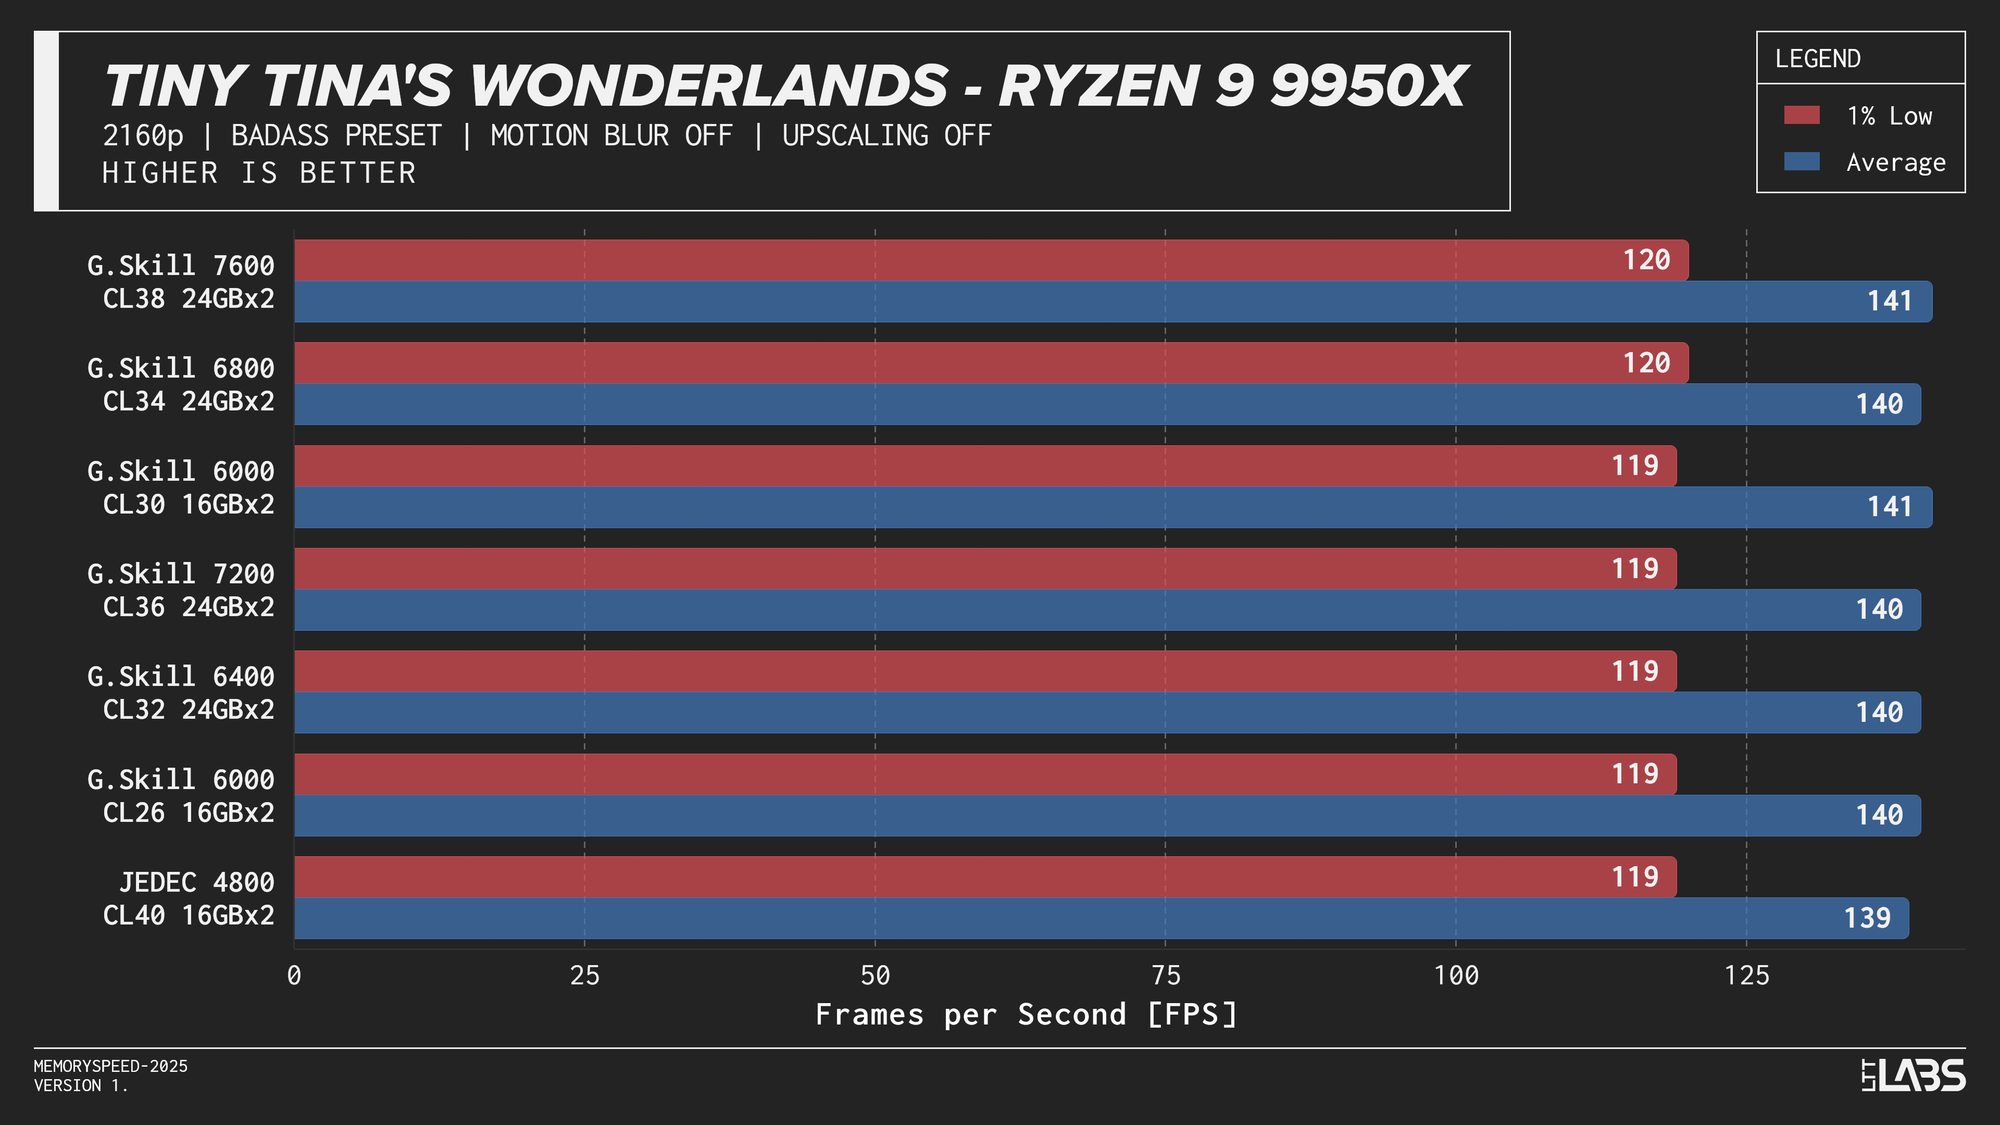
- Tiny Tina’s Wonderland: 1080p, 2160p
1080p
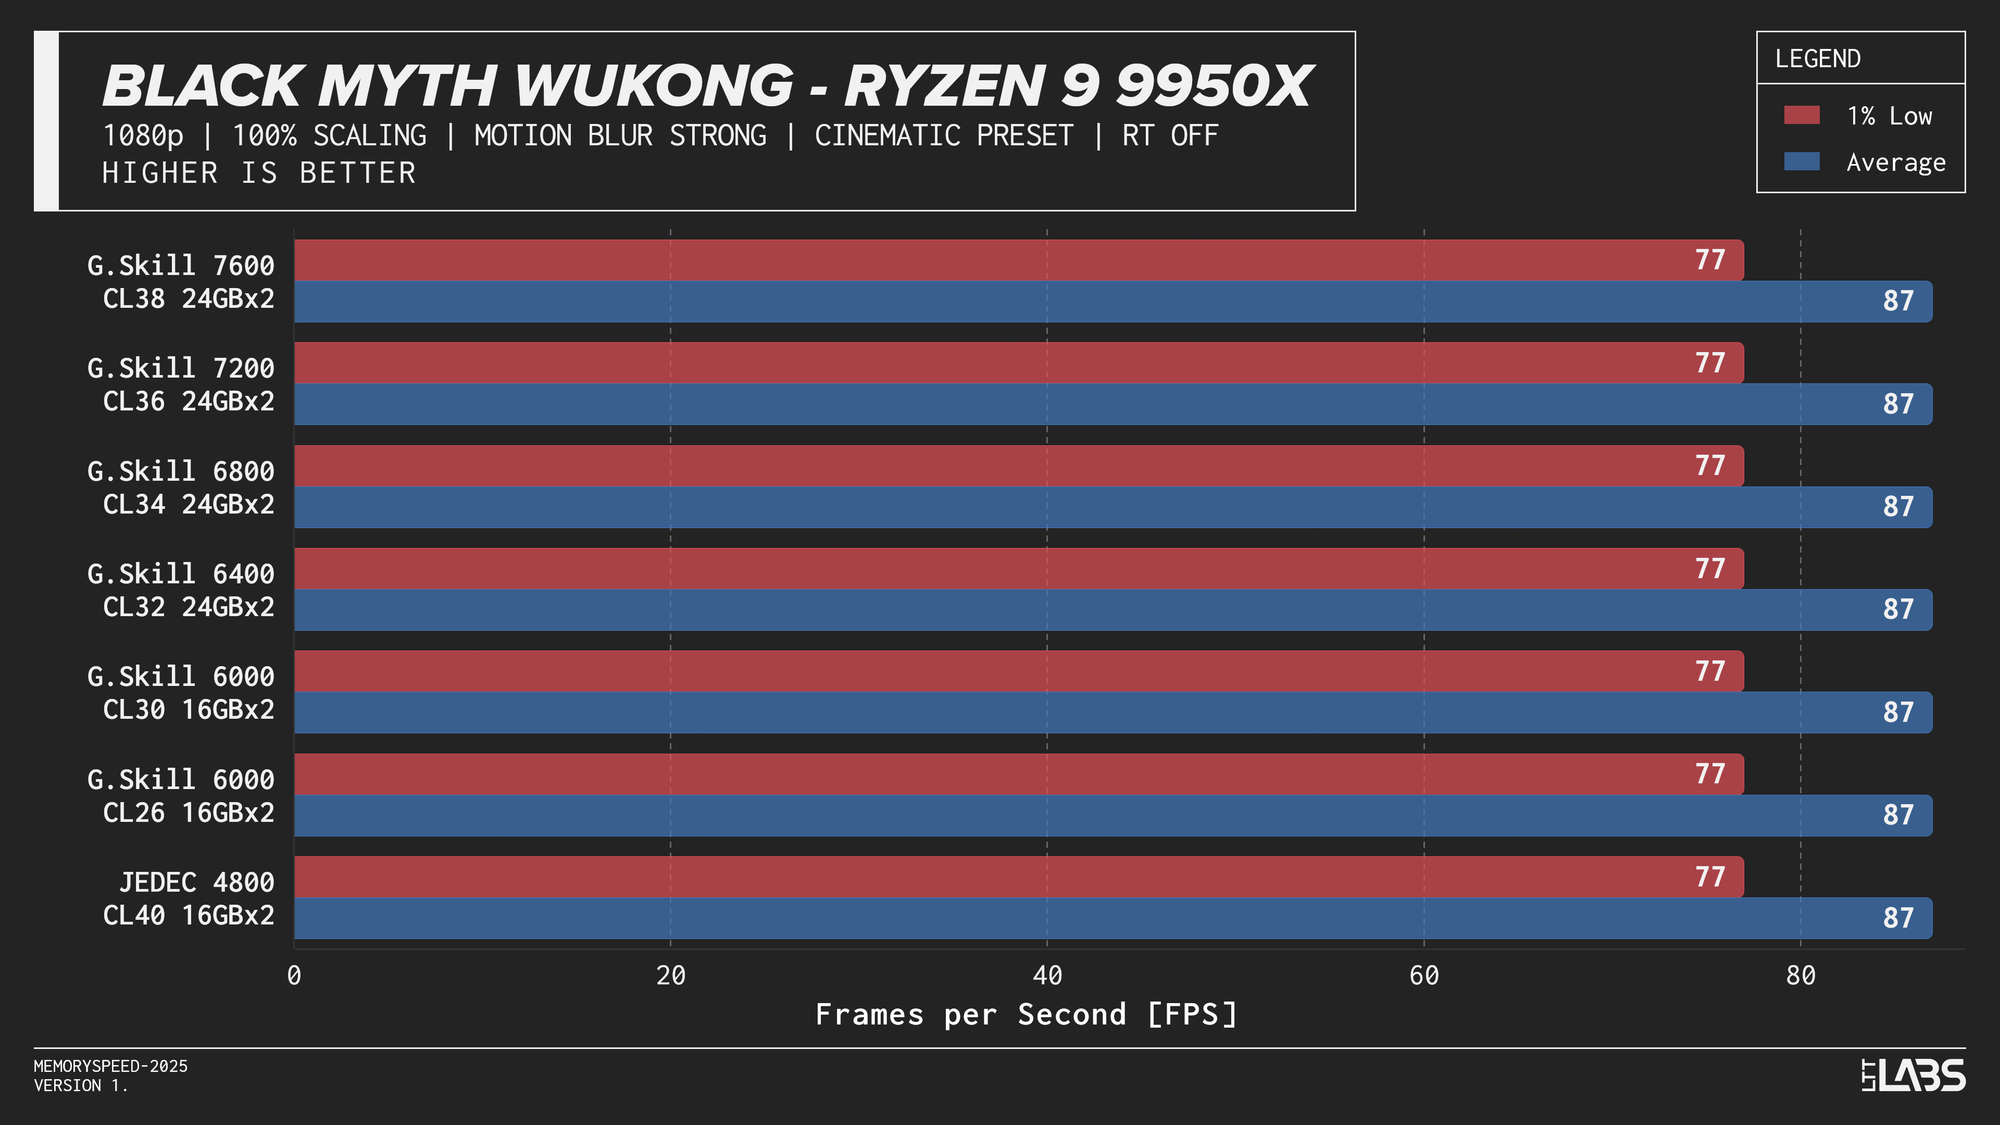
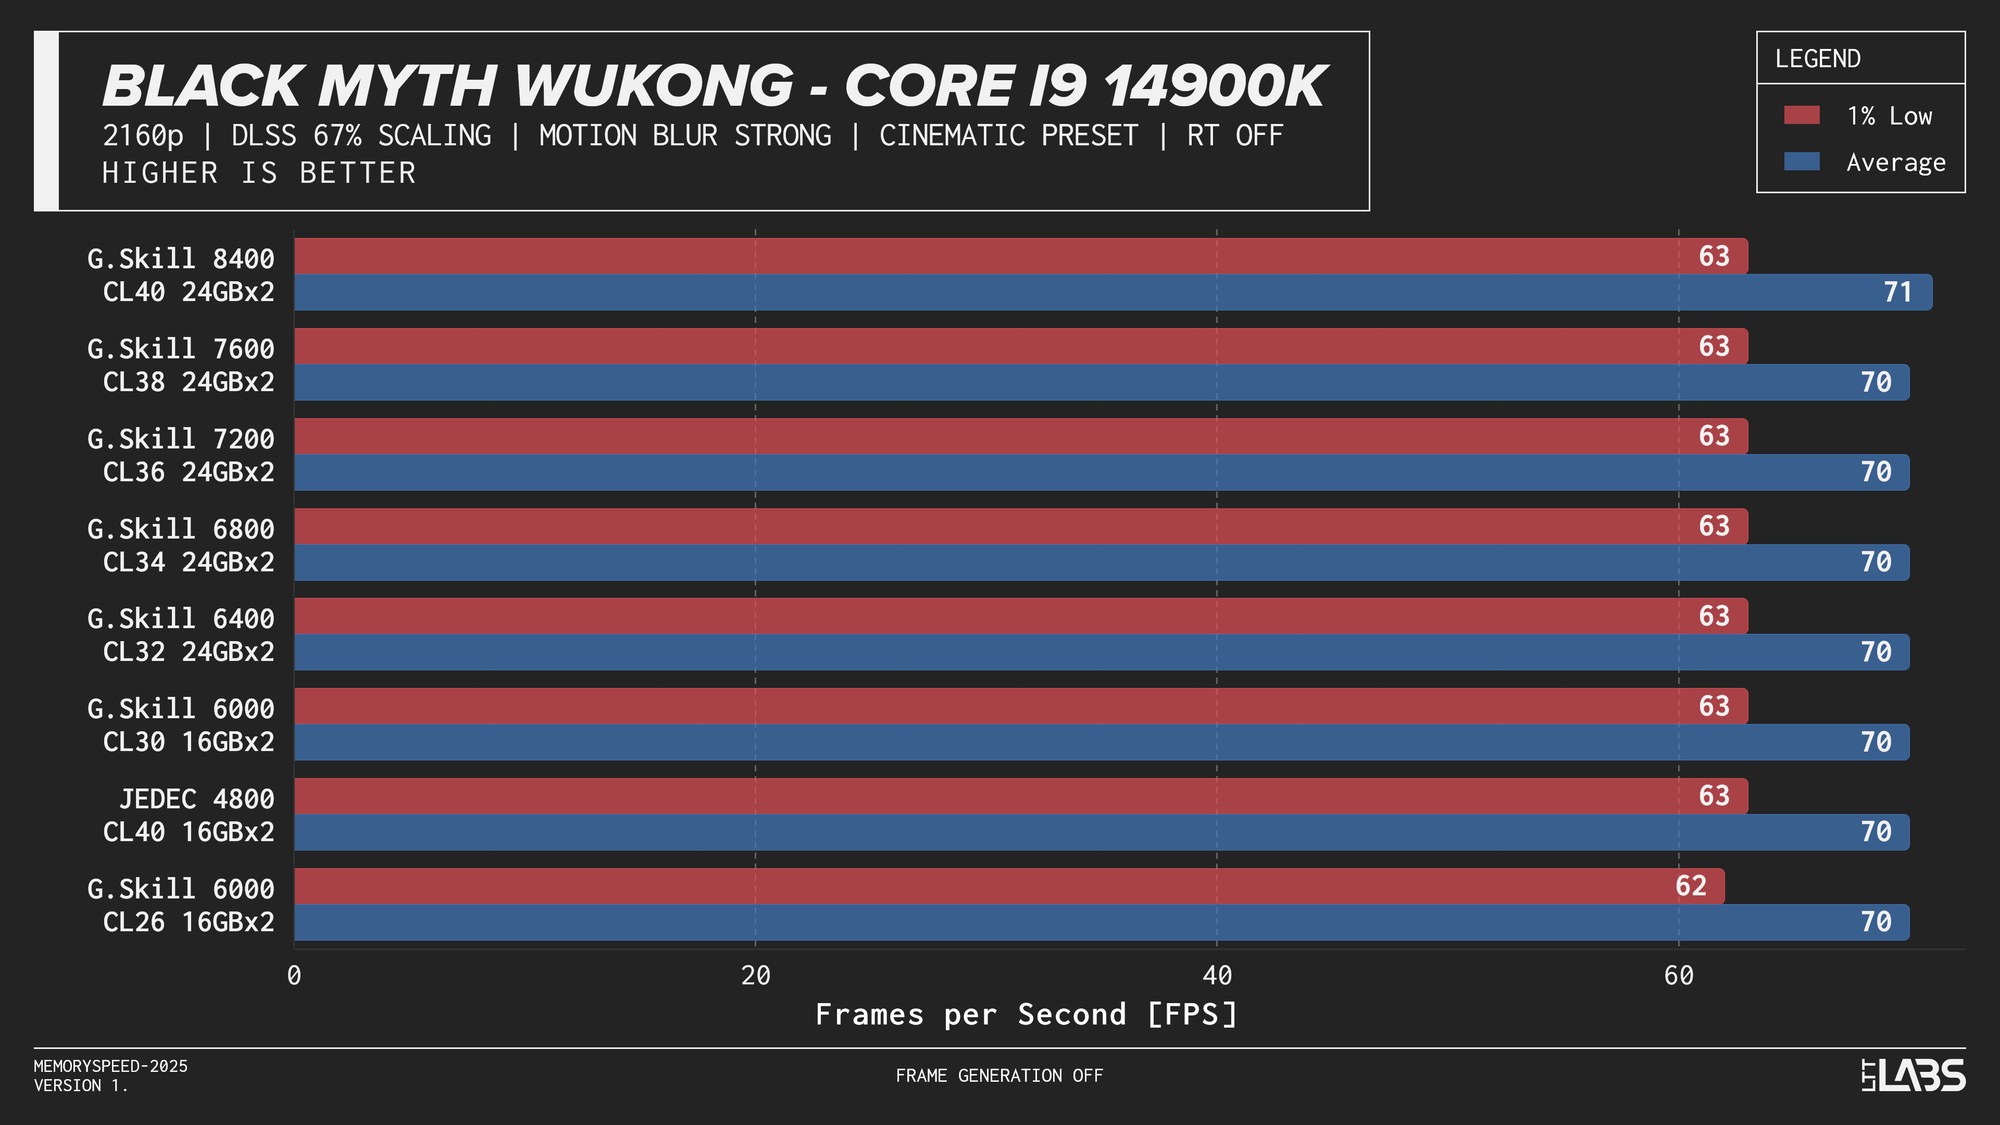
At 1080p, the GPU can often render frames faster than the CPU can prepare them. In these situations, performance is limited by how quickly the processor can handle game logic, issue draw calls, and move data through cache and memory. When the CPU becomes the bottleneck, memory latency and bandwidth can influence frame rates. This makes 1080p the best case for observing any performance differences between memory configurations, though gains are expected to be modest and workload-dependent. Black Myth: Wukong, being an exception, showed no difference across any memory speed configurations because the preset used makes the game primarily GPU-bound.
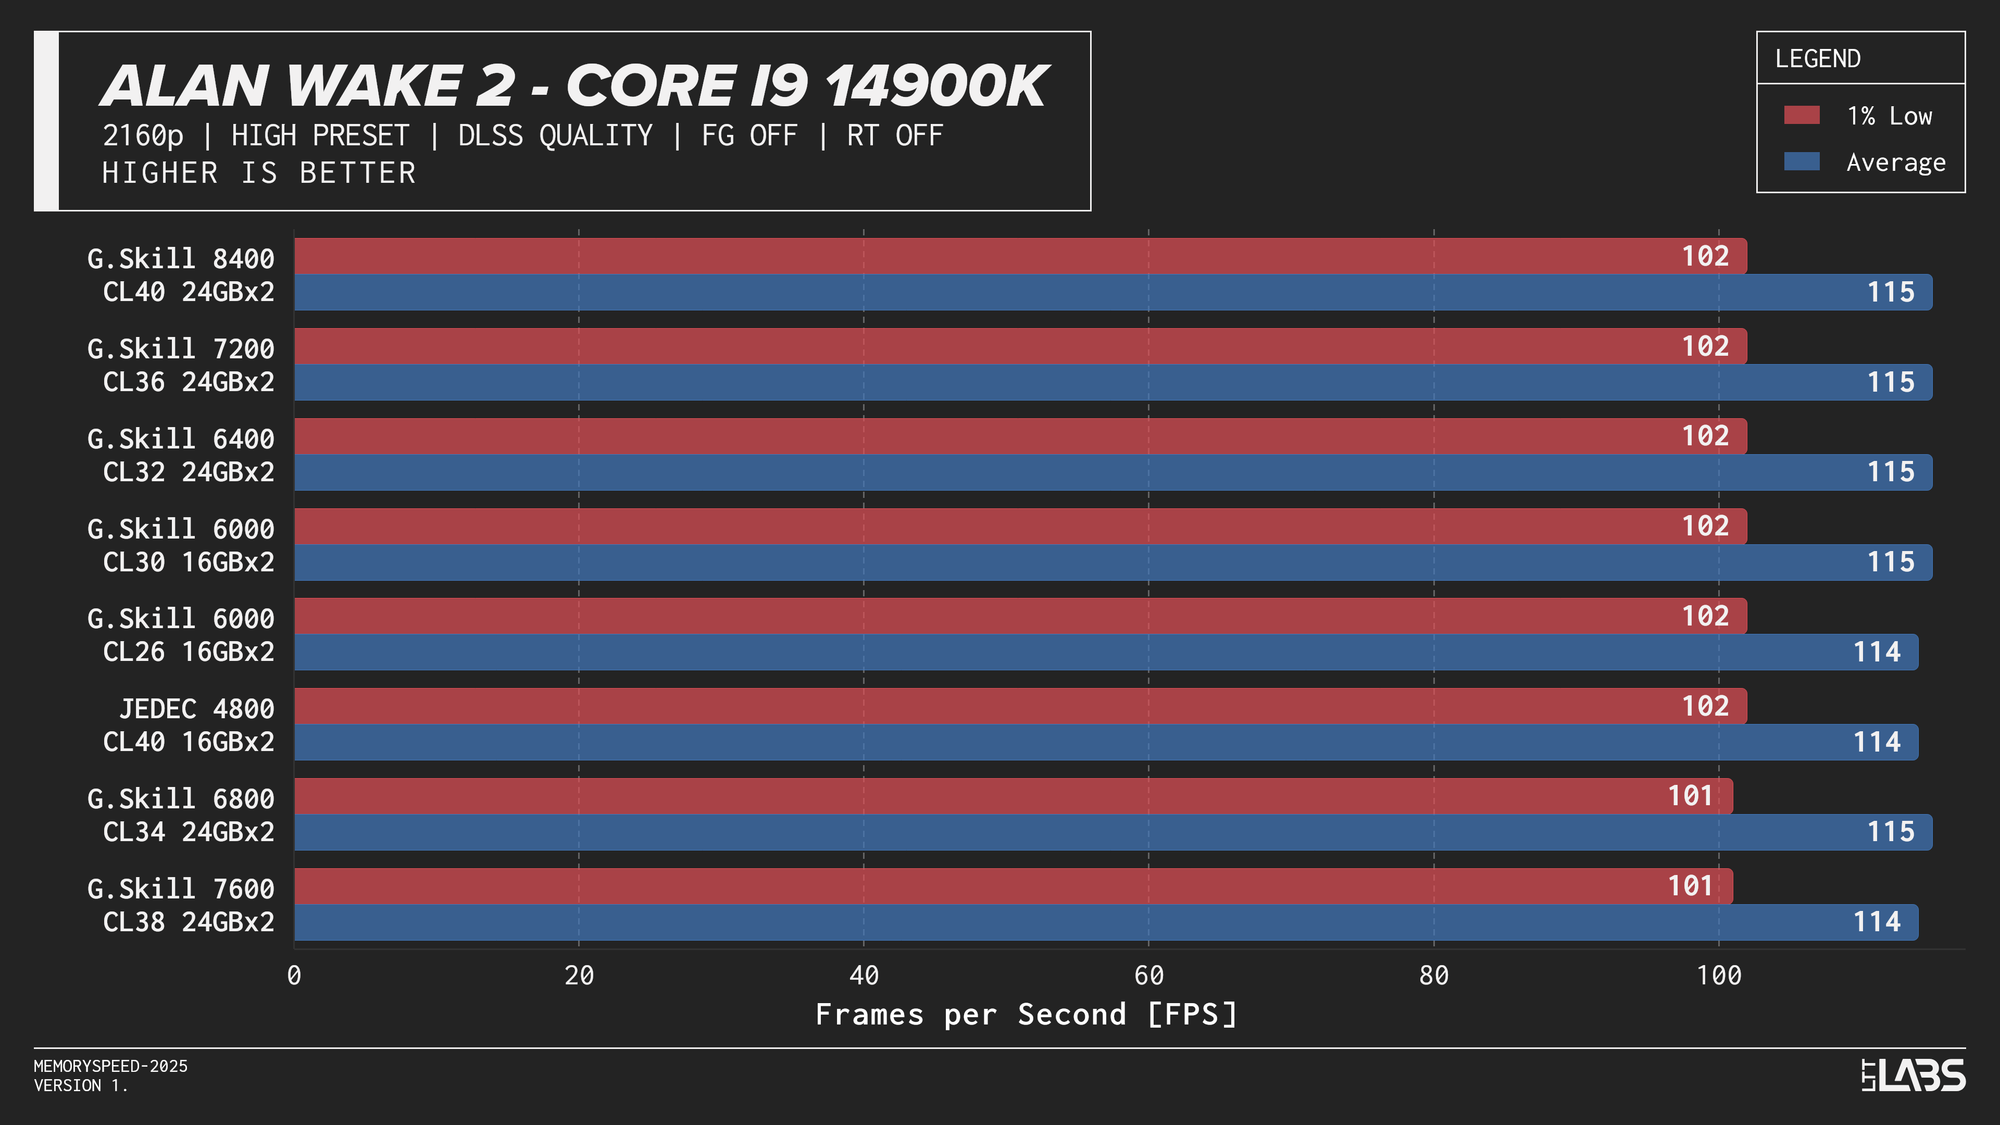
Core i9-14900K
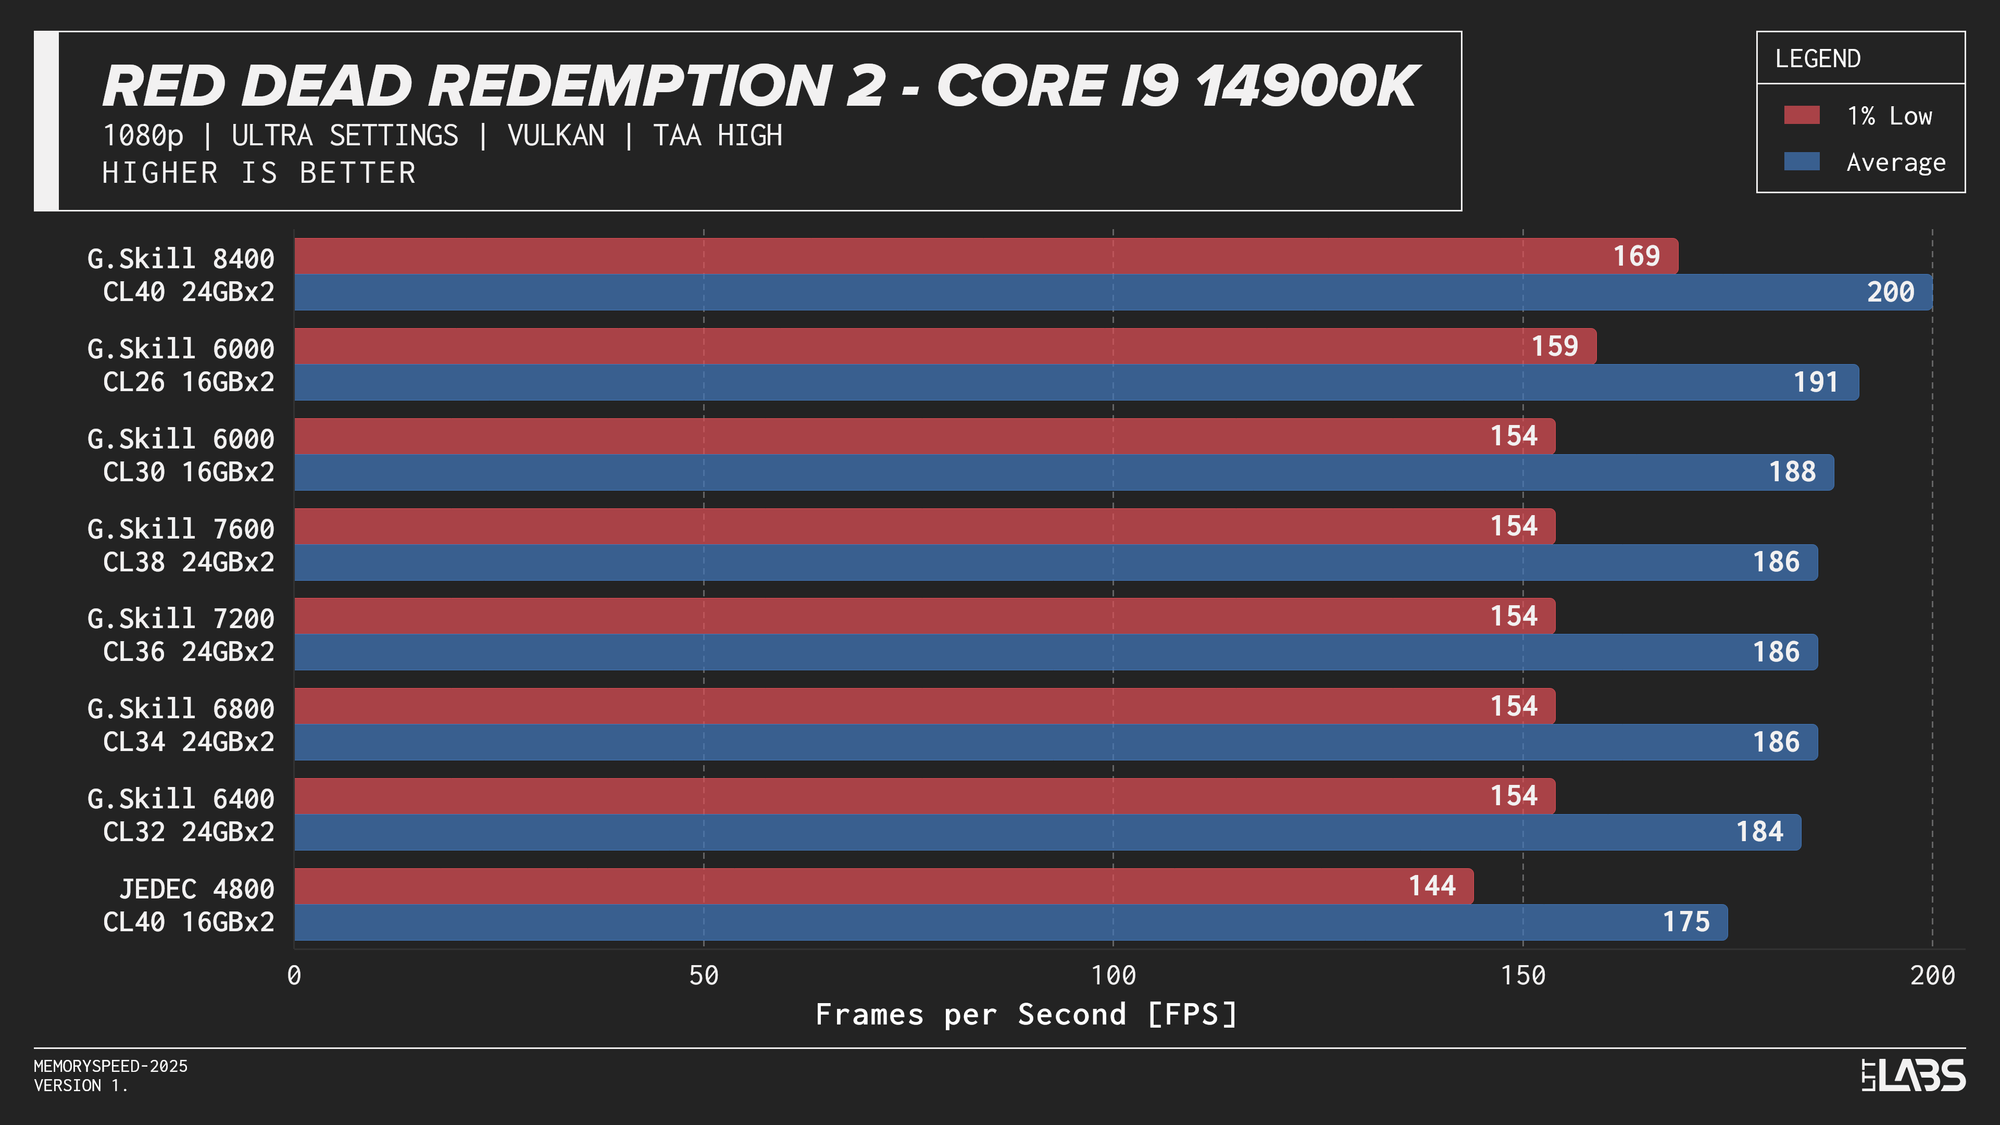

Core i9-14900K 1080p
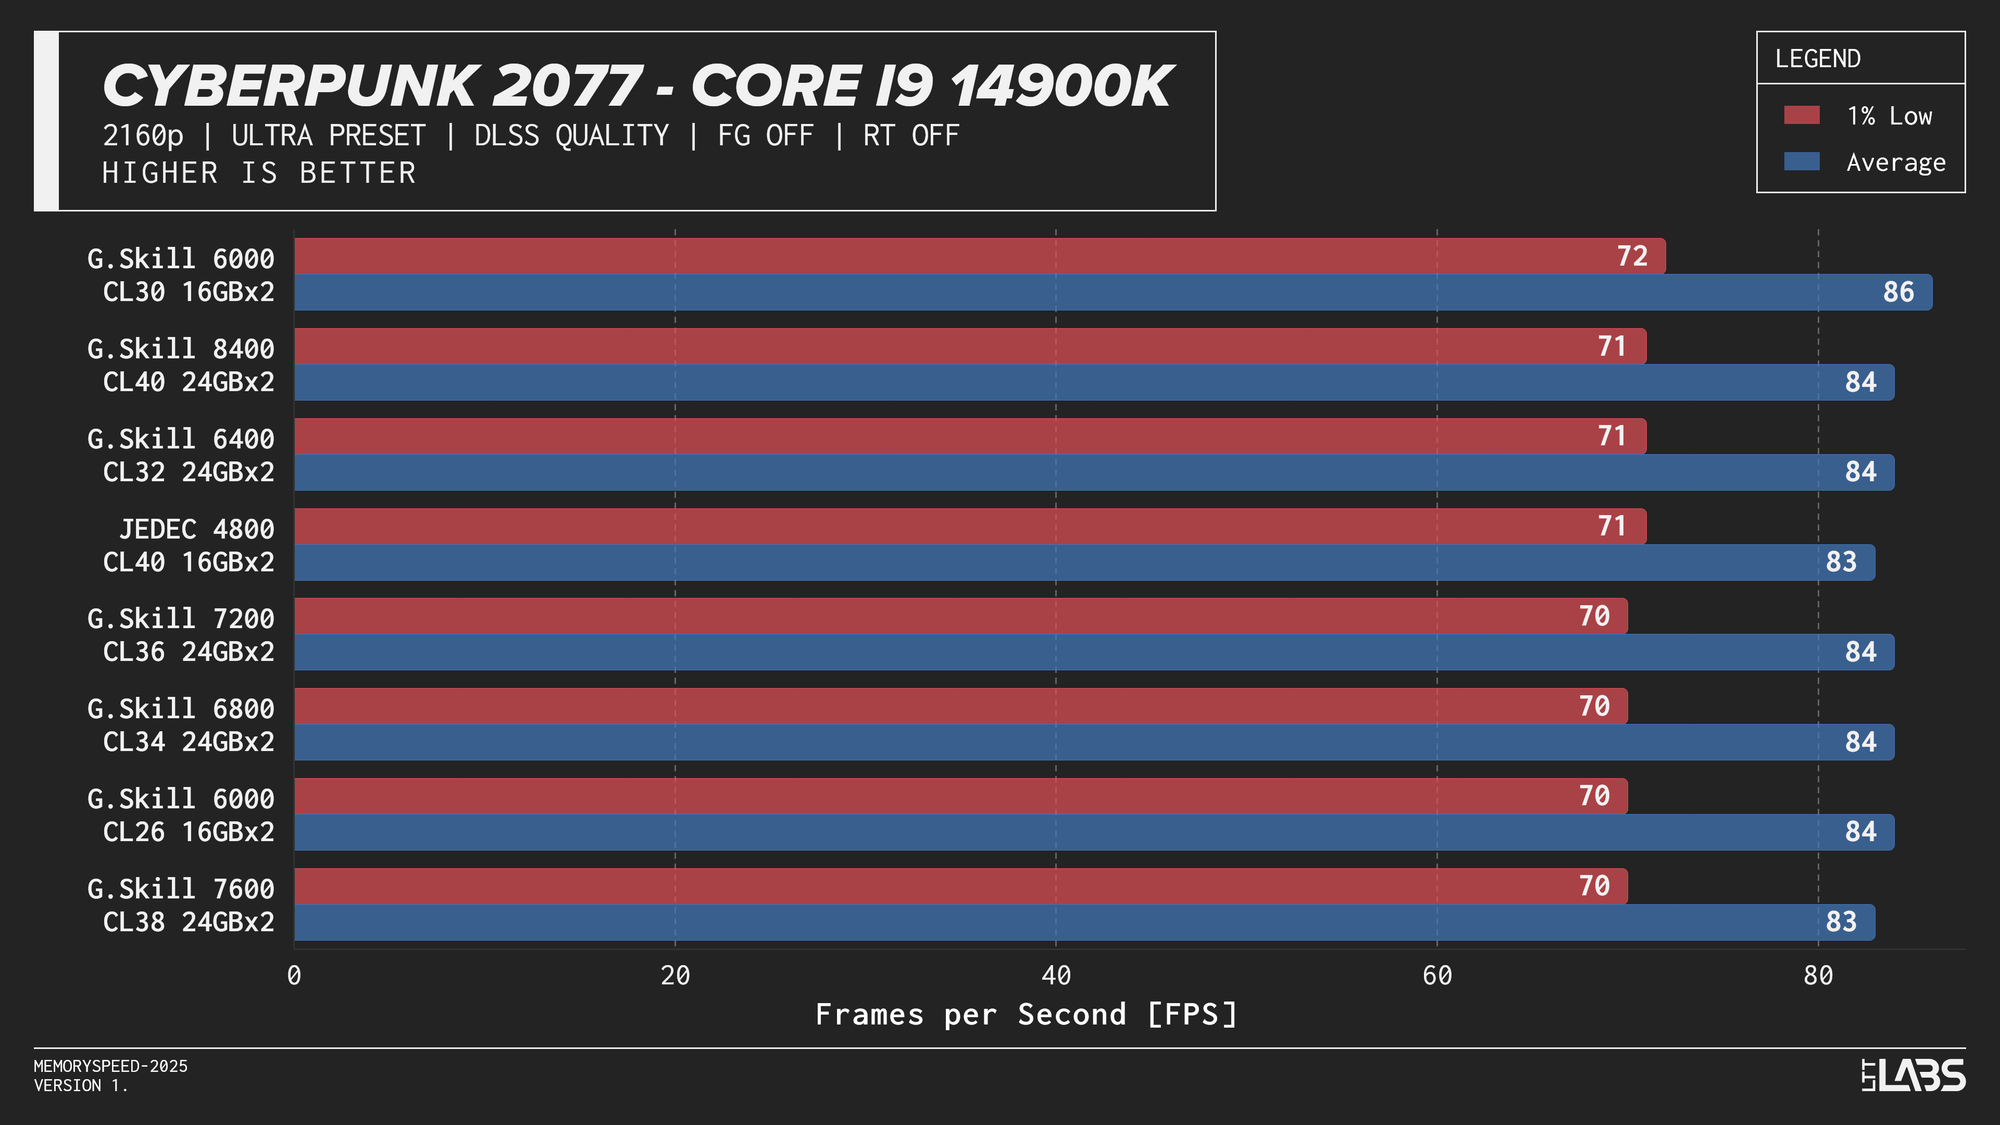
The 14900K showed the most memory sensitivity, but the effect was concentrated in a few titles. The largest scaling was observed in Cyberpunk 2077, Ashes of the Singularity: Escalation, and Red Dead Redemption 2, where moving from JEDEC to tuned memory produced measurable gains. Most other games showed only small differences, with performance largely plateauing around 6000–6800 MT/s. The 8400 MT/s configuration produced the highest results in some games (~5%) as one might expect, but the performance advantage can only be justified if you are a pro gamer and want to maximize the FPS in a given game.
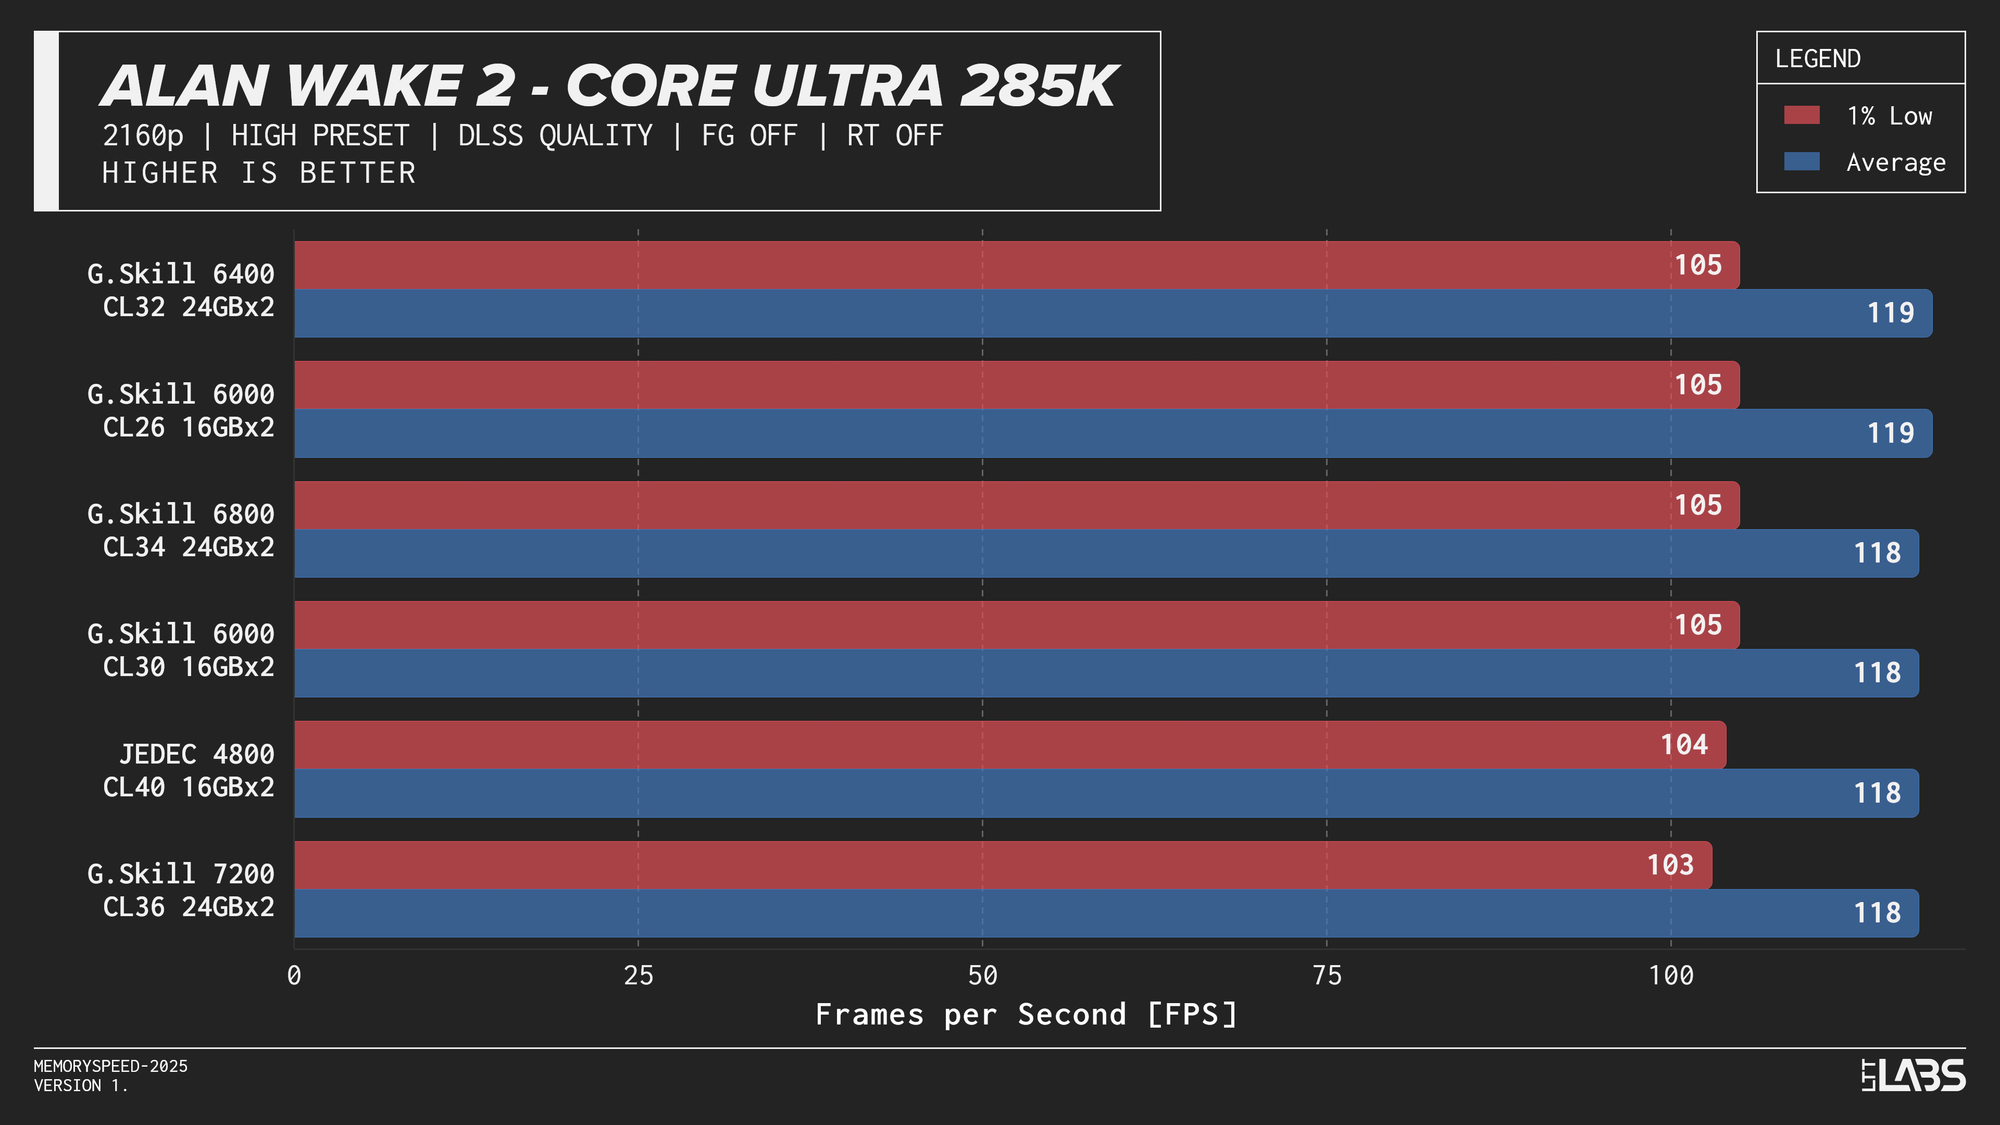
Core Ultra 9 285K
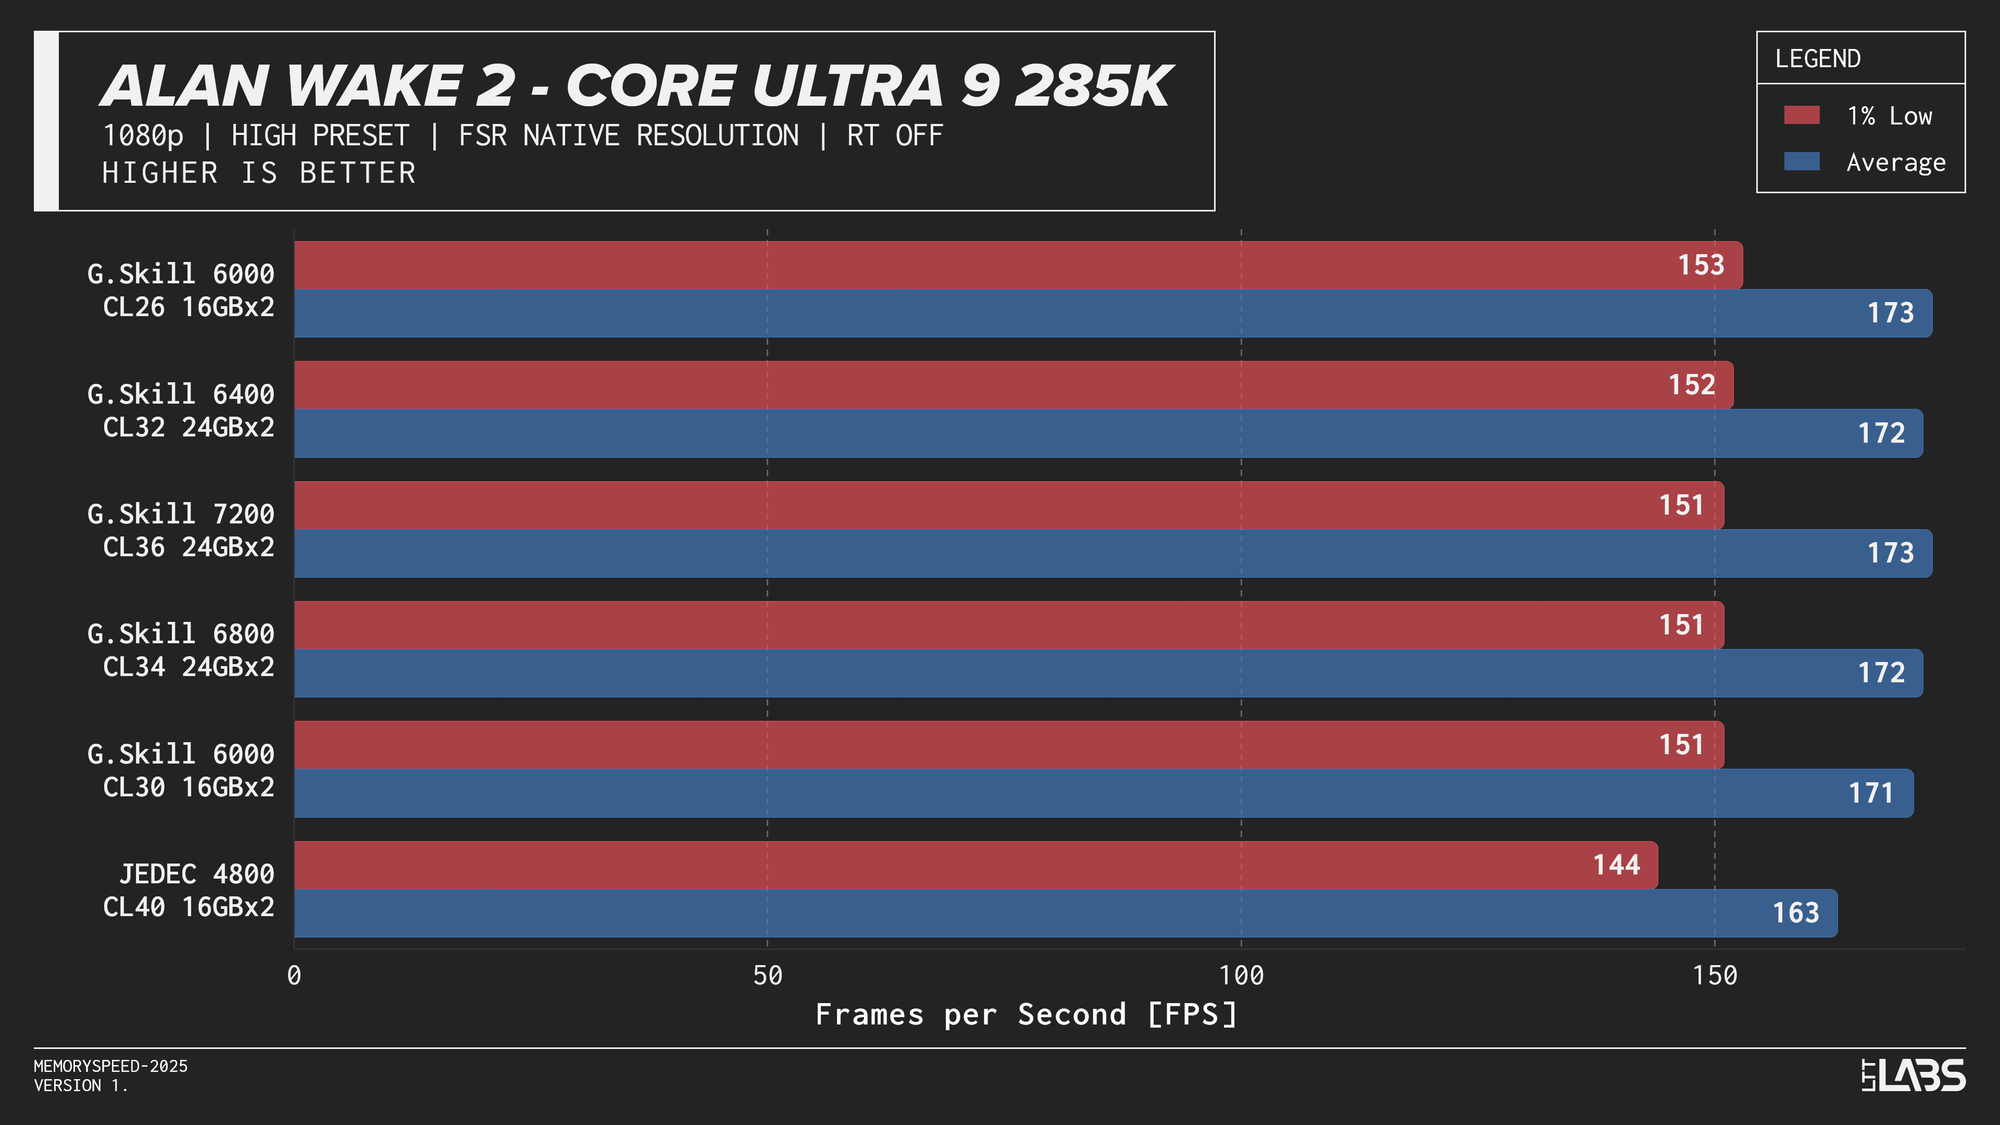
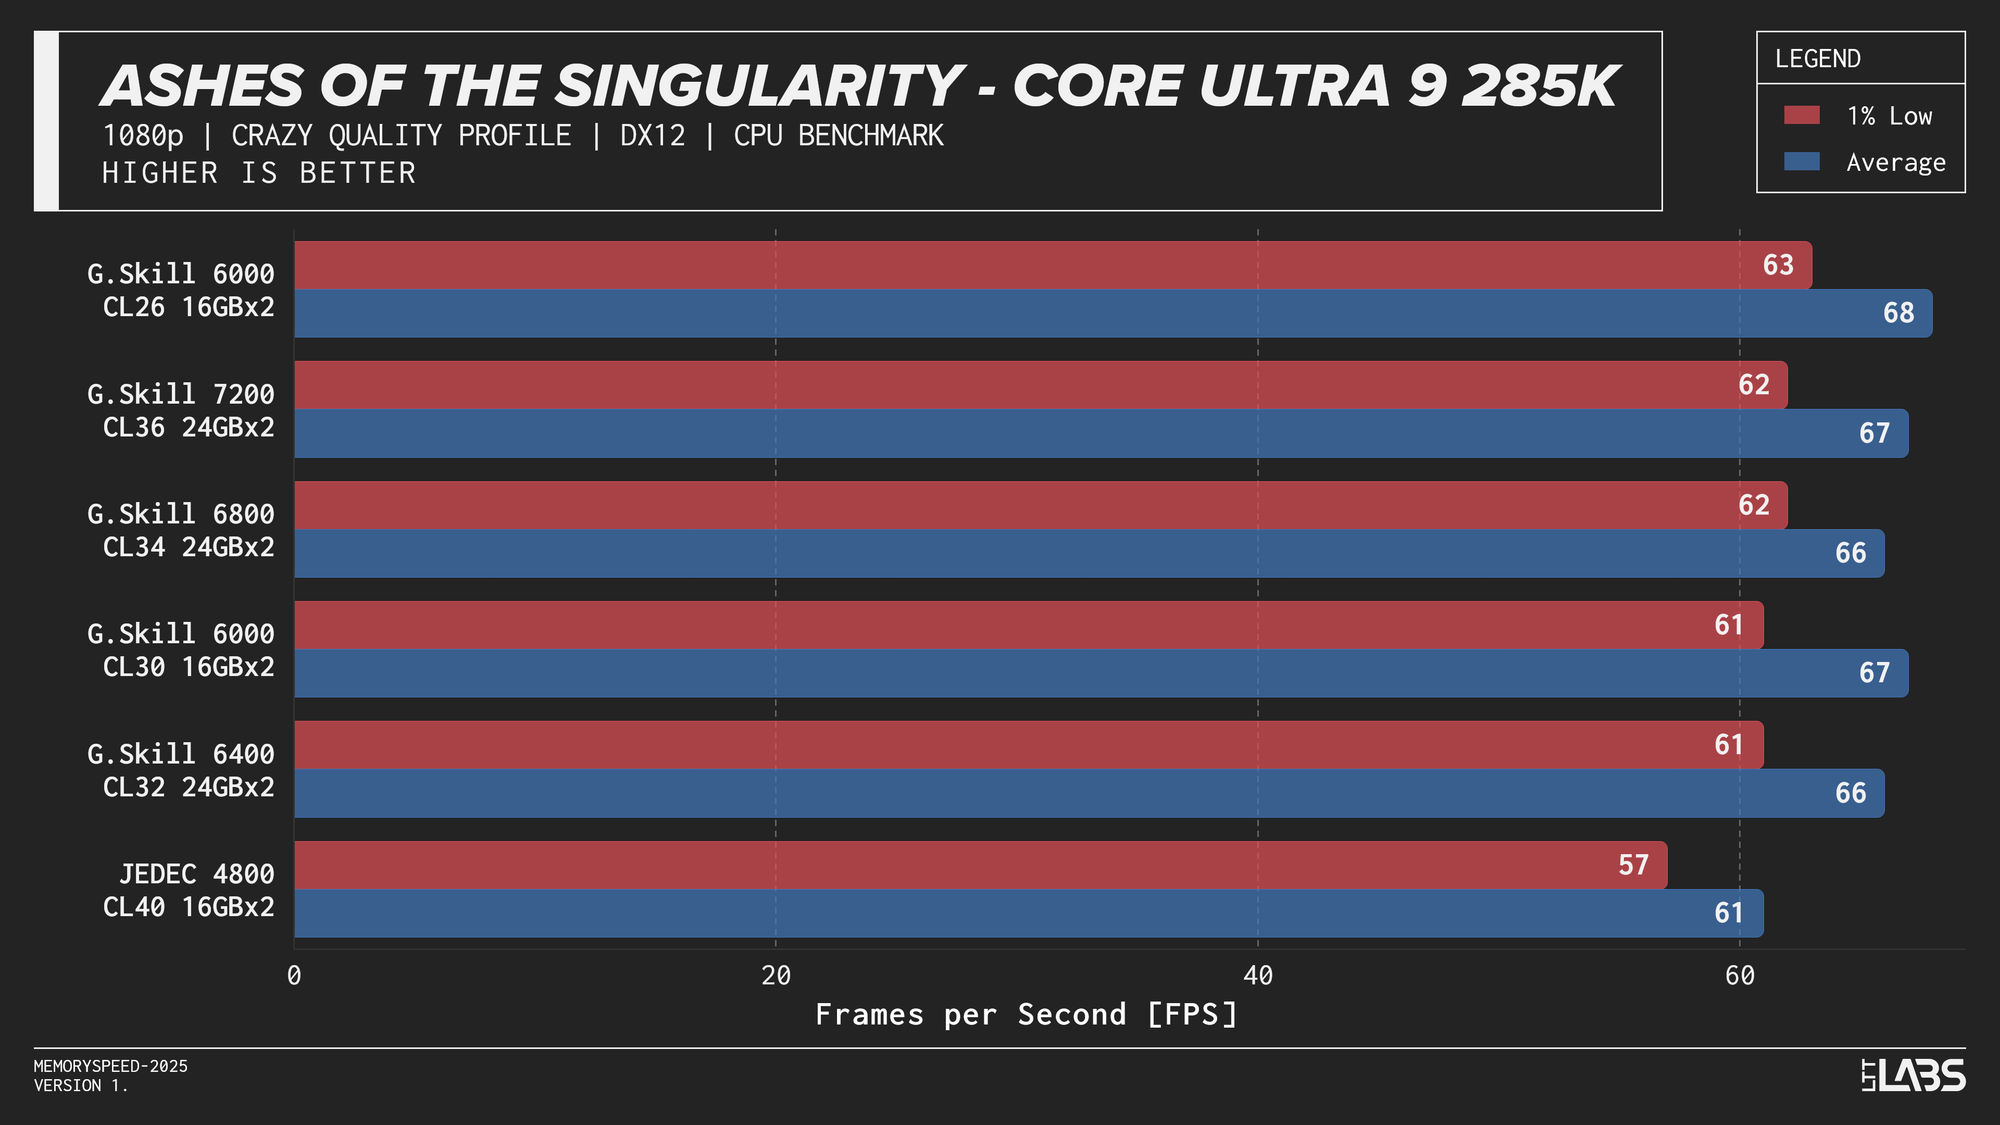
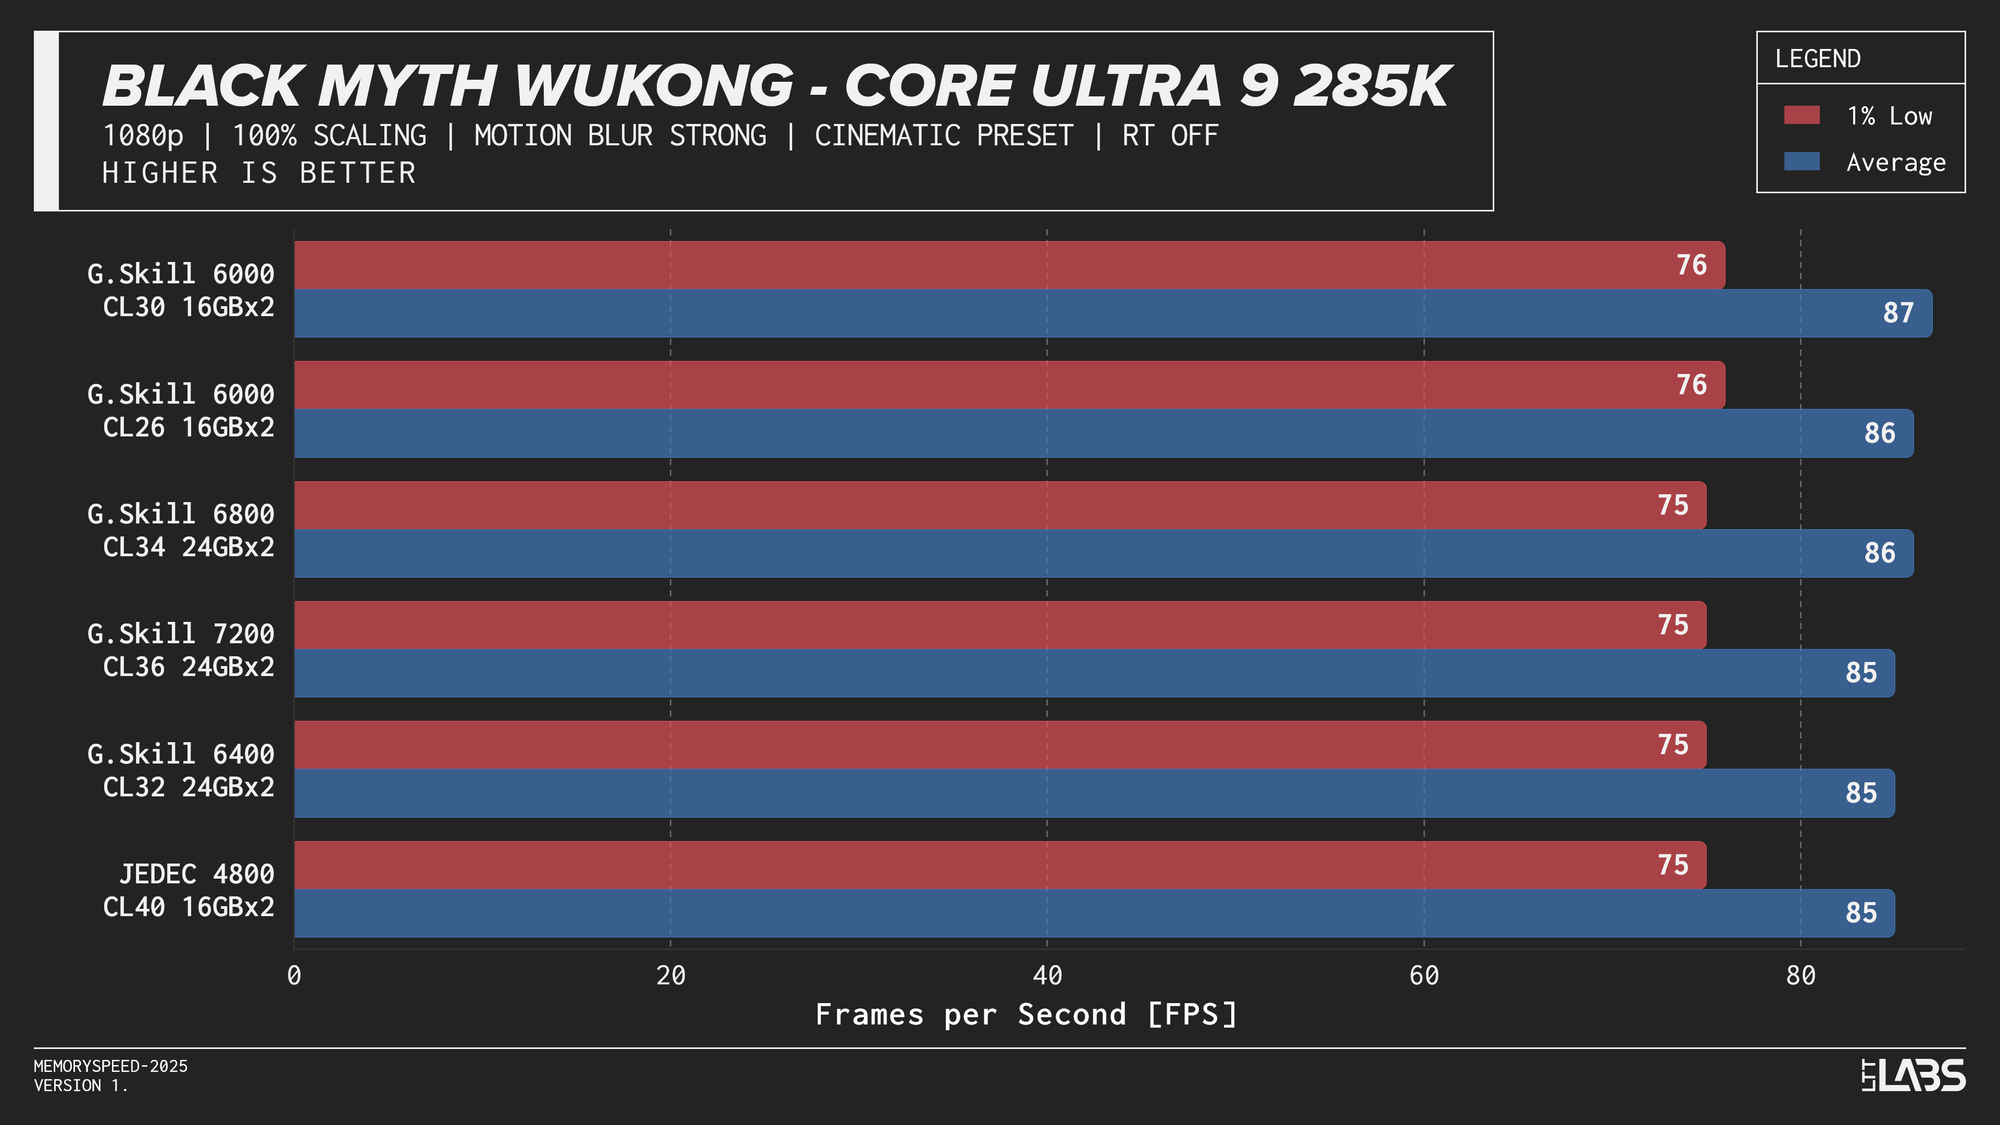
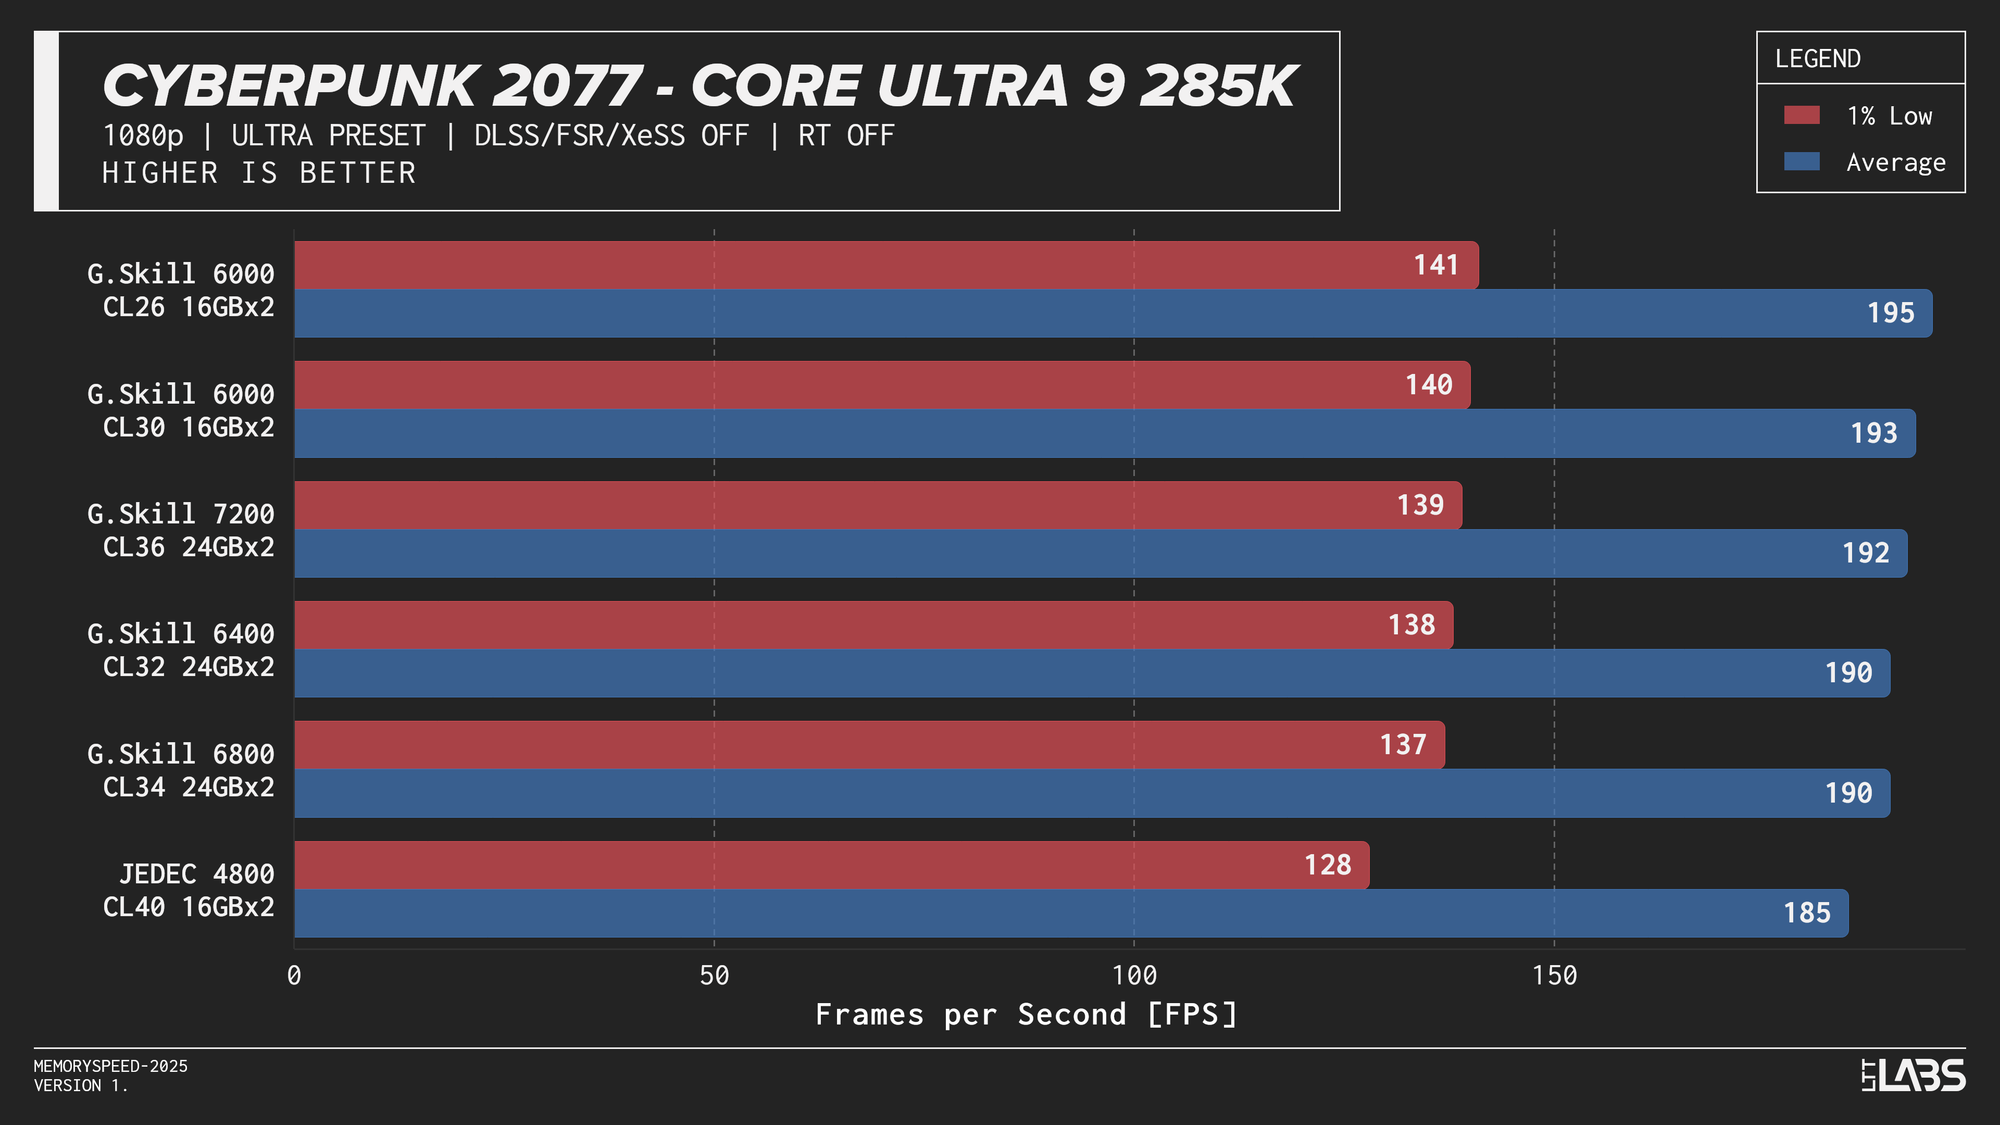
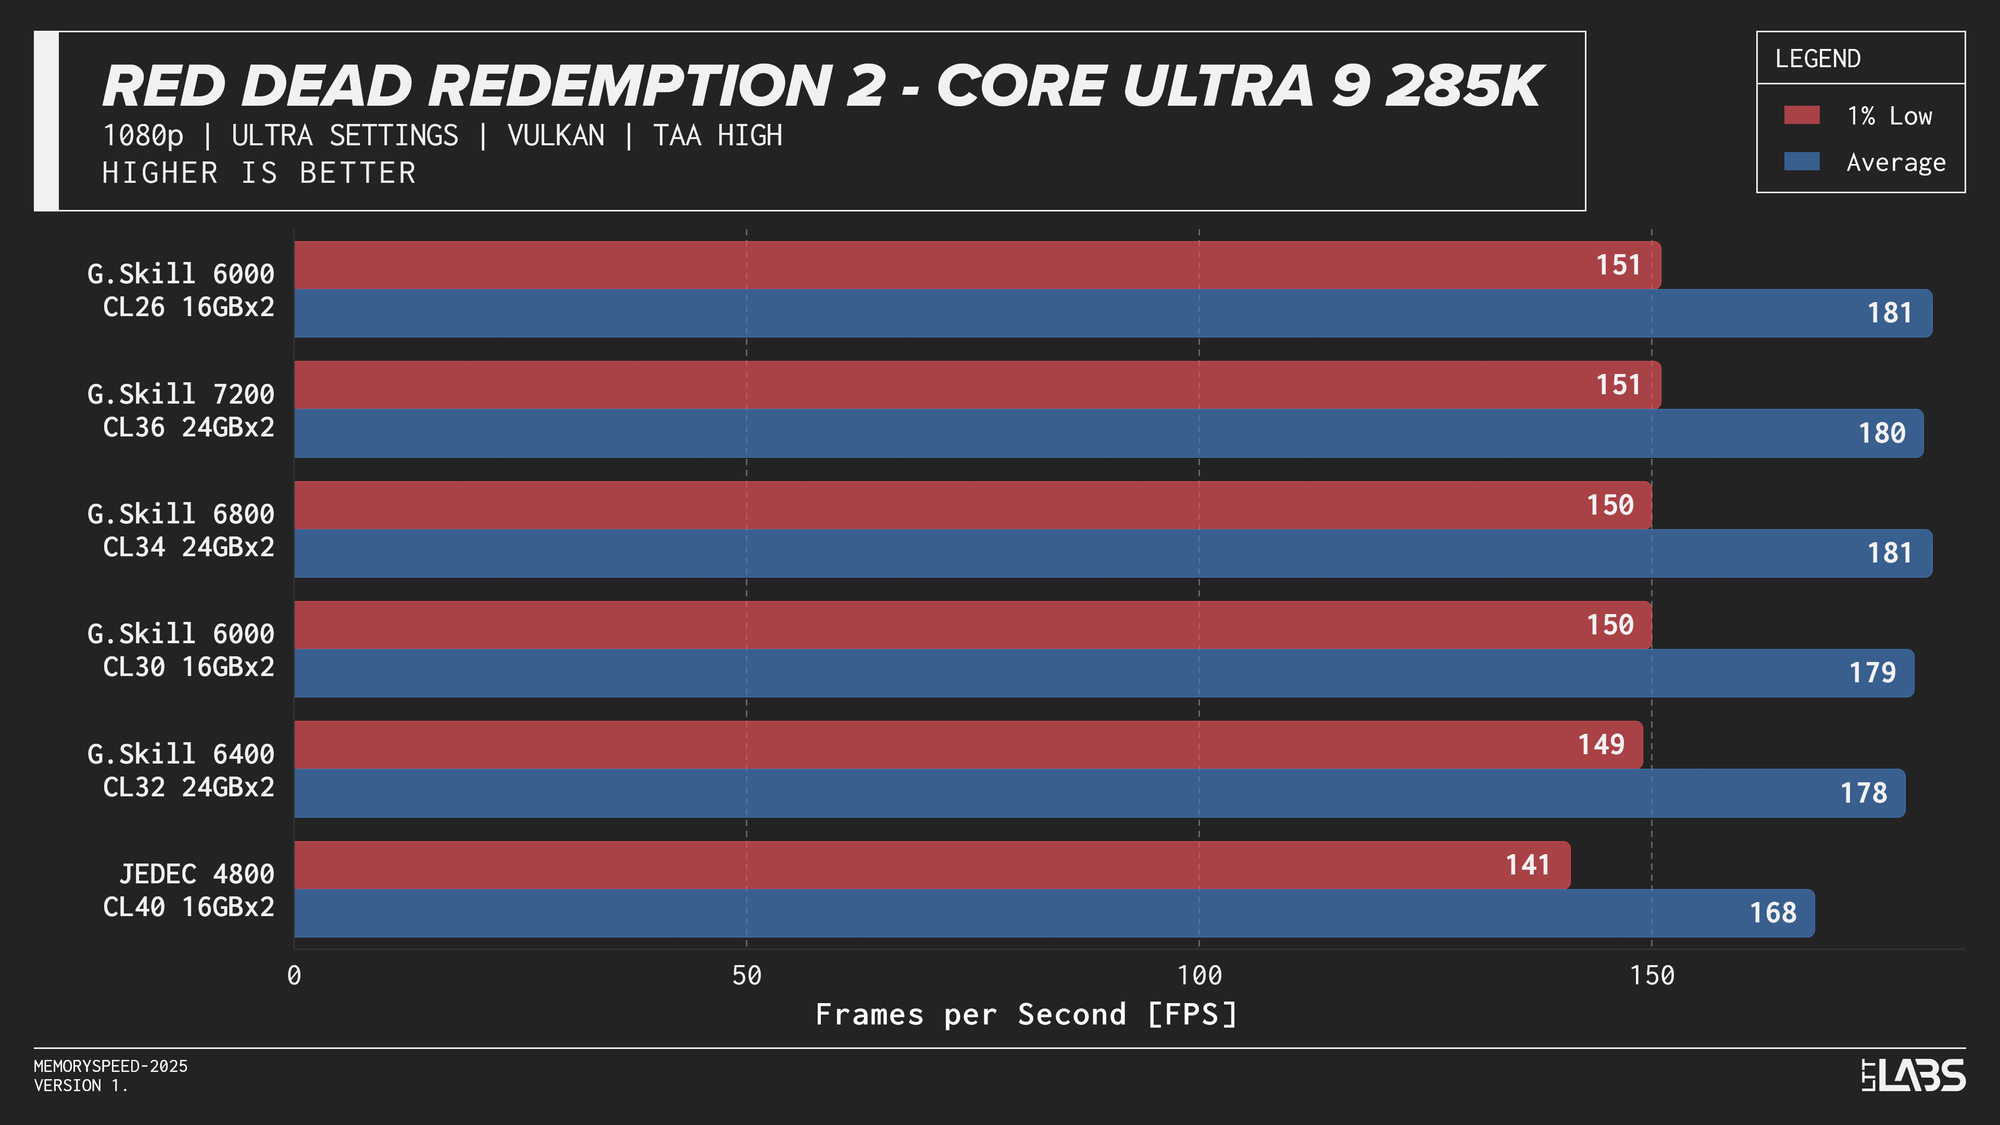
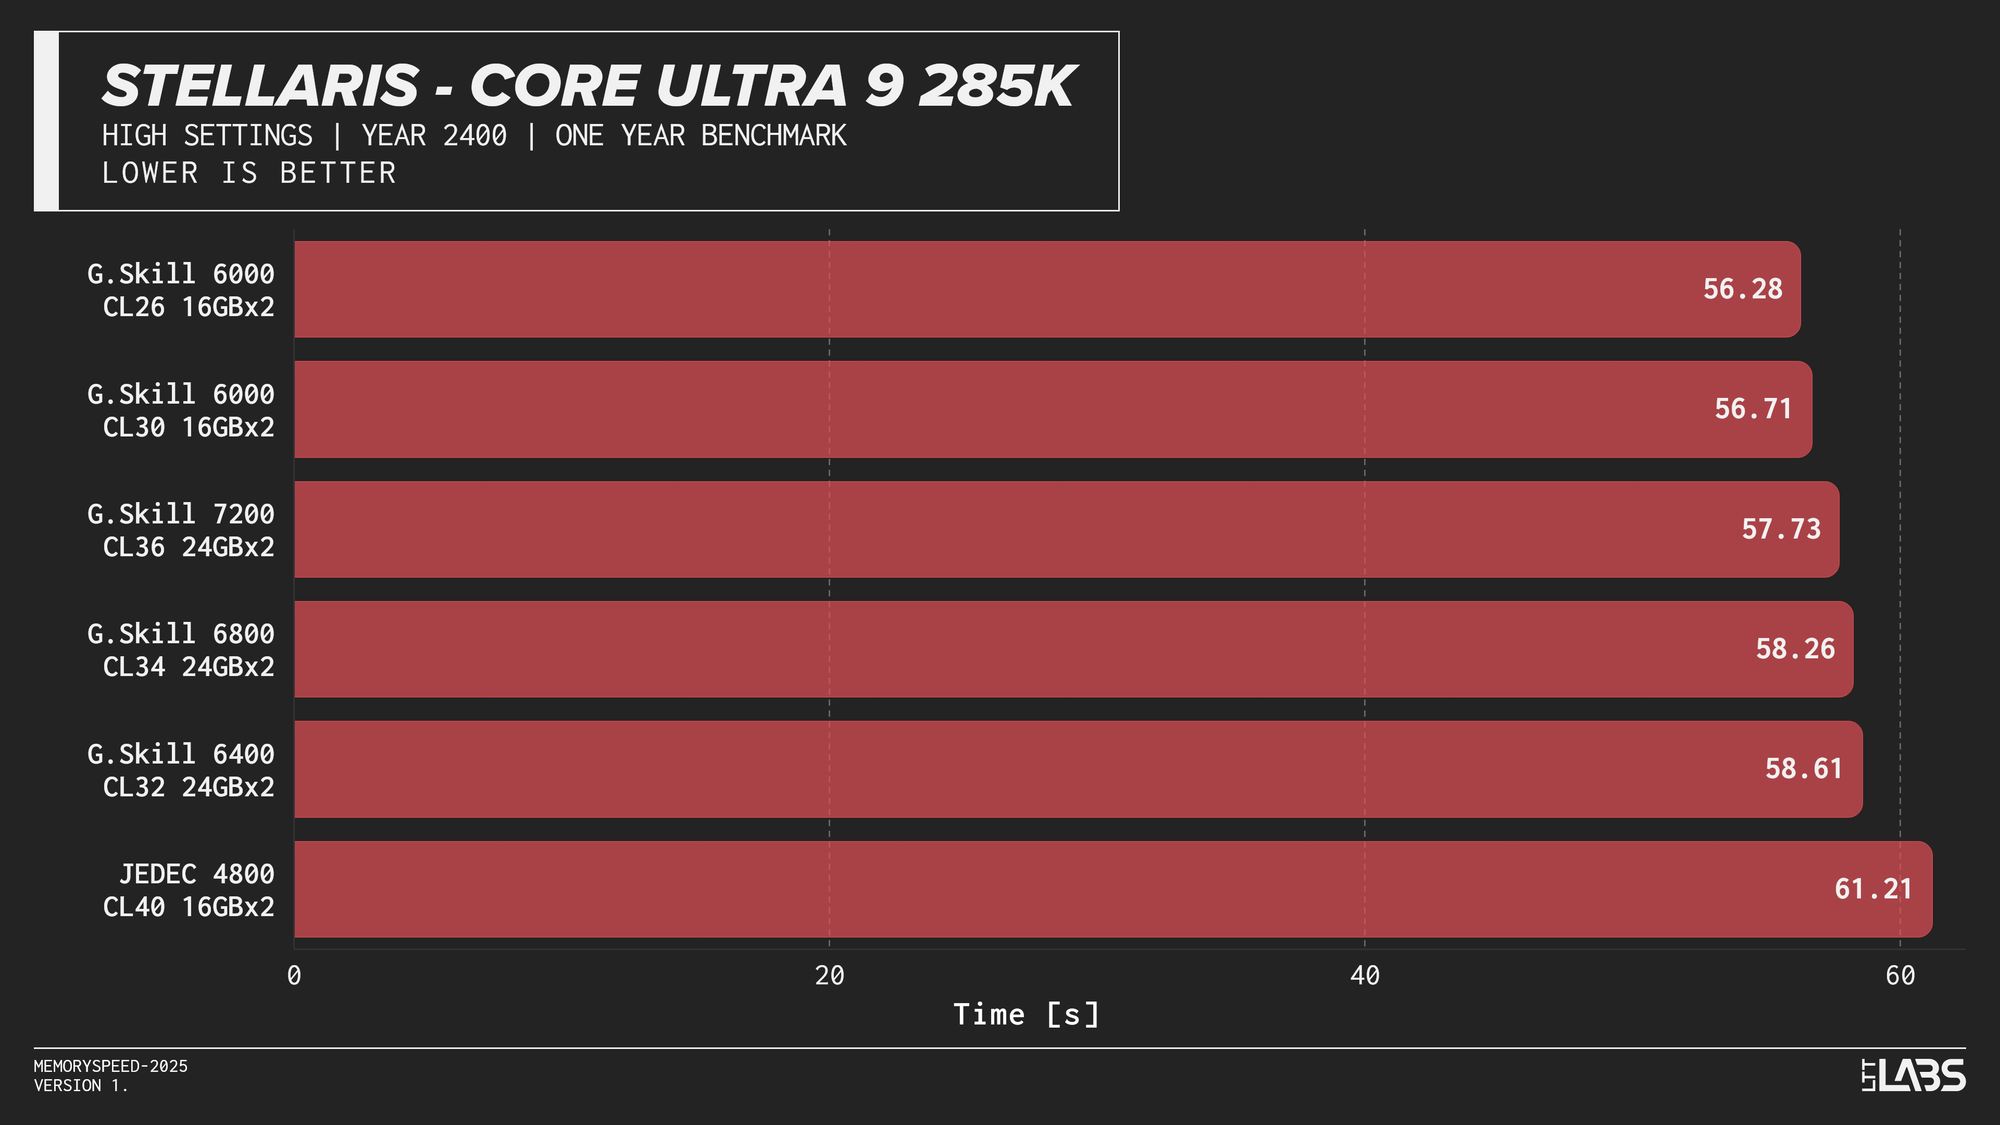
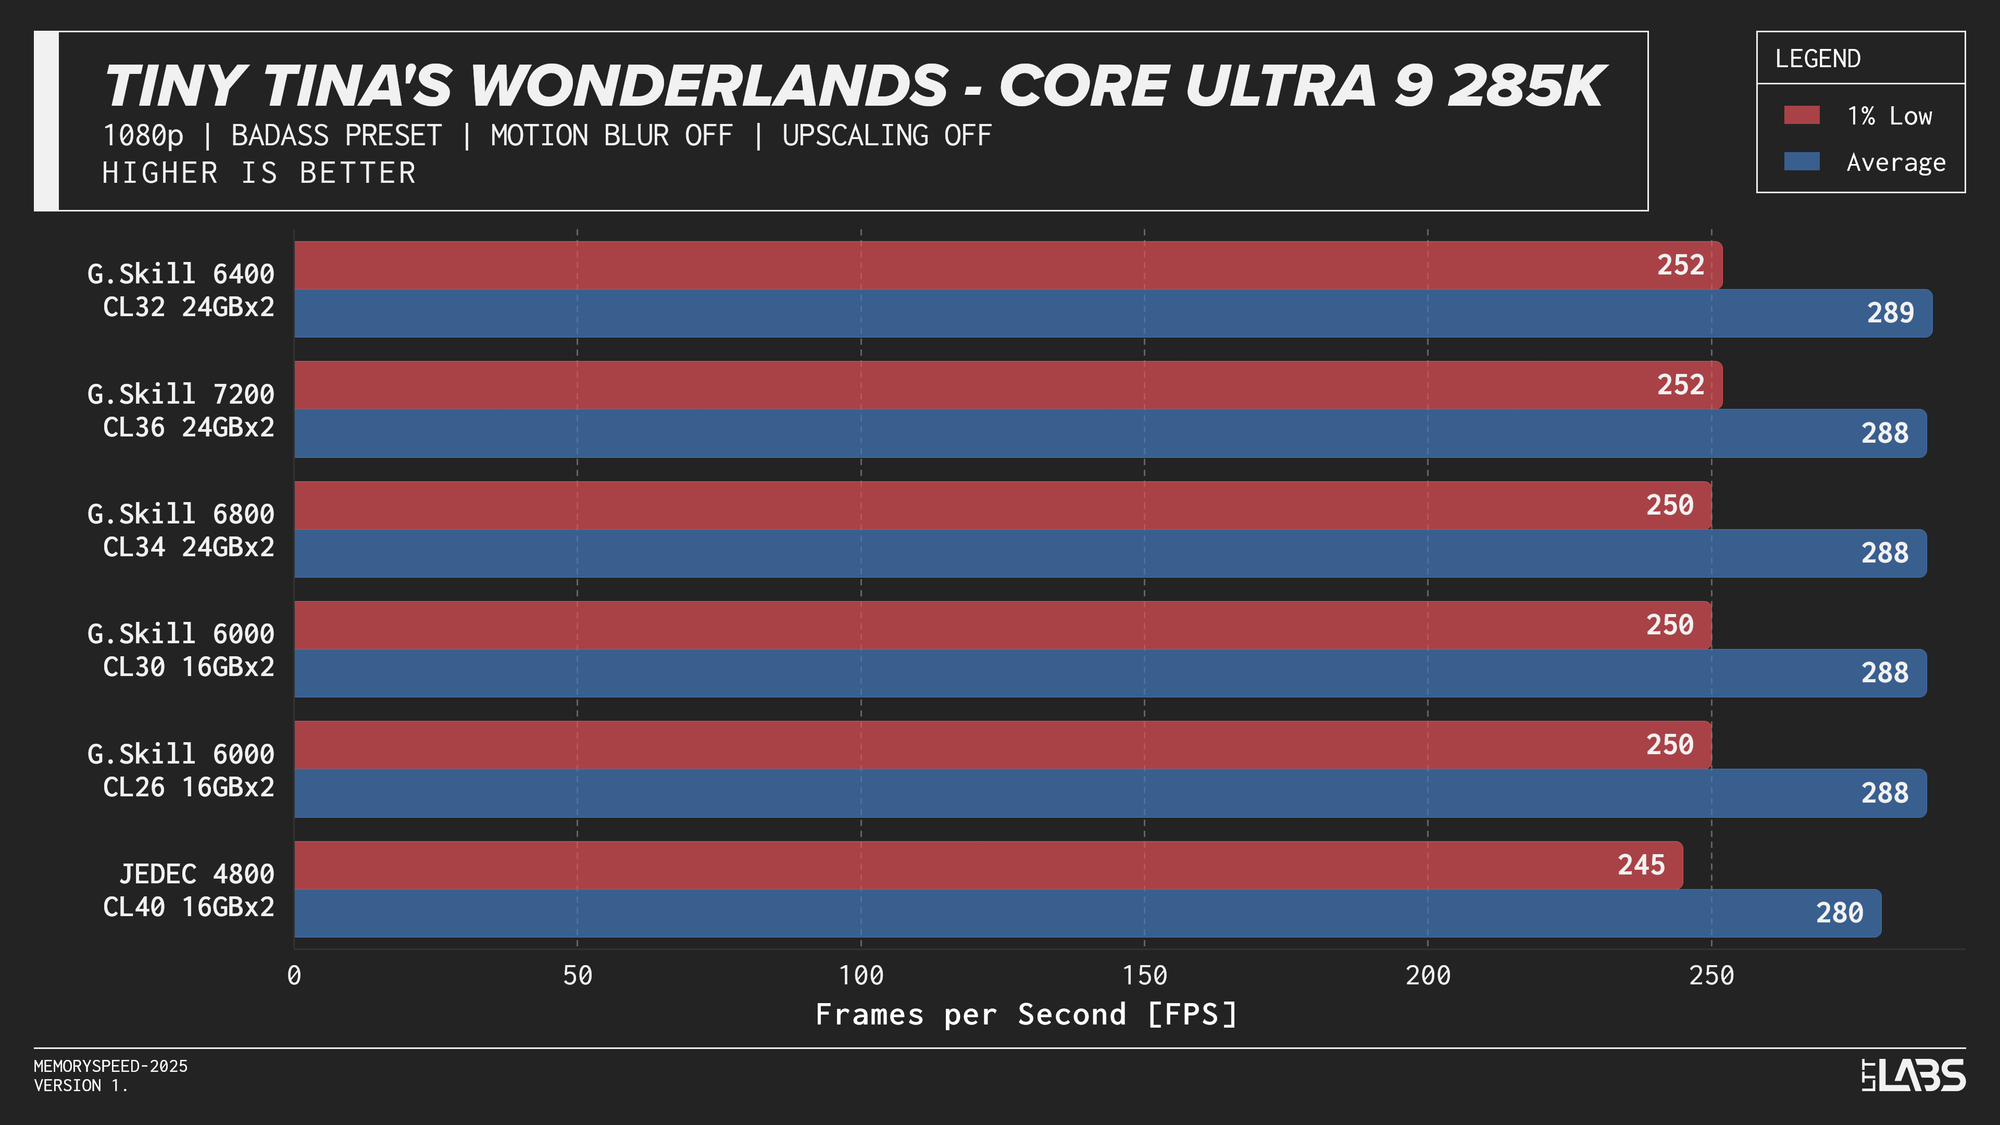
Core Ultra 9 285K 1080p
Performance differences are very minor between all the overclocked kits for the 285K. The low latency 6000 MT/s CL26 kit does outperform all others in most of the benchmarks, but not by a meaningful amount.
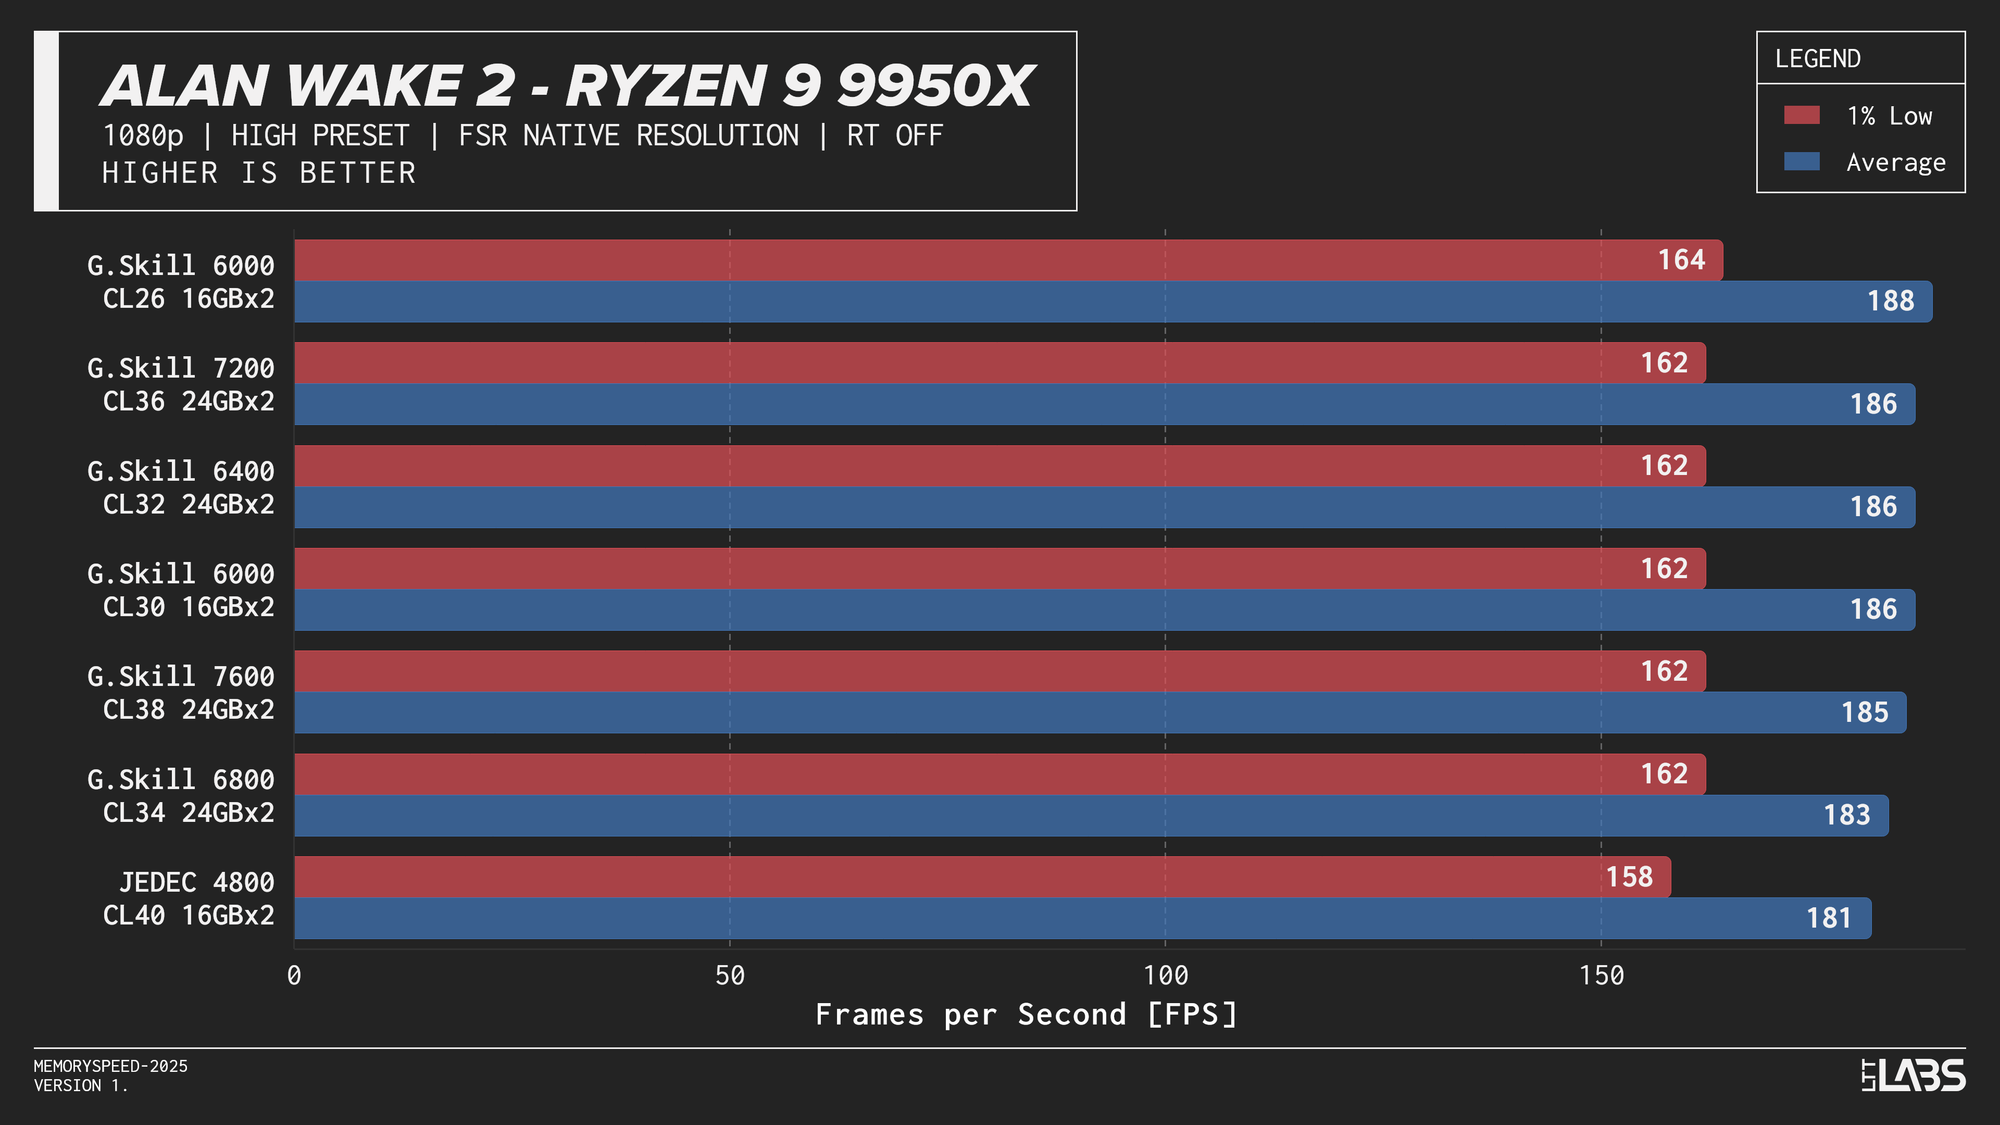
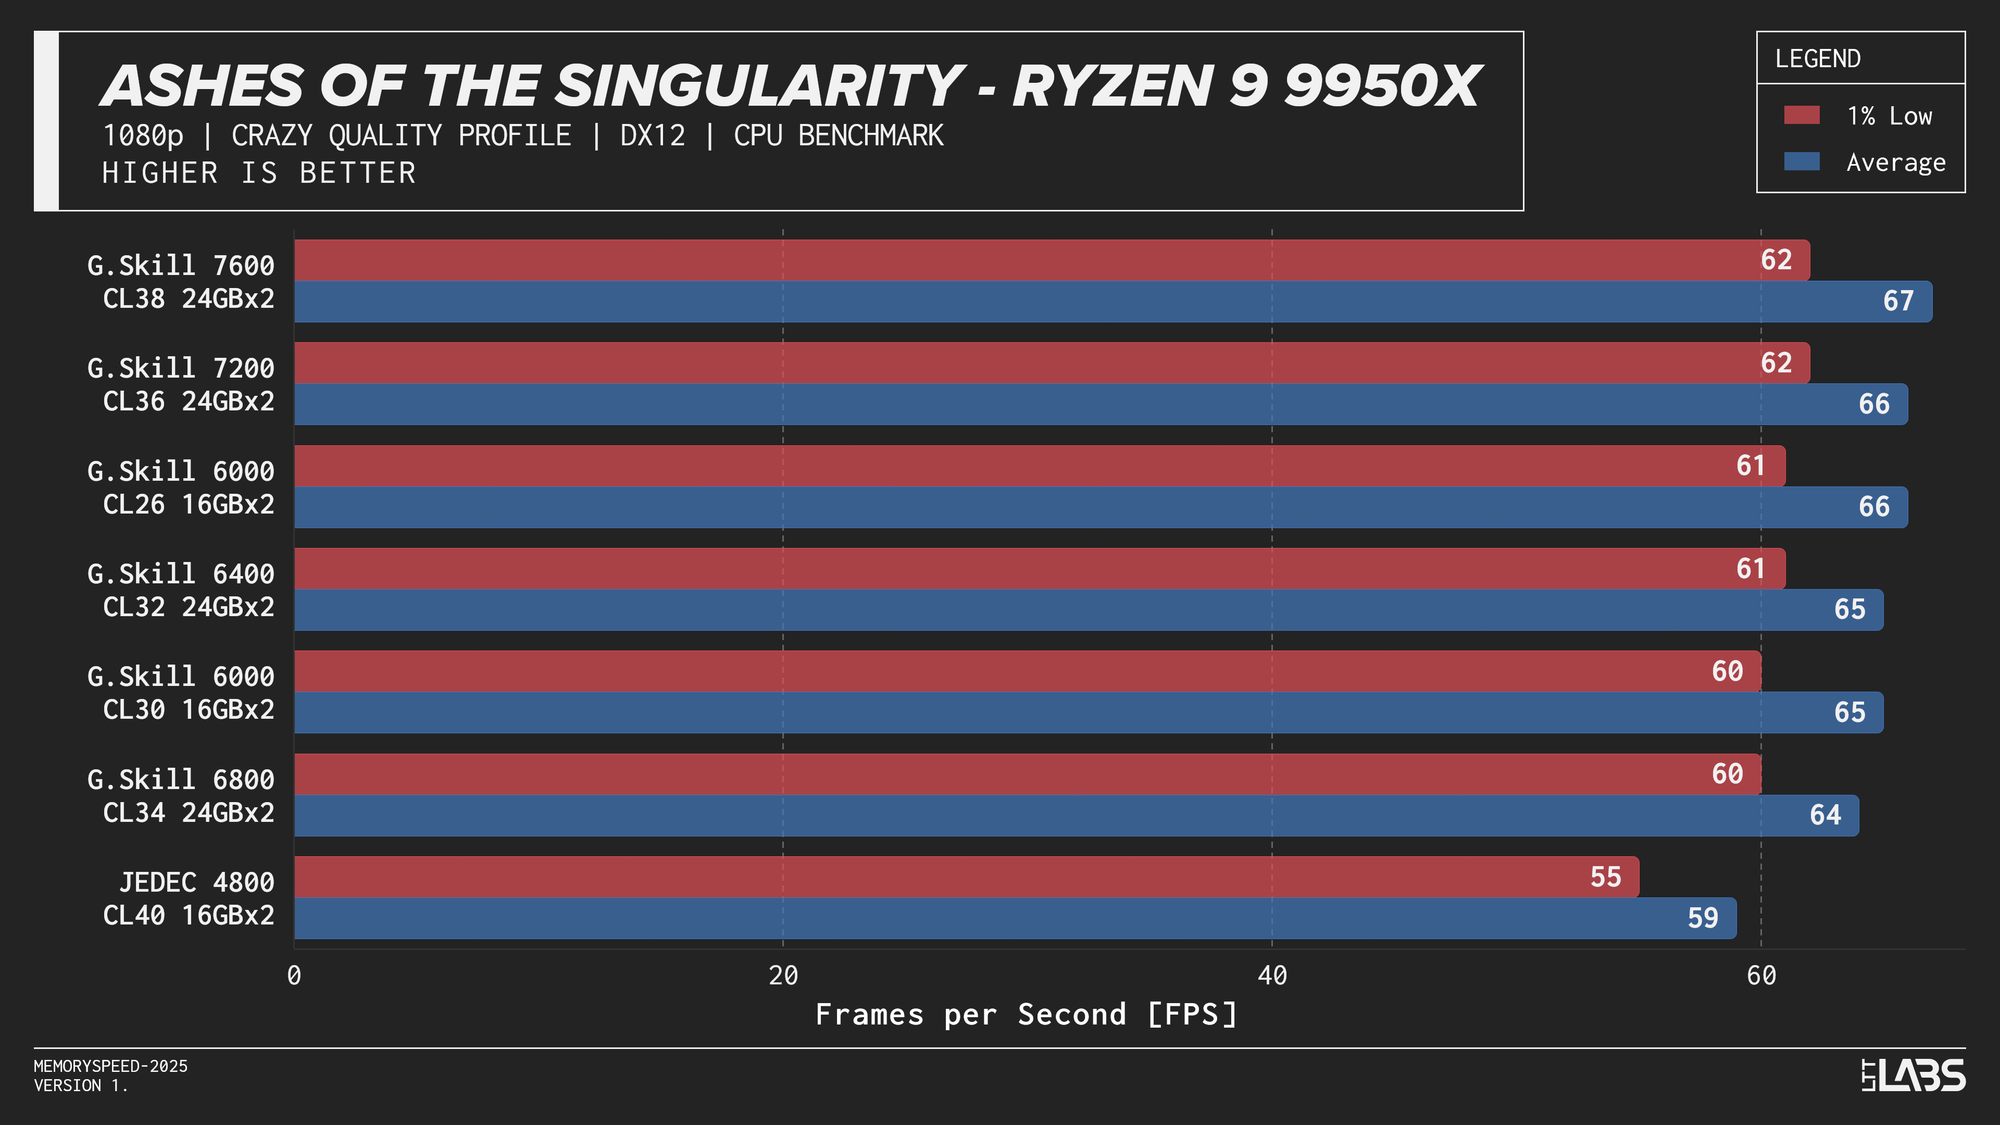
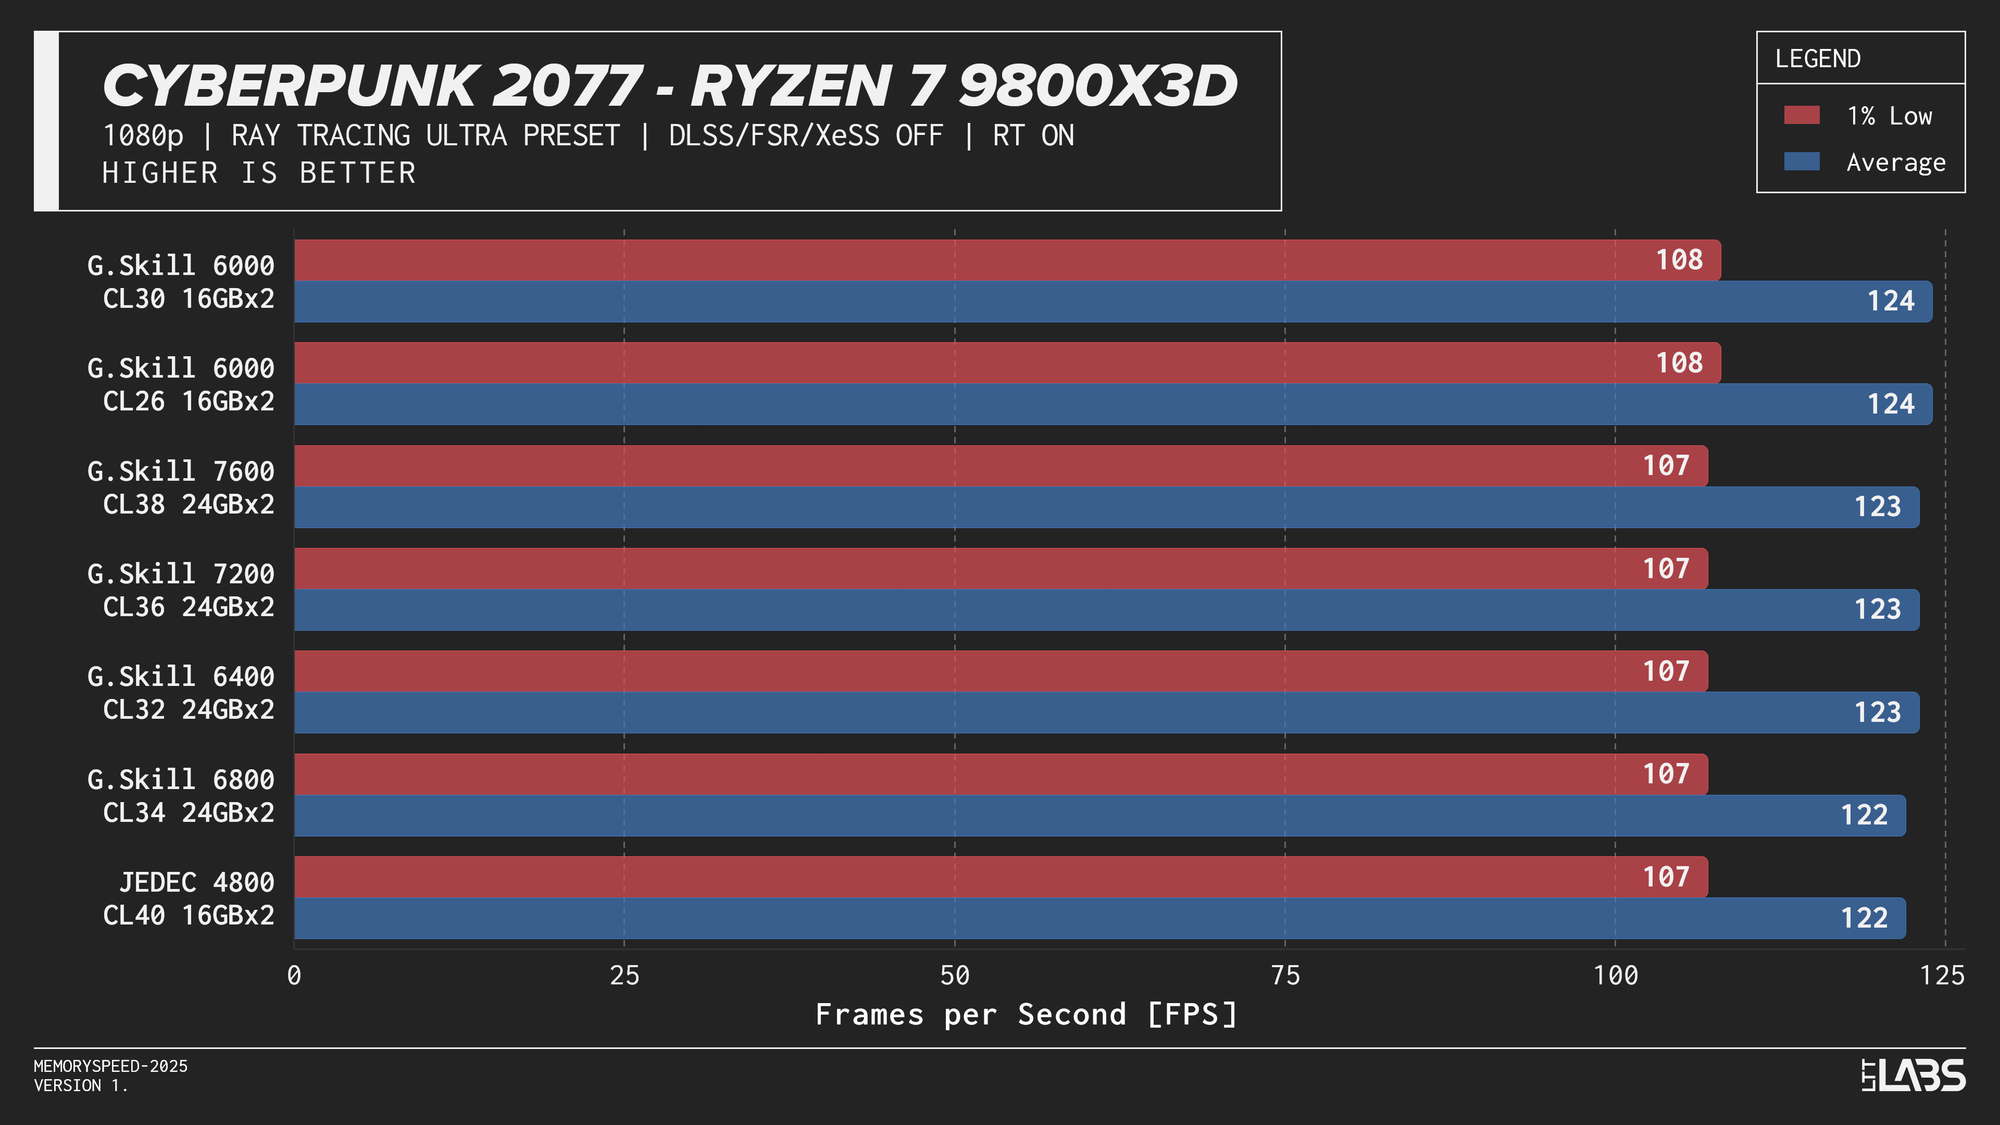
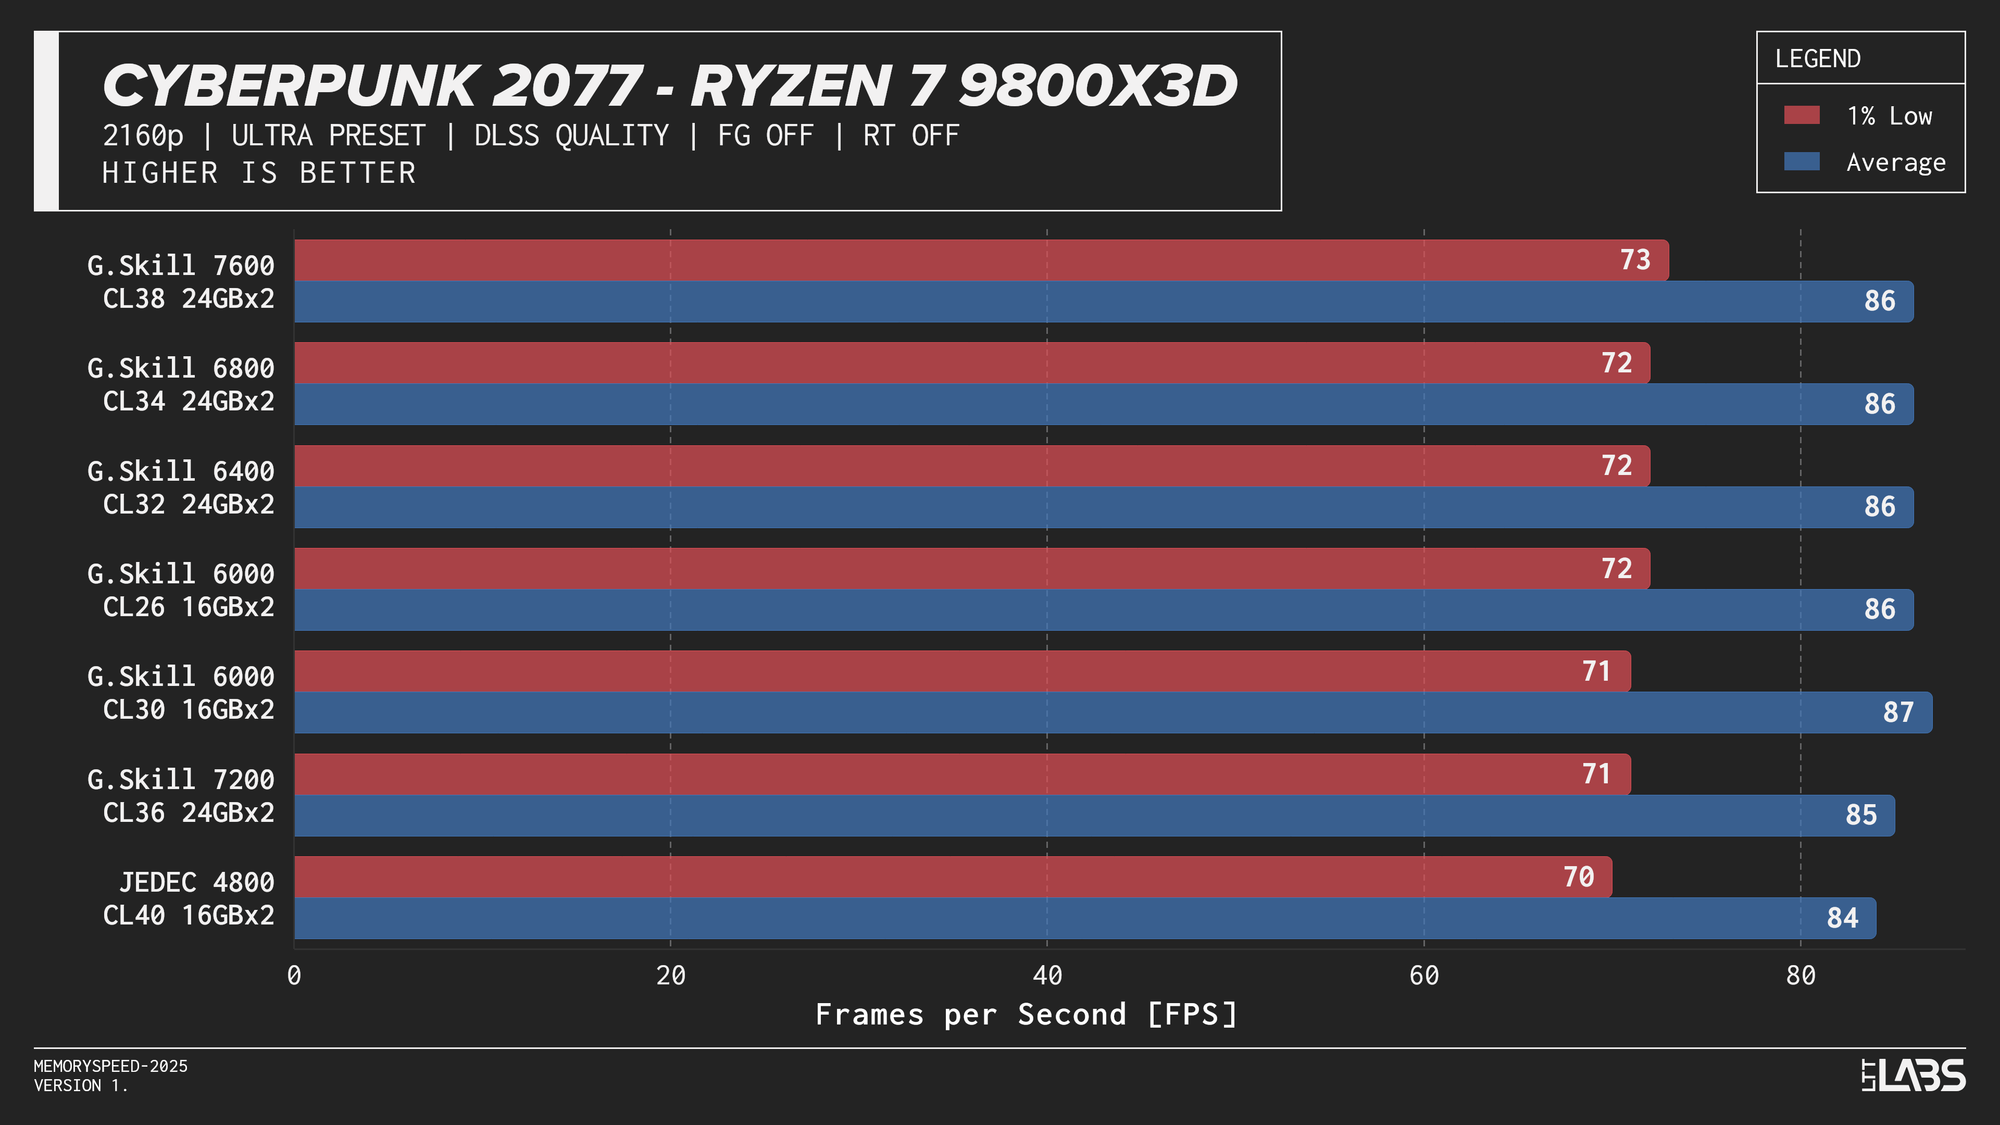
Ryzen 7 9800X3D
Ryzen 7 9800X3D 1080p
Memory speed had minimal impact across the board at 1080p for the X3D chip with the only notable performance differences in Cyberpunk 2077, Ashes of the Signularity: Escalation, and Stellaris. The 6000 MT/s sweet spot often will get you near best performance if not the best performance. Even then, the FPS spread in Cyberpunk and Ashes is so minor that unless you had a frame counter displayed, you wouldn't know the difference. If you're playing Stellaris for hours (or any other game that does a lot of calculations) the sweet spot might be able to get through your game just a tiny bit faster compared to the rest of the kits.
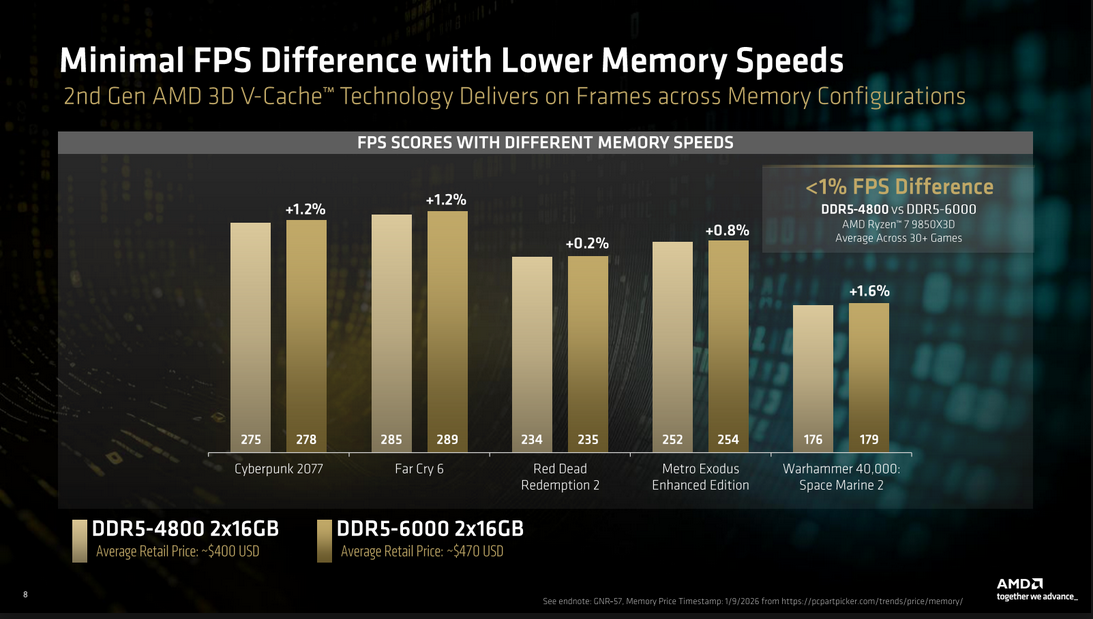
The processor’s large L3 cache reduces reliance on system memory, making faster DDR5 largely unnecessary for gaming on this platform. So much so that even the base JEDEC configuration is enough for gaming on these chips. This aligns with AMD’s own Zen 5 X3D data, which shows less than a ~1% average FPS difference between DDR5-4800 and DDR5-6000. While the specific data was for the AMD Ryzen 7 9850X3D, the trend applies broadly to X3D processors due to their large L3 cache which is responsible for the performance.
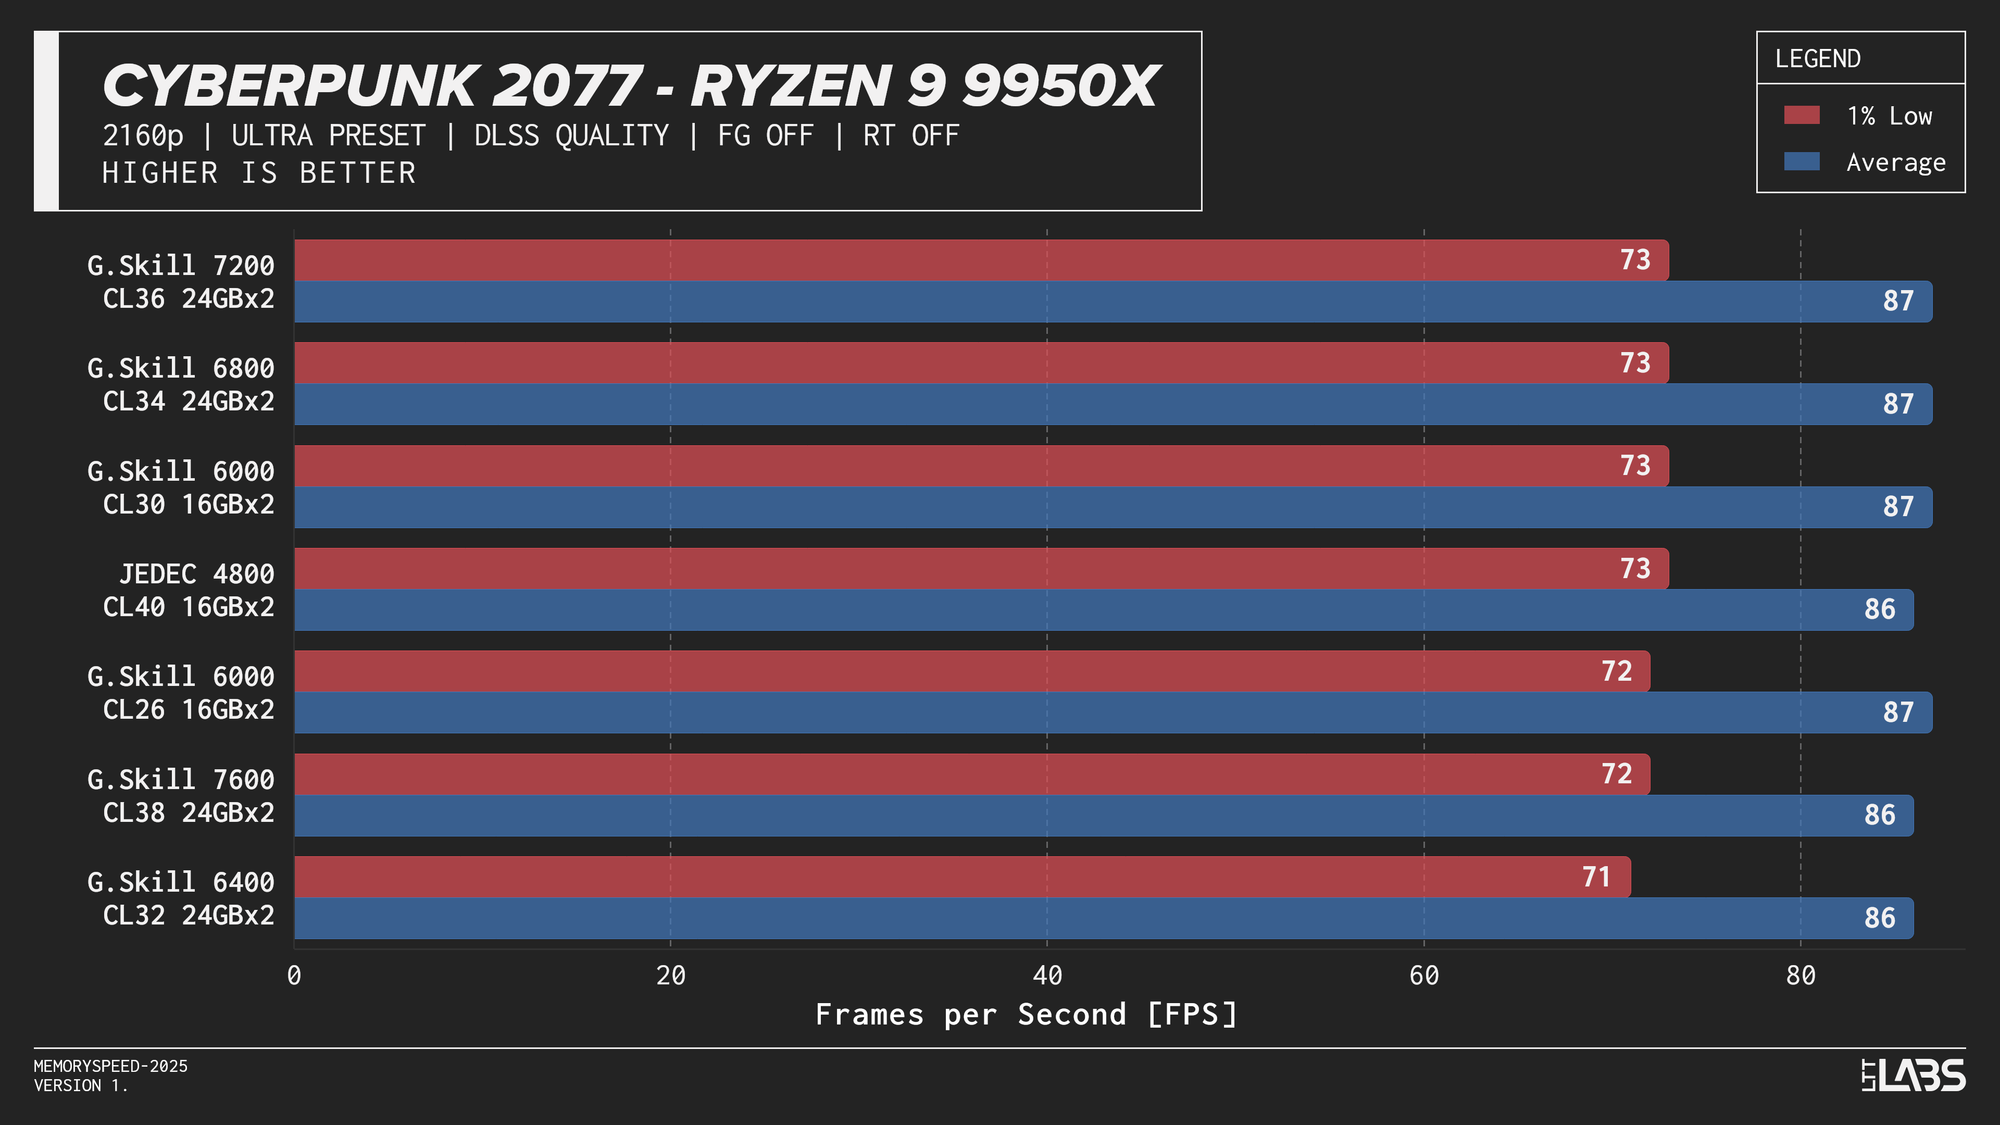
Ryzen 9 9950X
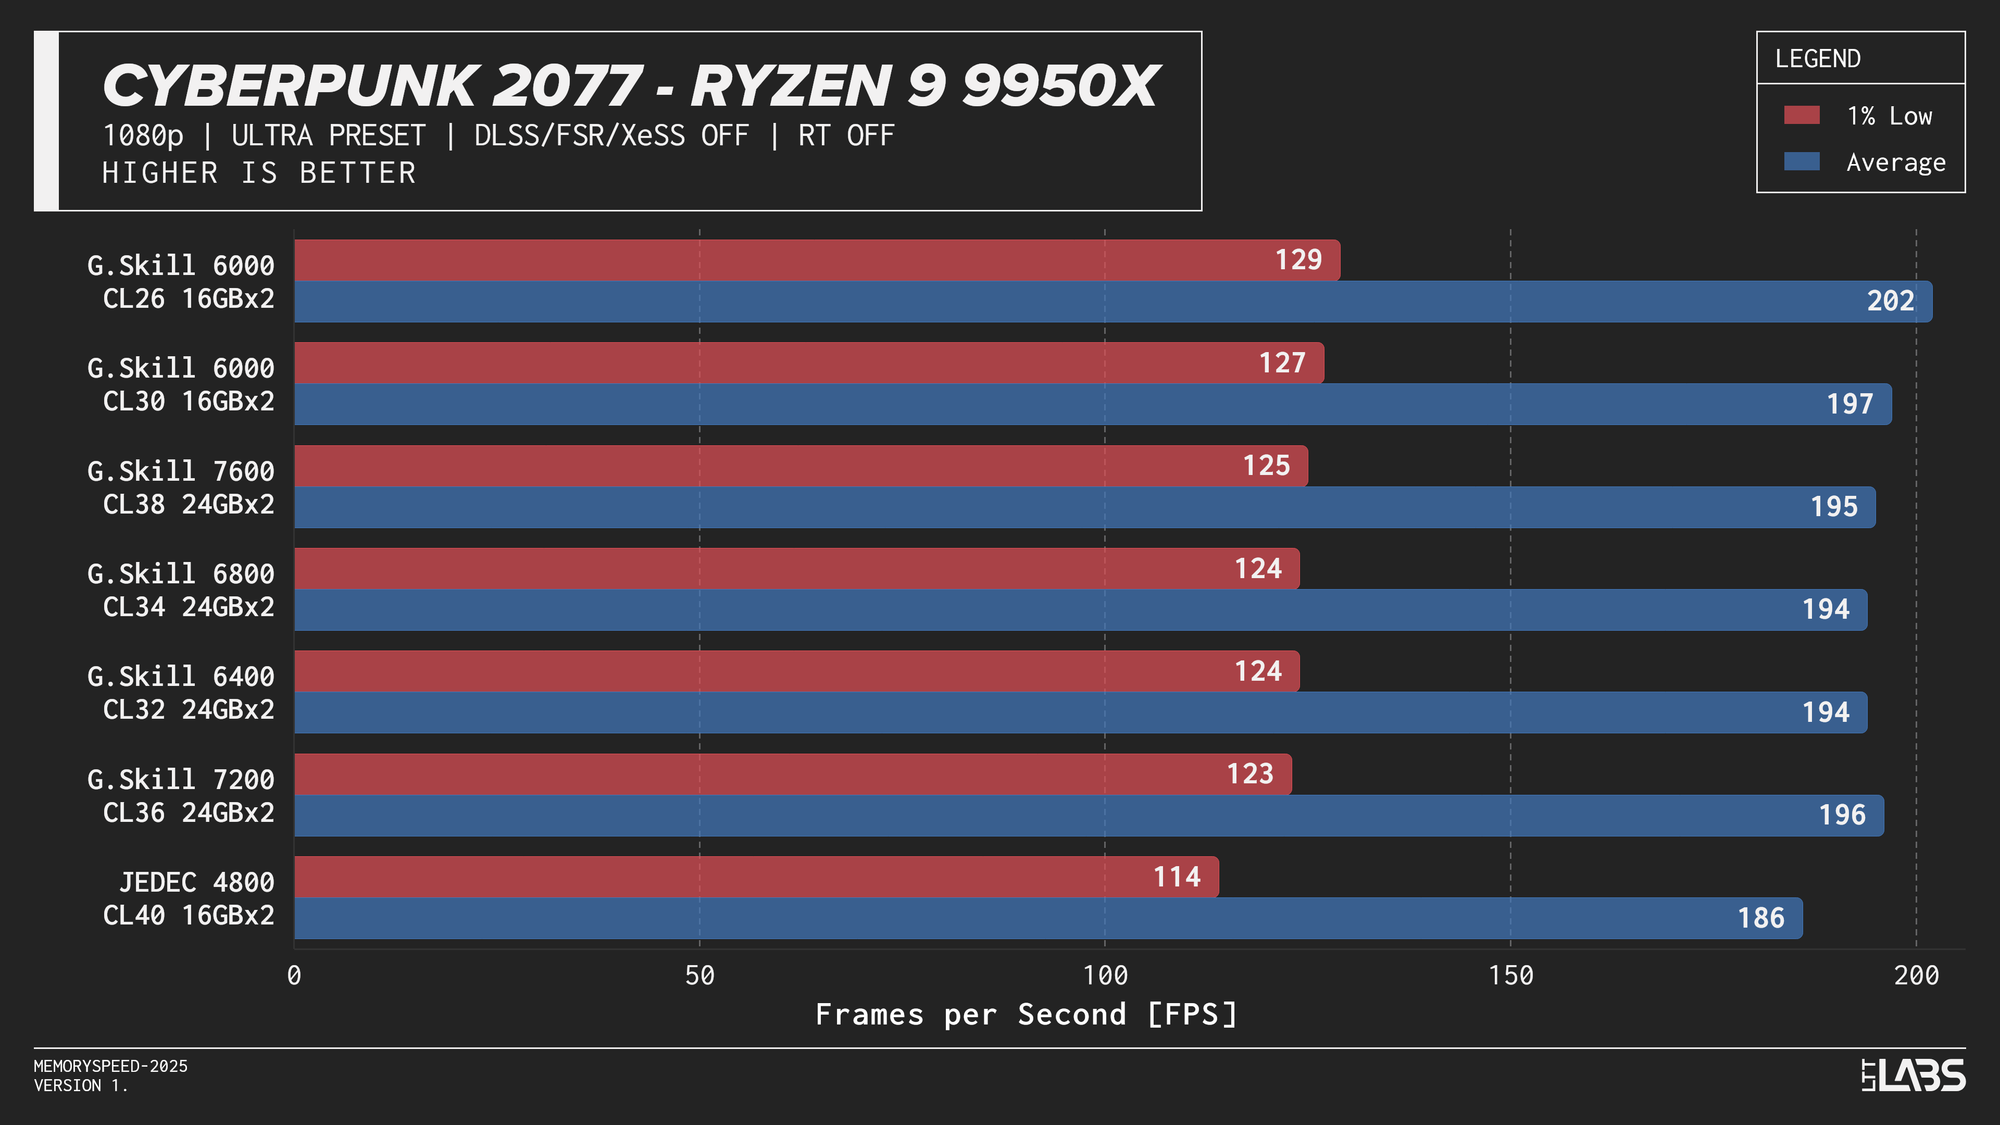
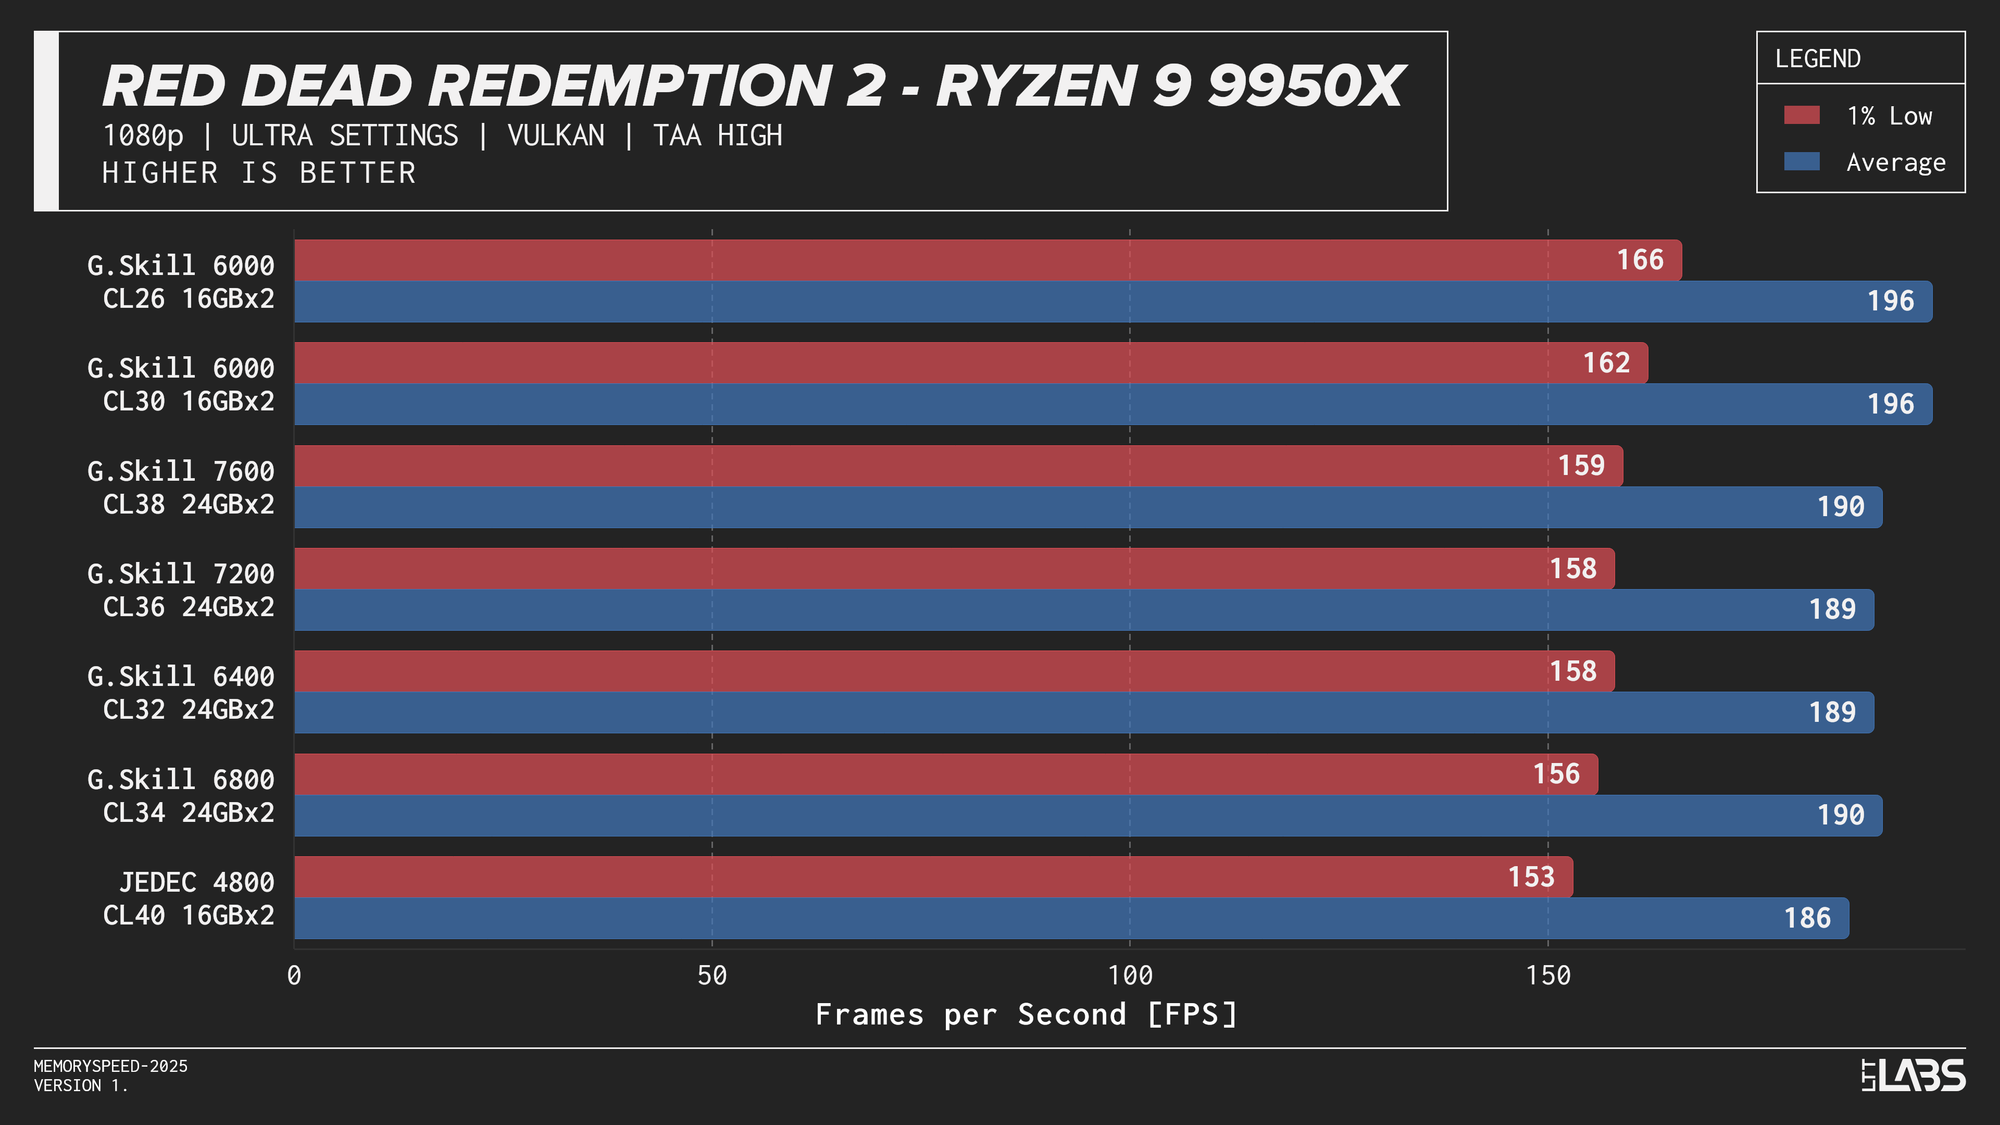
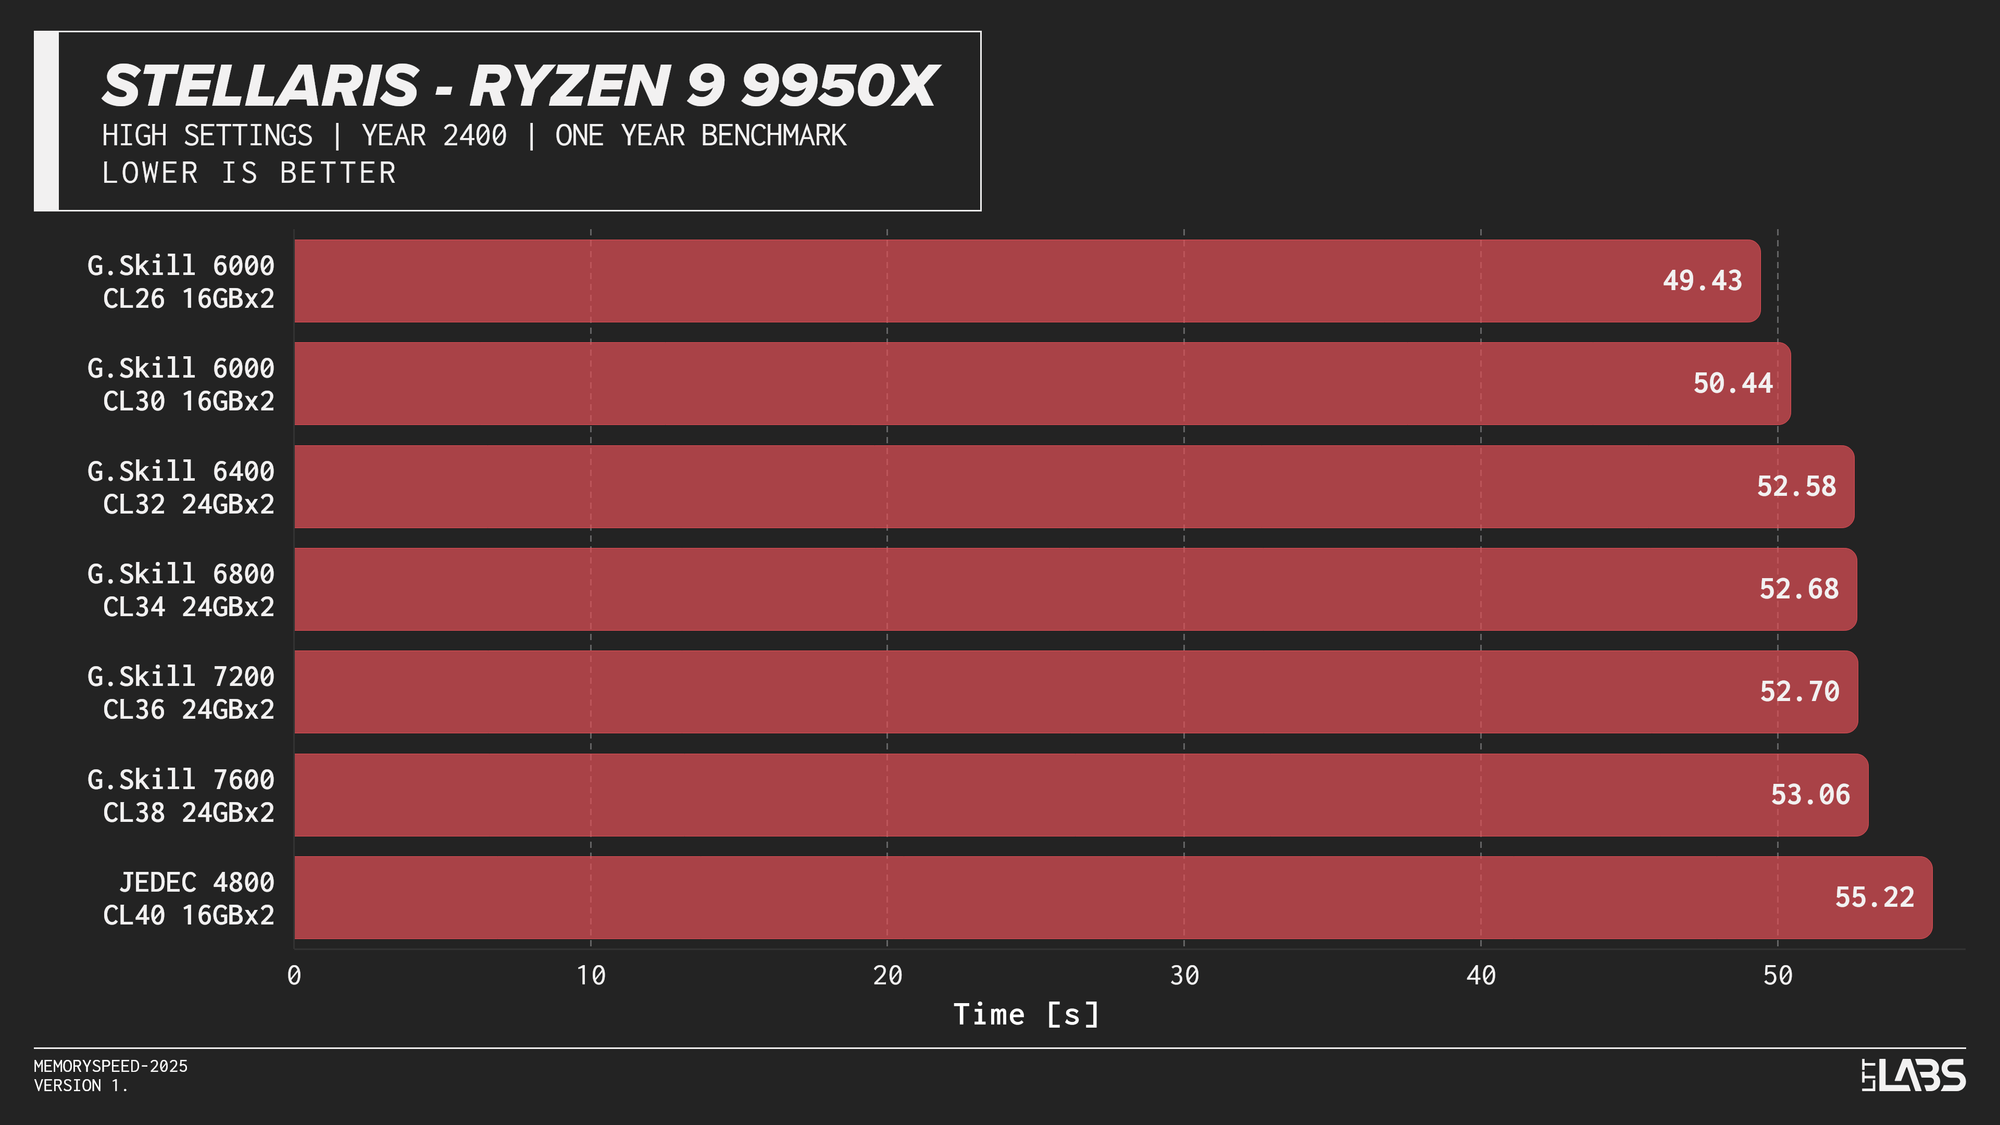
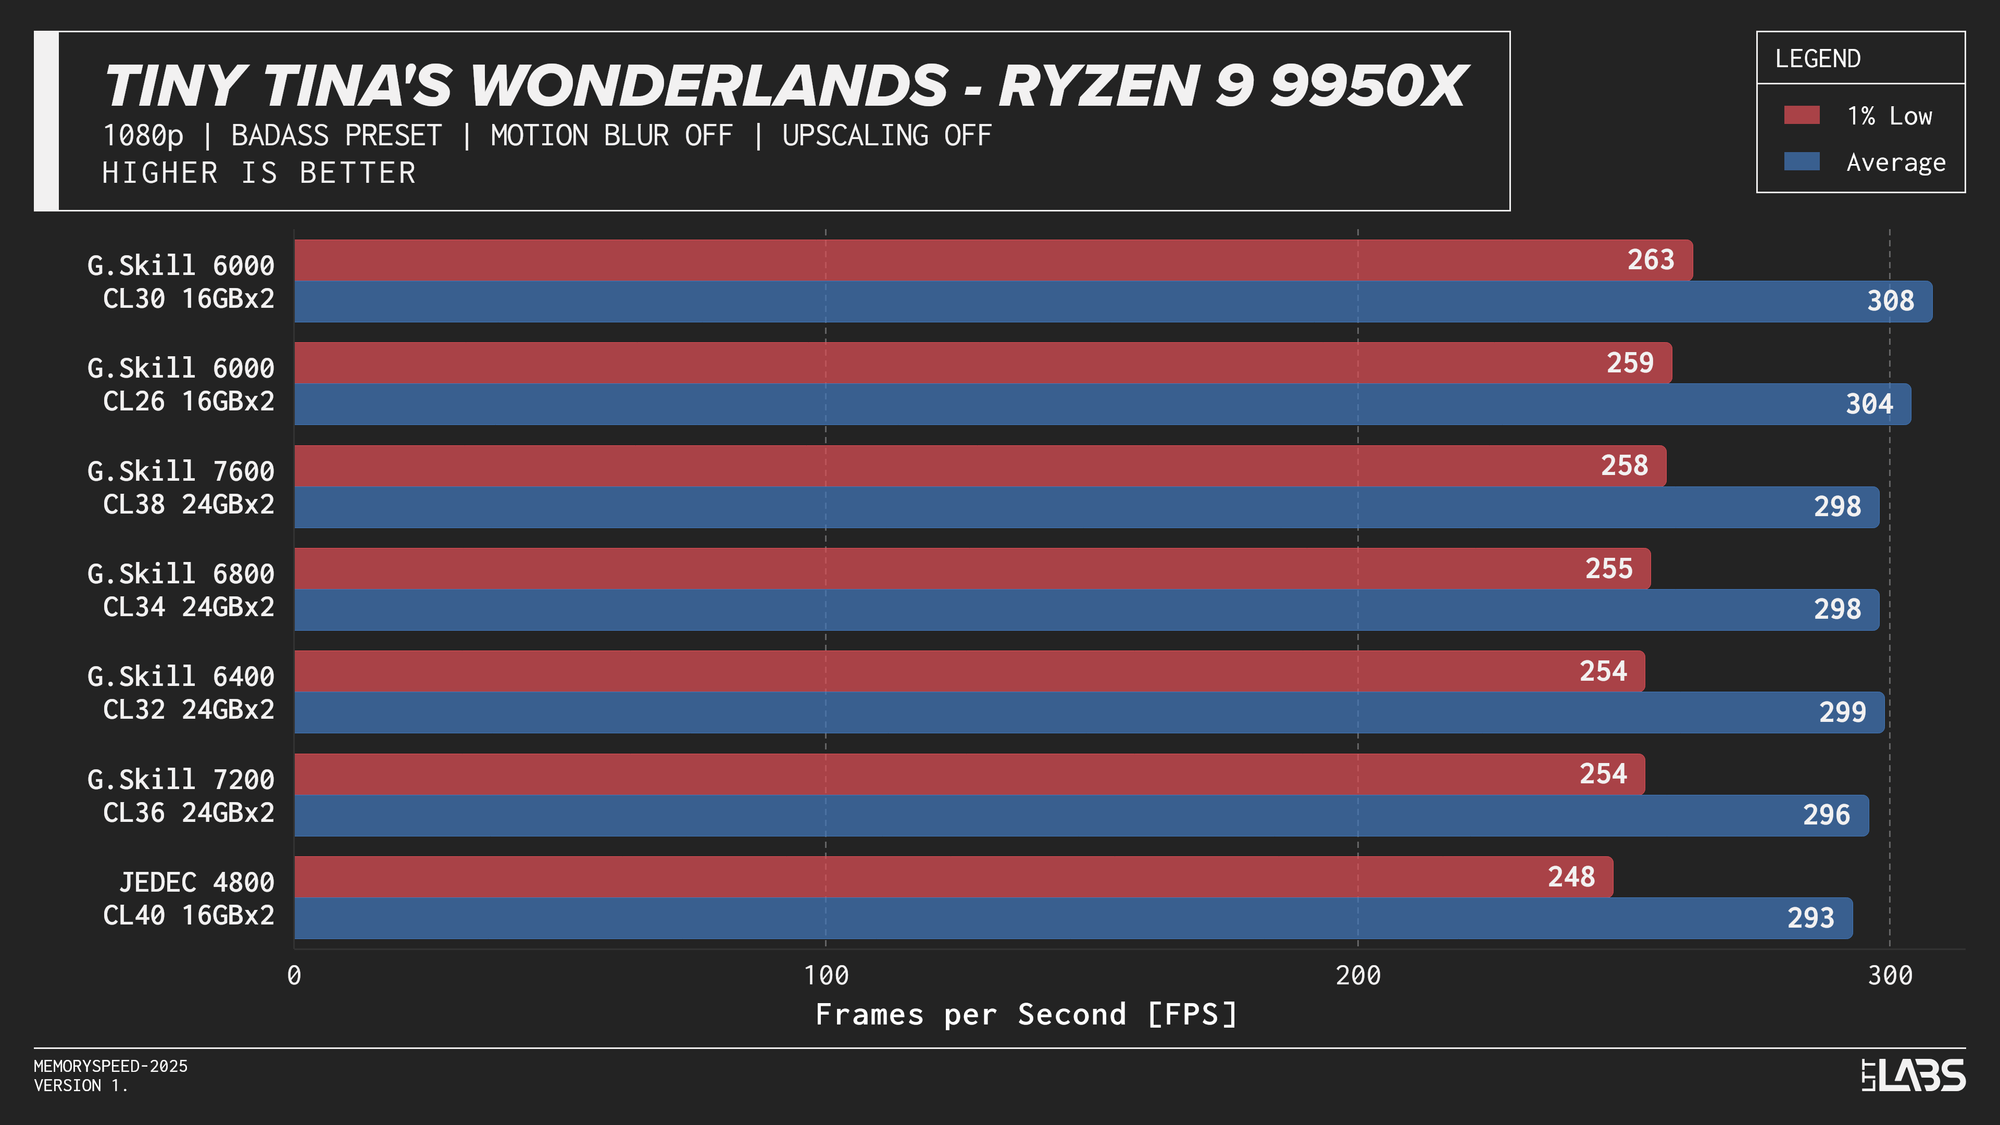
Ryzen 9 9950X 1080p
On the 9950X, in most titles, there's clearly some benefit going from JEDEC to a tuned memory kit. Beyond JEDEC, like in most instances with AMD, 6000 MT/s still continues to be king, often performing near the top of the charts with only Ashes of the Singularity preferring the 7200 MT/s and 7600 MT/s kits over the 6000 MT/s ones. However, the margin is small enough to be attributed to test variance.
2160p
At 2160p, the workload shifts in the opposite direction. The GPU takes significantly longer to render each frame, causing the CPU and system memory to spend more time waiting for the graphics pipeline to finish. With the GPU acting as the primary bottleneck, changes in CPU or memory performance have little opportunity to affect frame rates. As a result, differences between memory configurations are expected to be minimal at this resolution and that is exactly what we saw. Given the consistency across platforms, individual CPU results are not discussed in much detail like the 1080p section.
Core i9-14900K
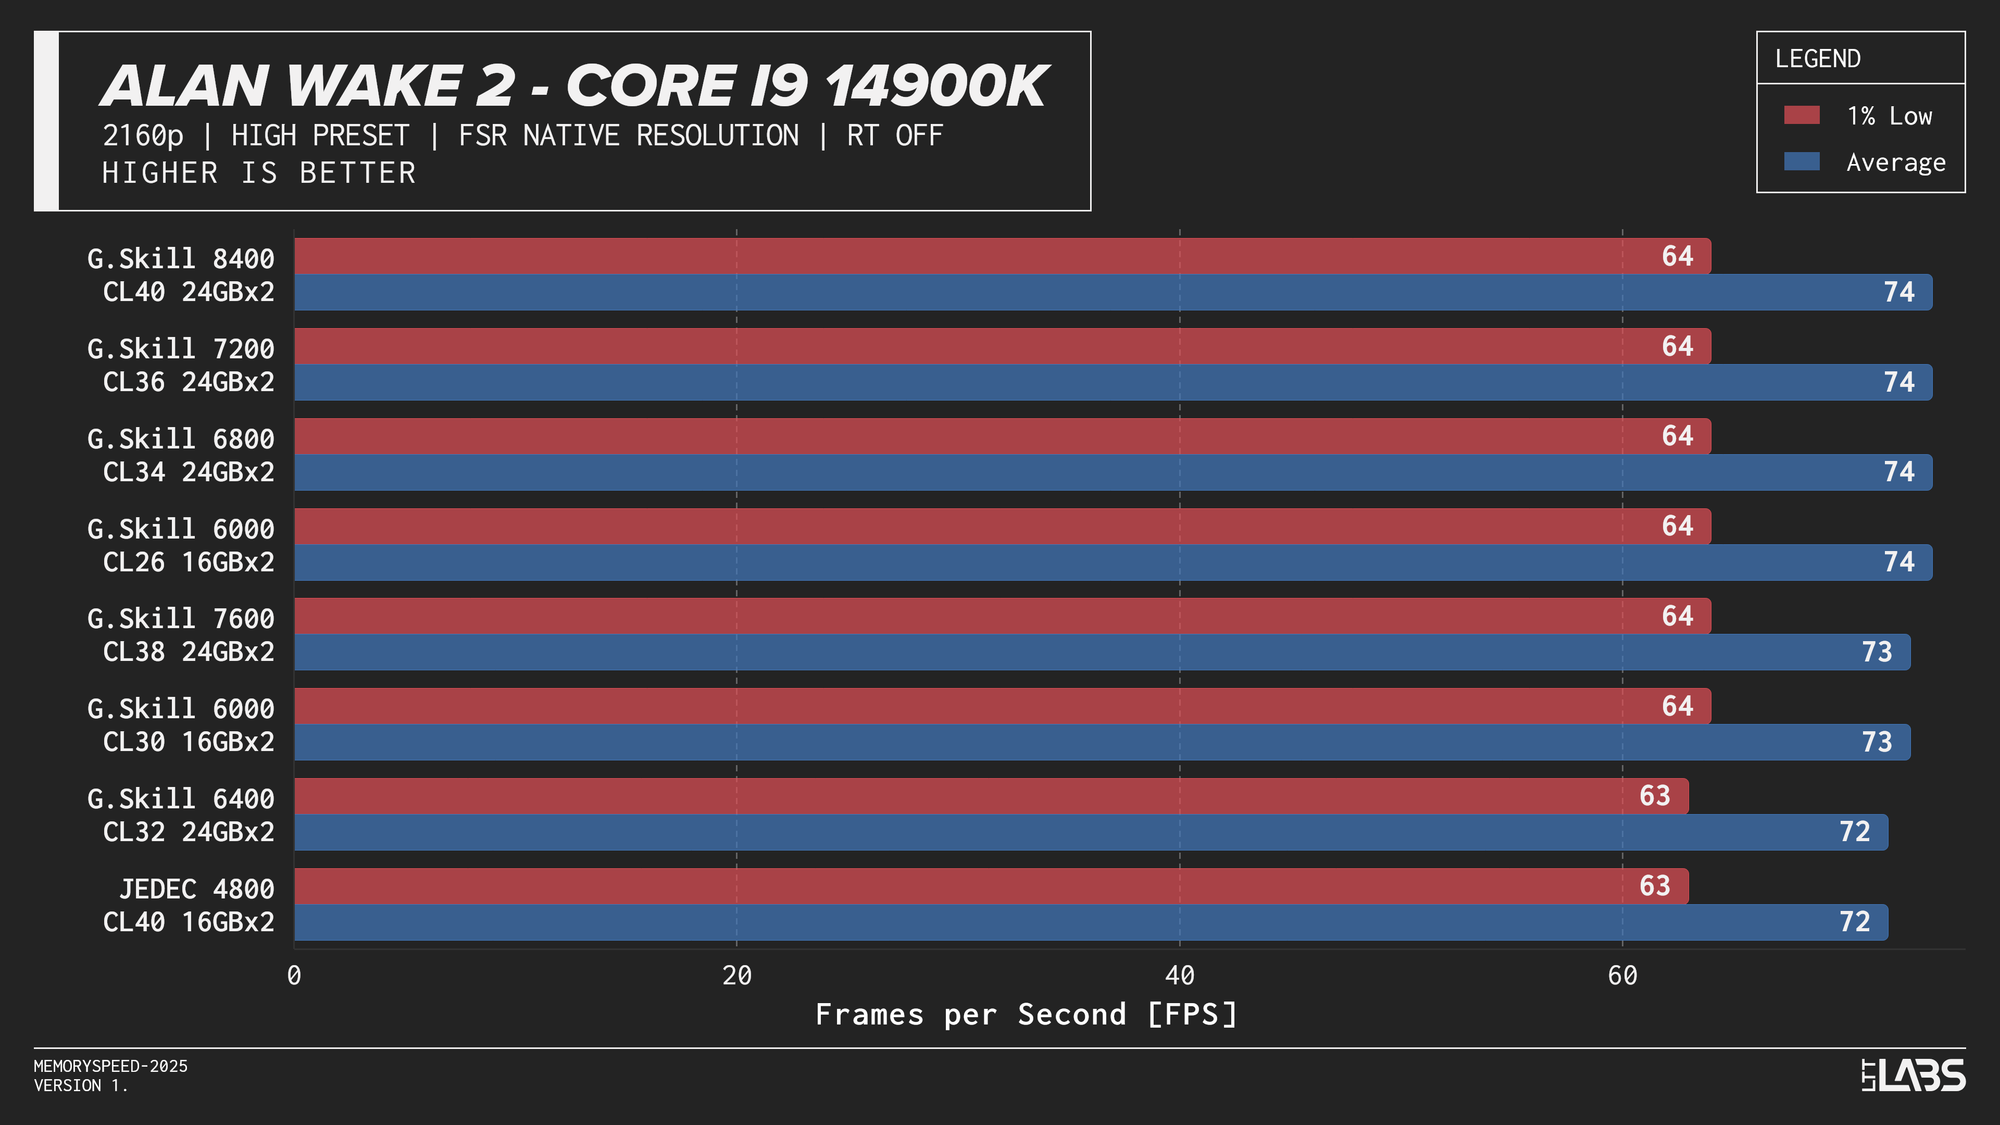
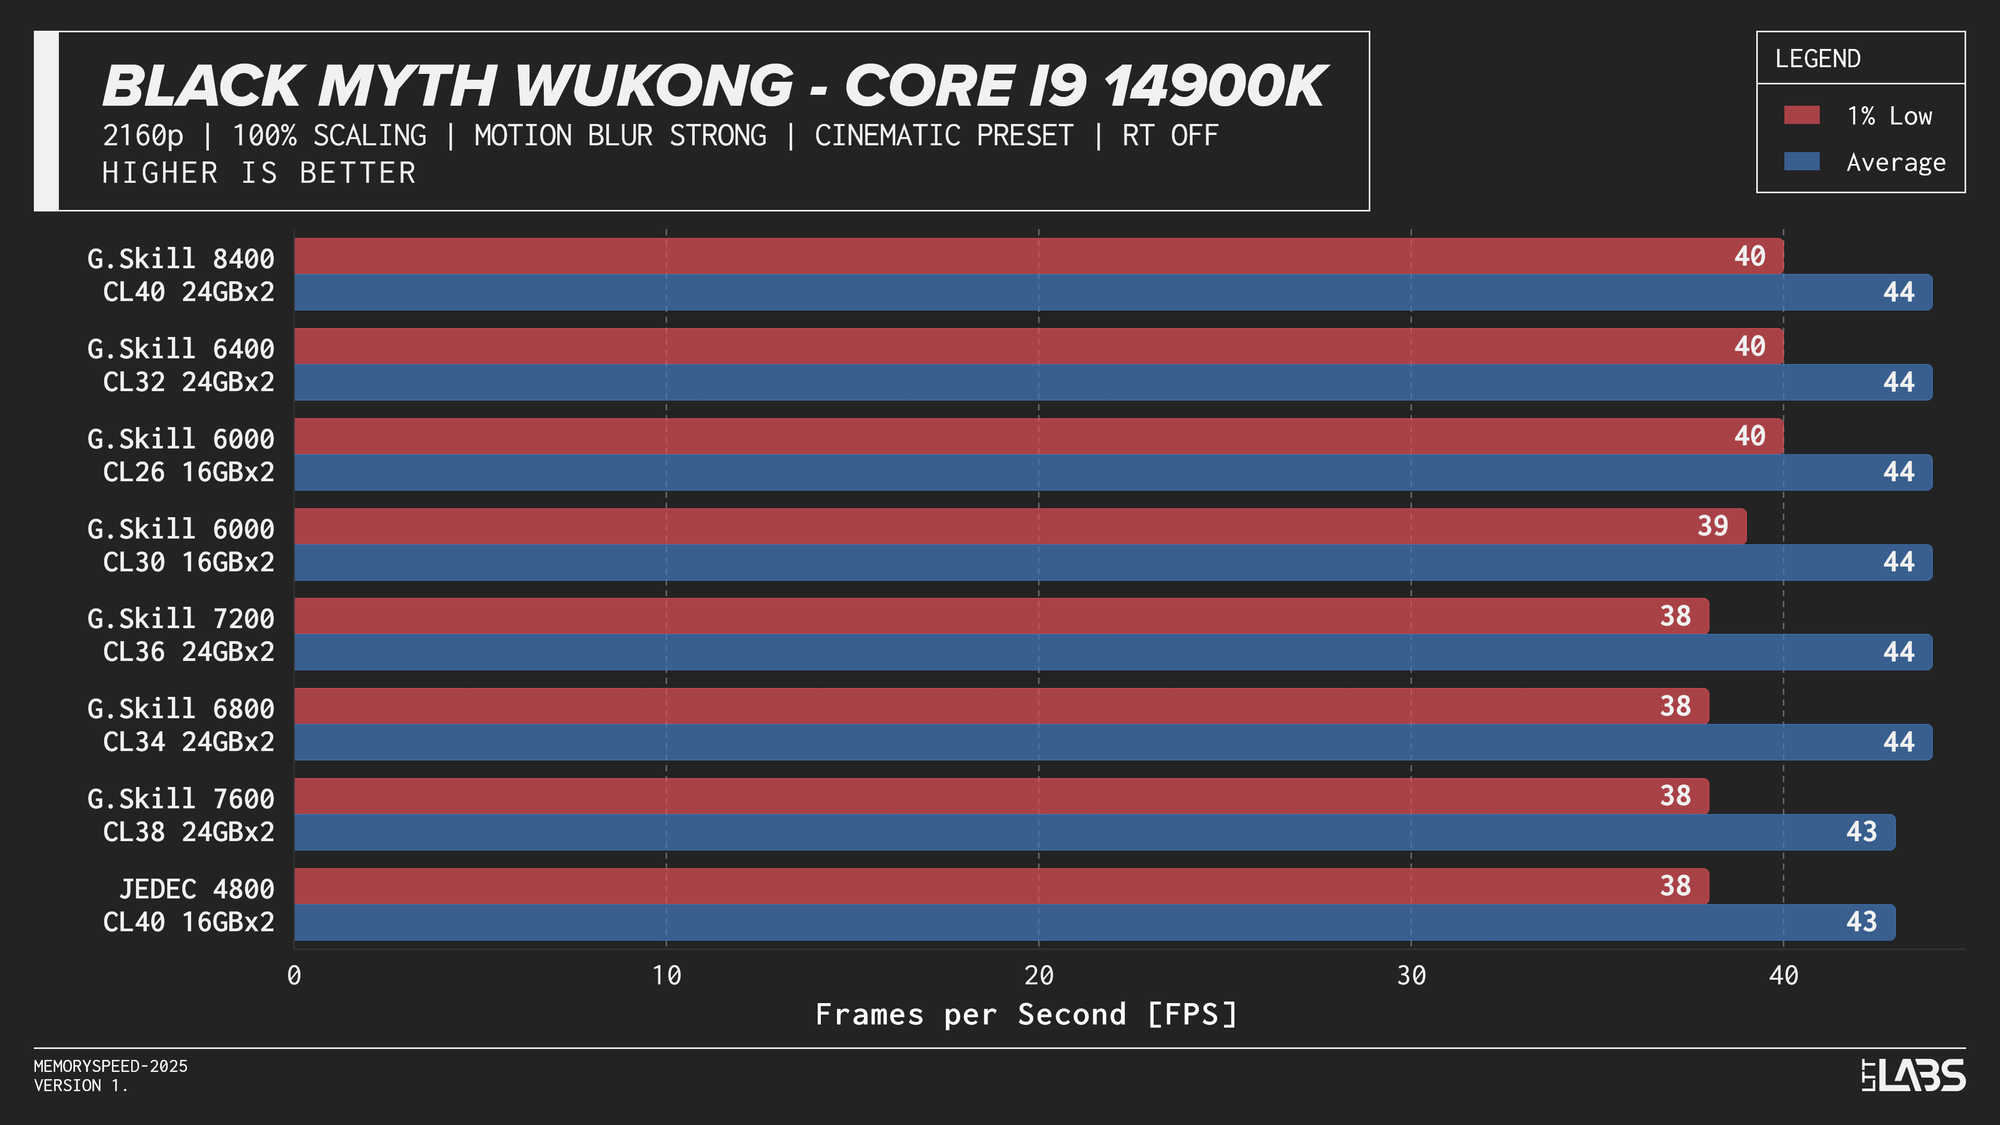
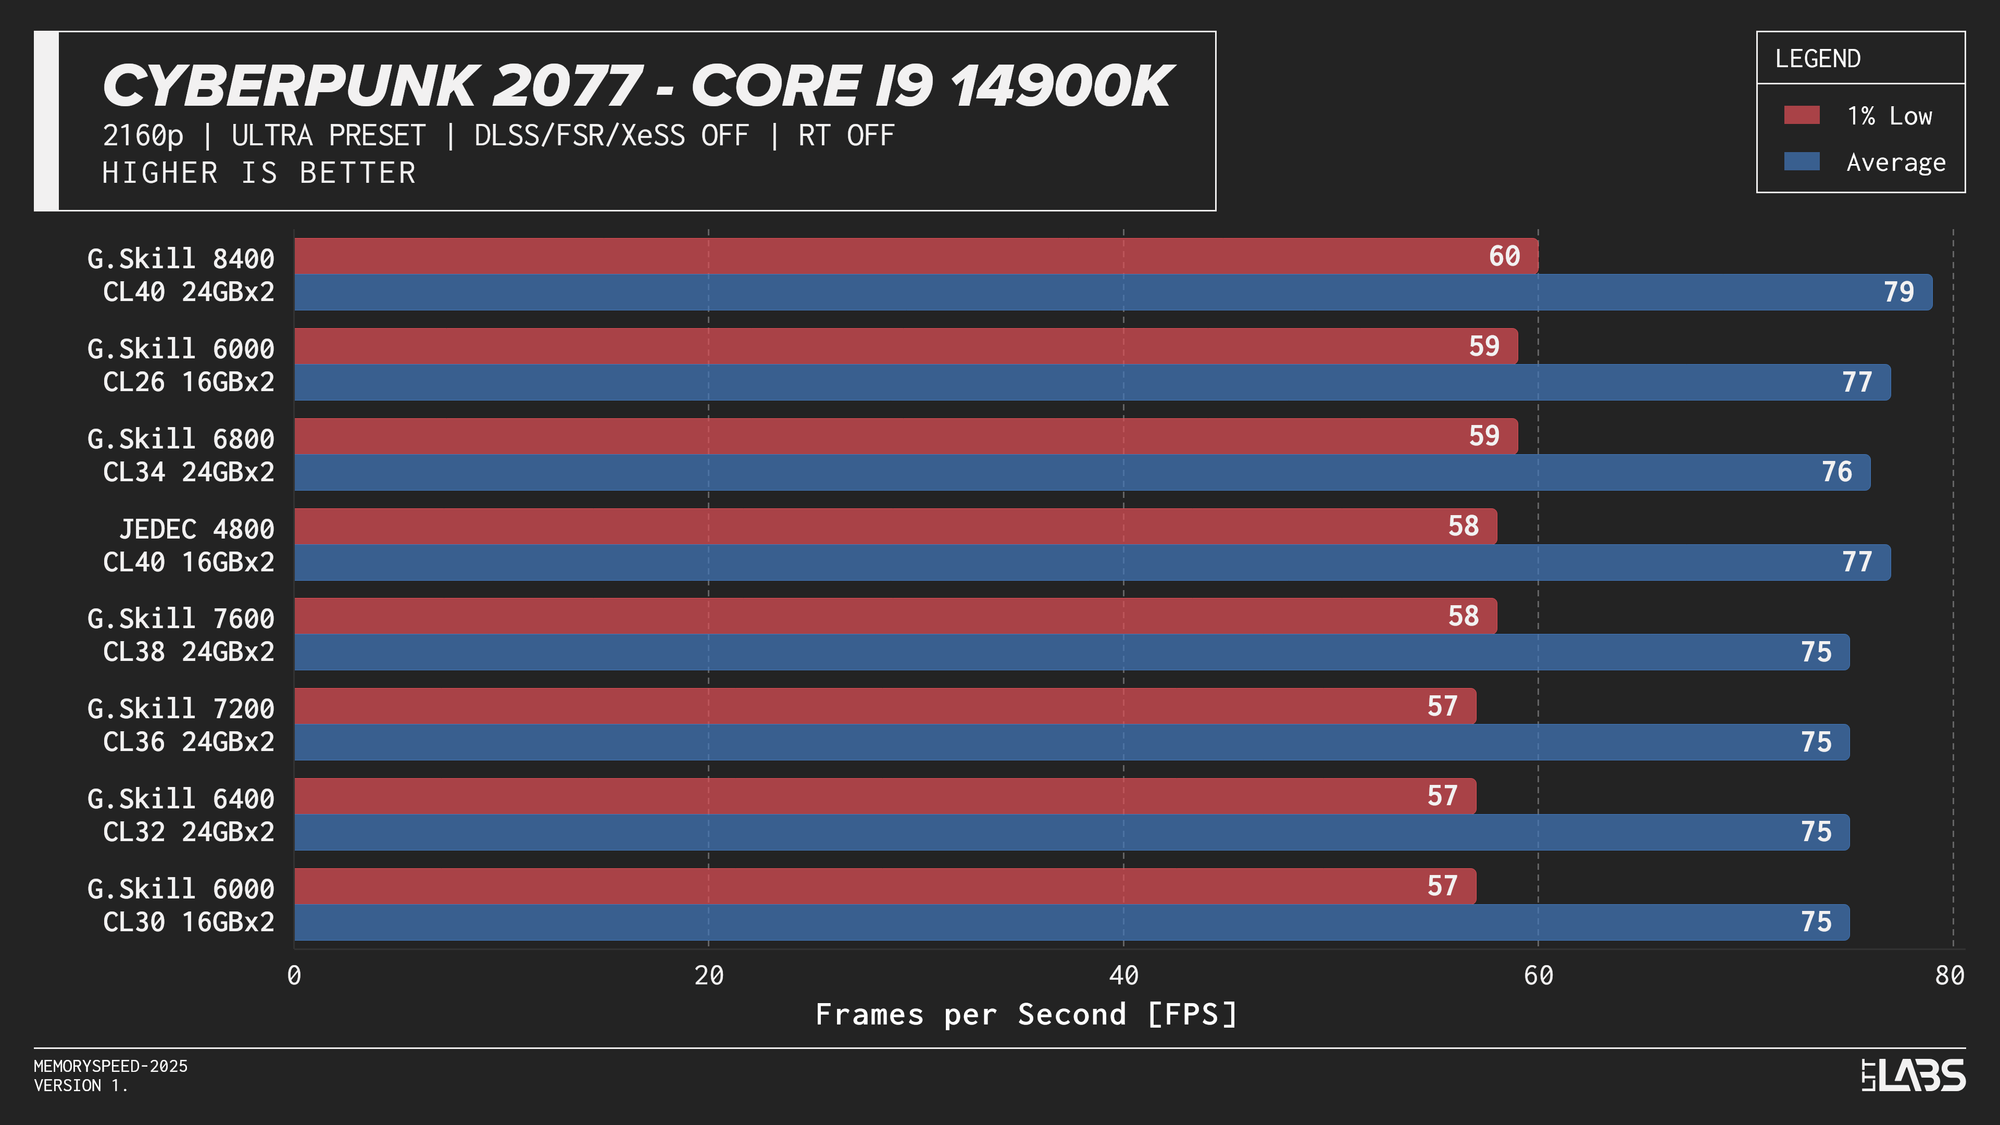
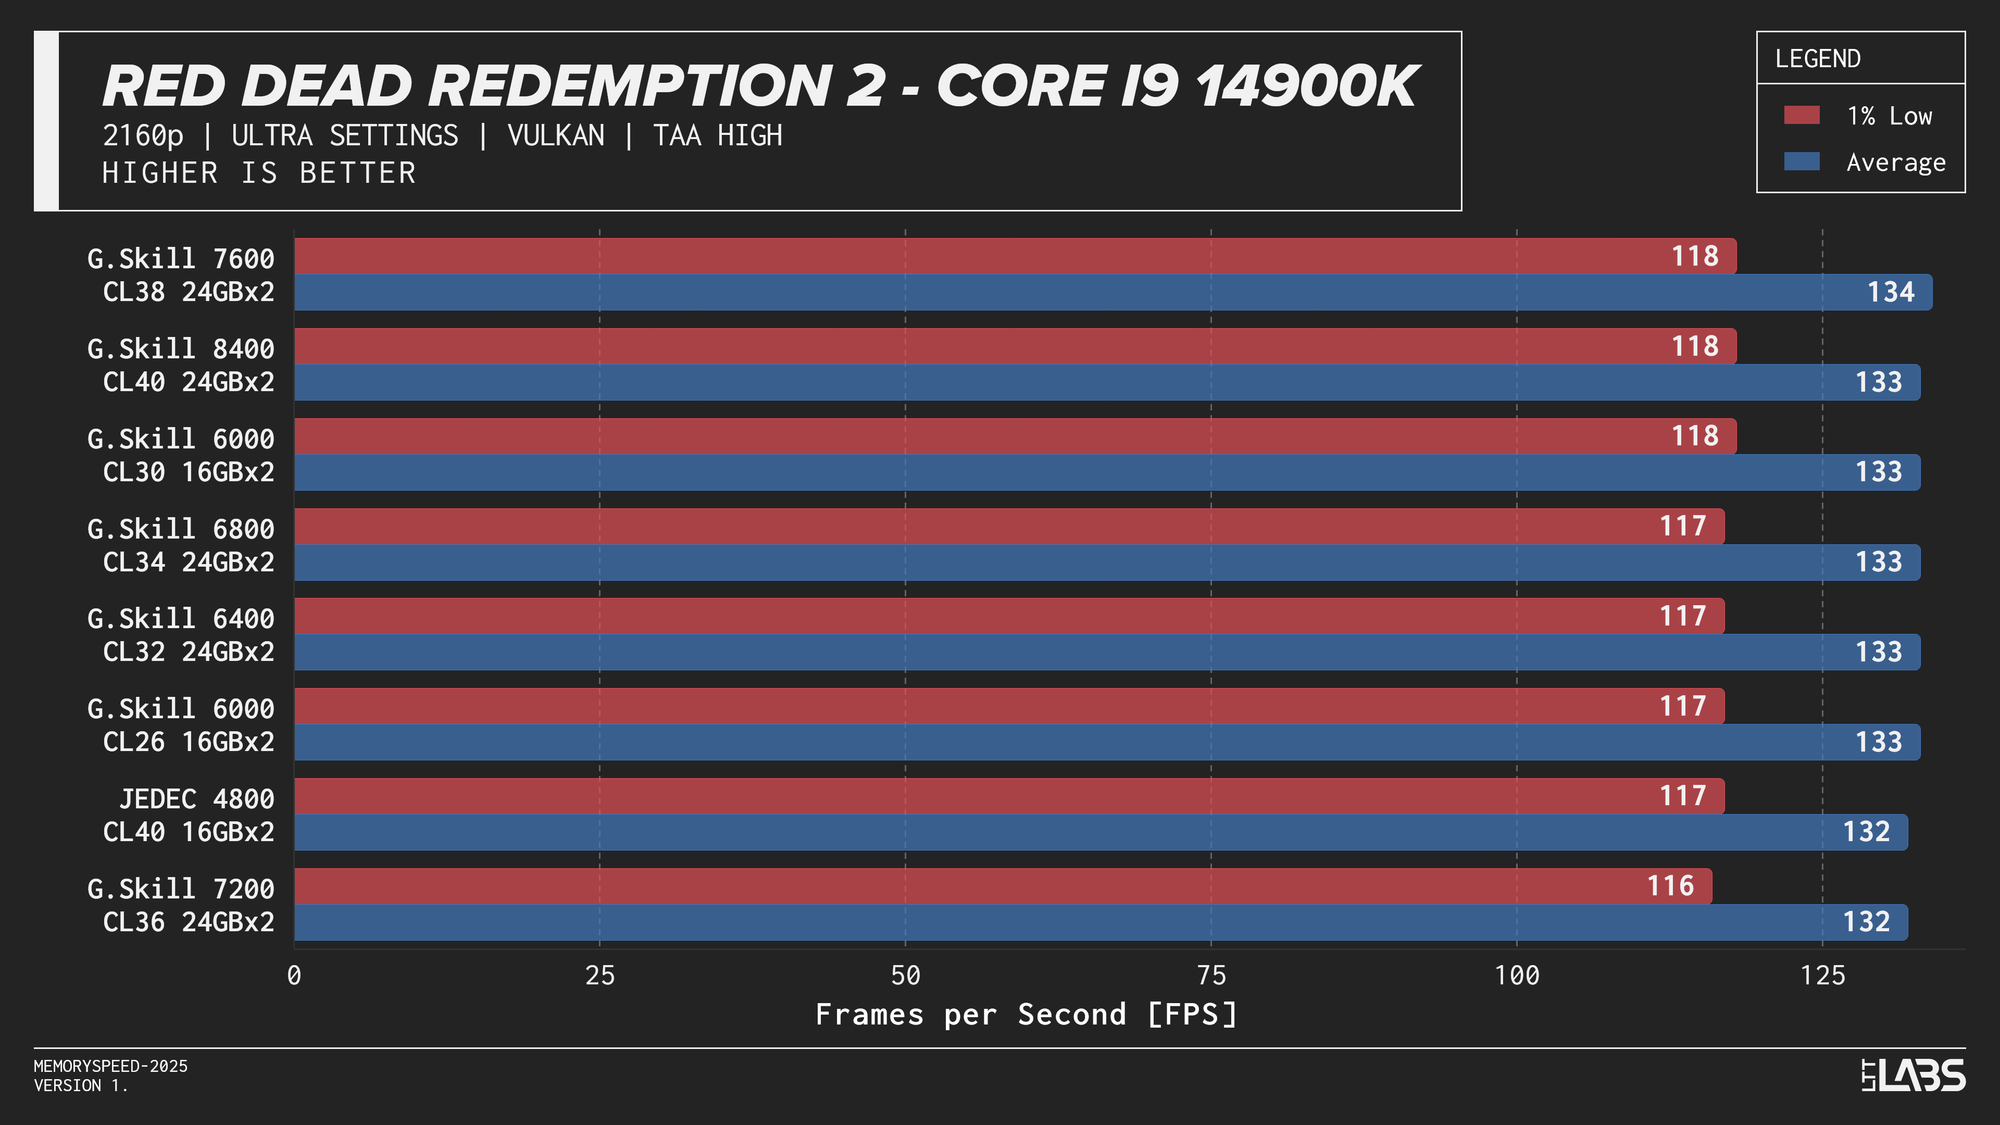
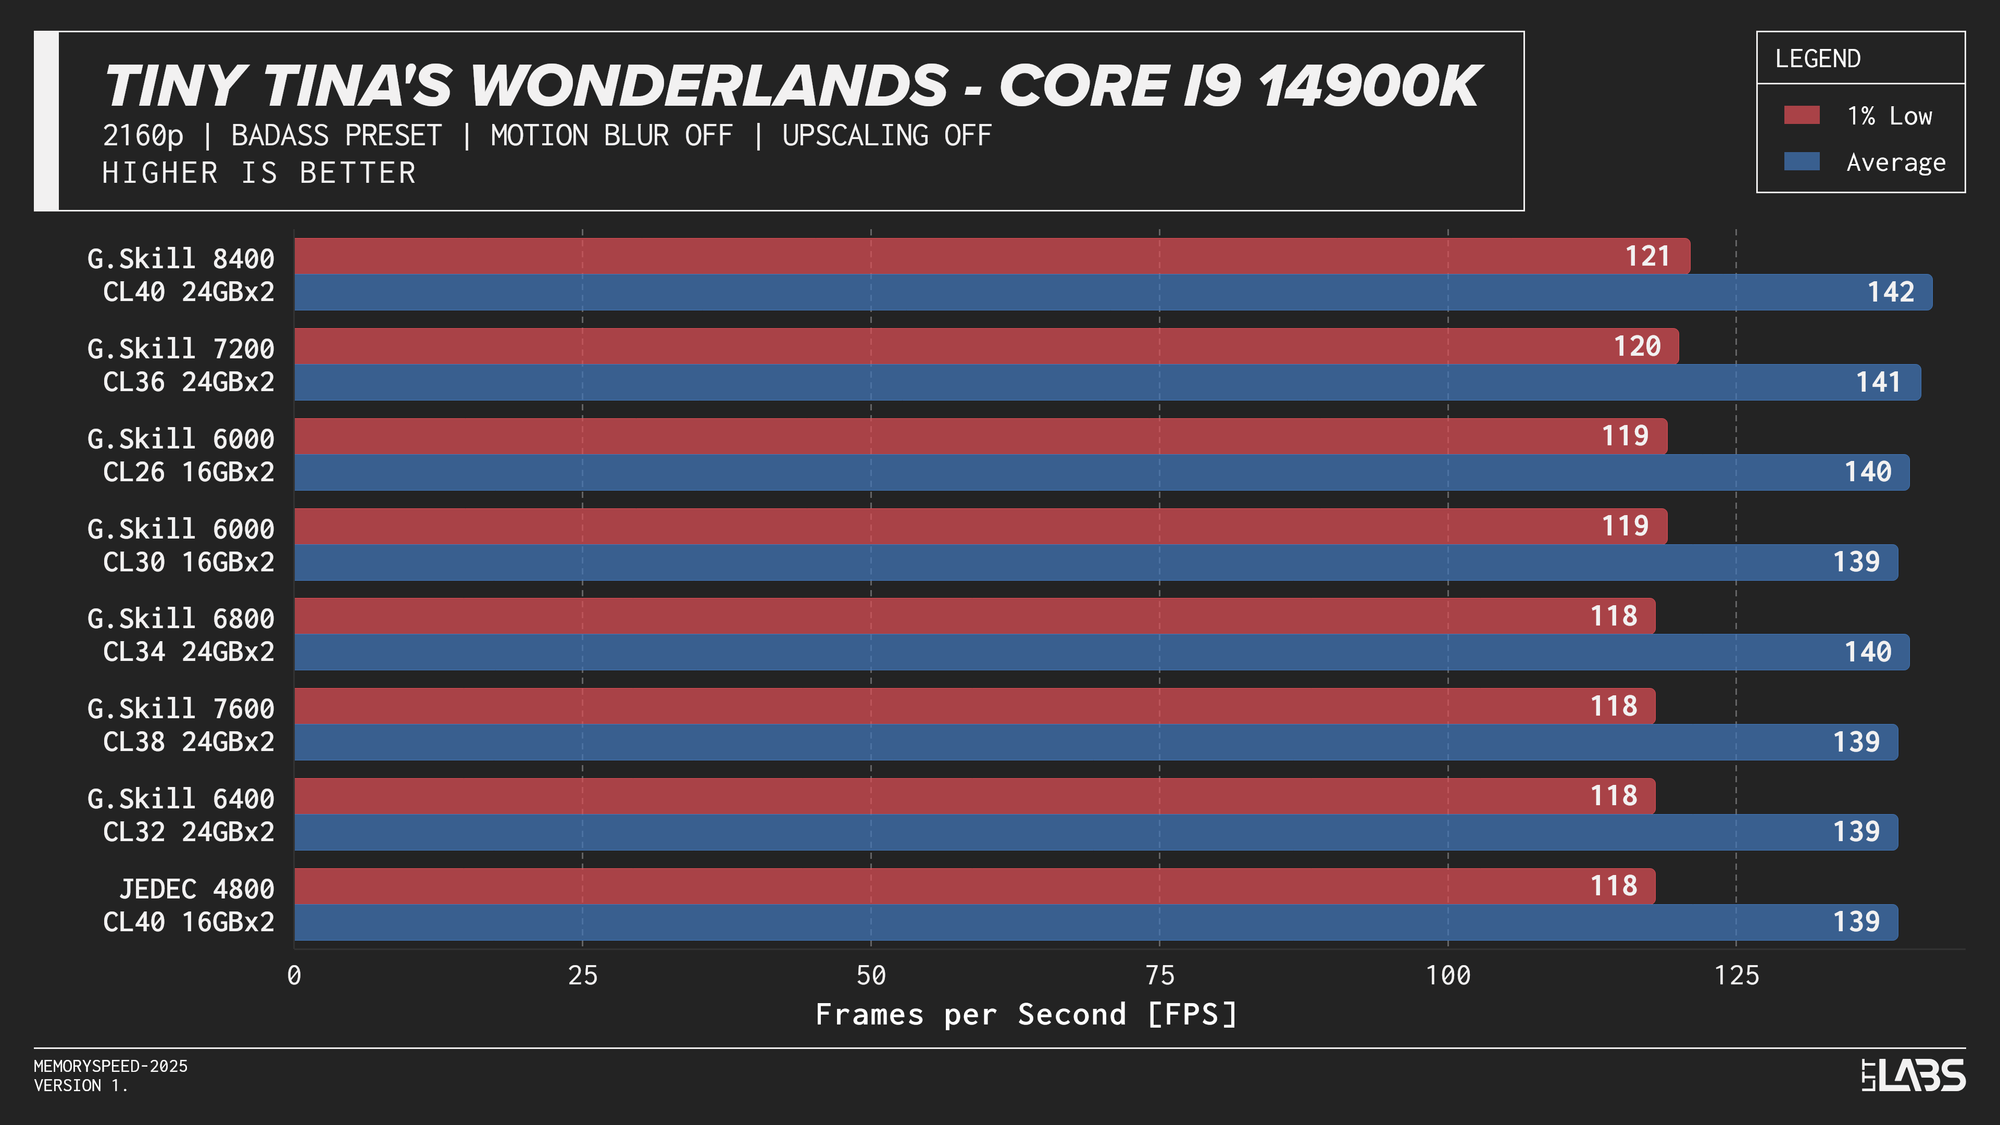
Core i9-14900K 2160p
Core Ultra 9 285K
Core Ultra 9 285K 2160p
Ryzen 7 9800X3D
Ryzen 7 9800X3D 2160p
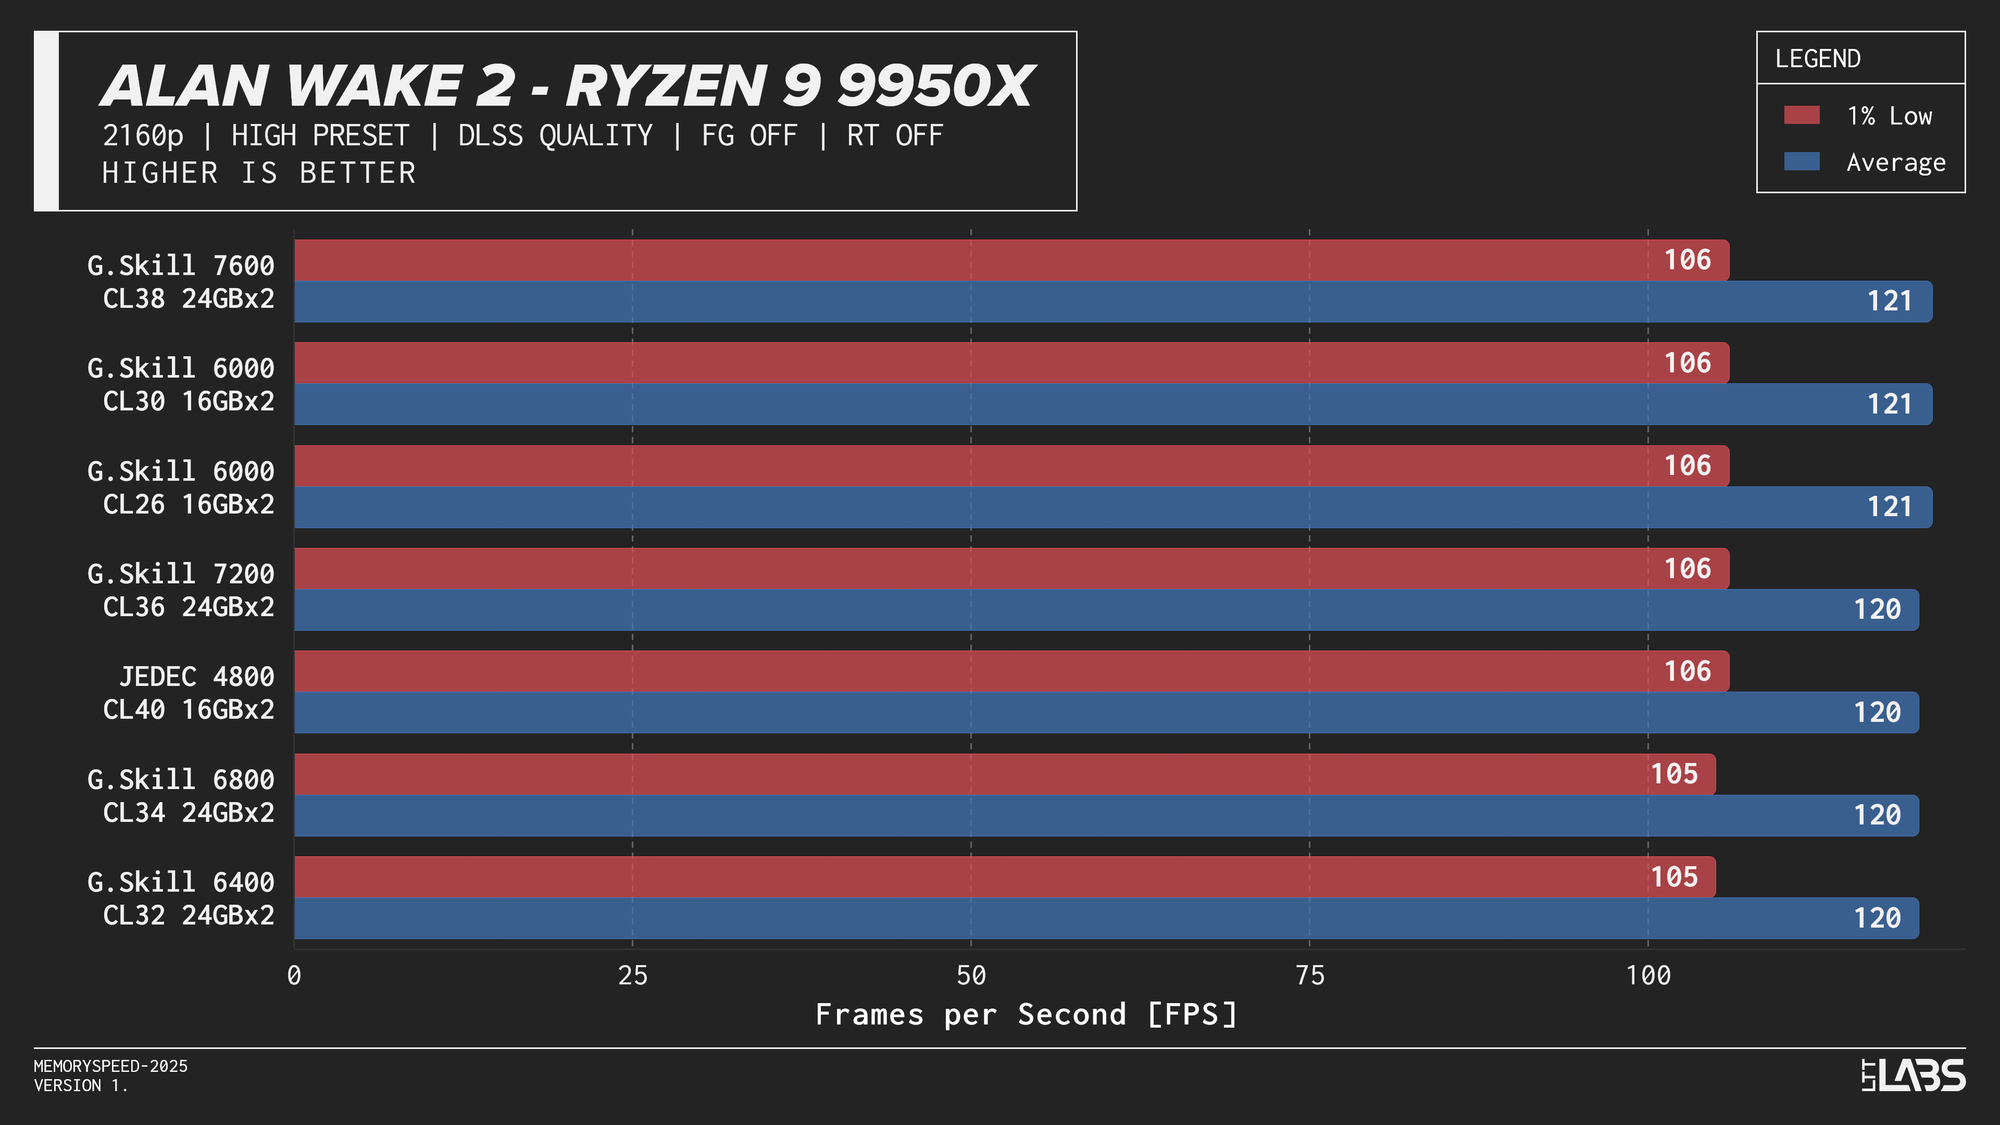
Ryzen 9 9950X
Ryzen 9 9950X 2160p
The performance was effectively identical across memory configurations and largely clumped together across CPUs. With the GPU acting as the primary bottleneck, frame rates were determined almost entirely by graphics performance, leaving little opportunity for system memory or CPU differences to influence results. The Core i9-14900K, Ryzen 9 9950X, and Ryzen 7 9800X3D all delivered nearly indistinguishable performance across the test suite regardless of memory speed. The Core Ultra 9 285K trailed slightly behind the group, but memory scaling remained flat here as well. Overall, the results reinforce that in a heavily GPU-bound scenario like 4K gaming, system memory speed, and to a large extent even CPU choice, has minimal impact on real-world performance once a reasonable baseline is met.
RT
Ray tracing shifts a larger portion of the workload to the GPU, where complex lighting calculations, BVH (Bound Volume Hierarchy) traversal, and shader execution dominate frame time. Because the GPU spends significantly longer rendering each frame, the CPU has fewer opportunities to influence performance. In this scenario, system memory speed is expected to have minimal impact, similar to high-resolution rasterized gaming.
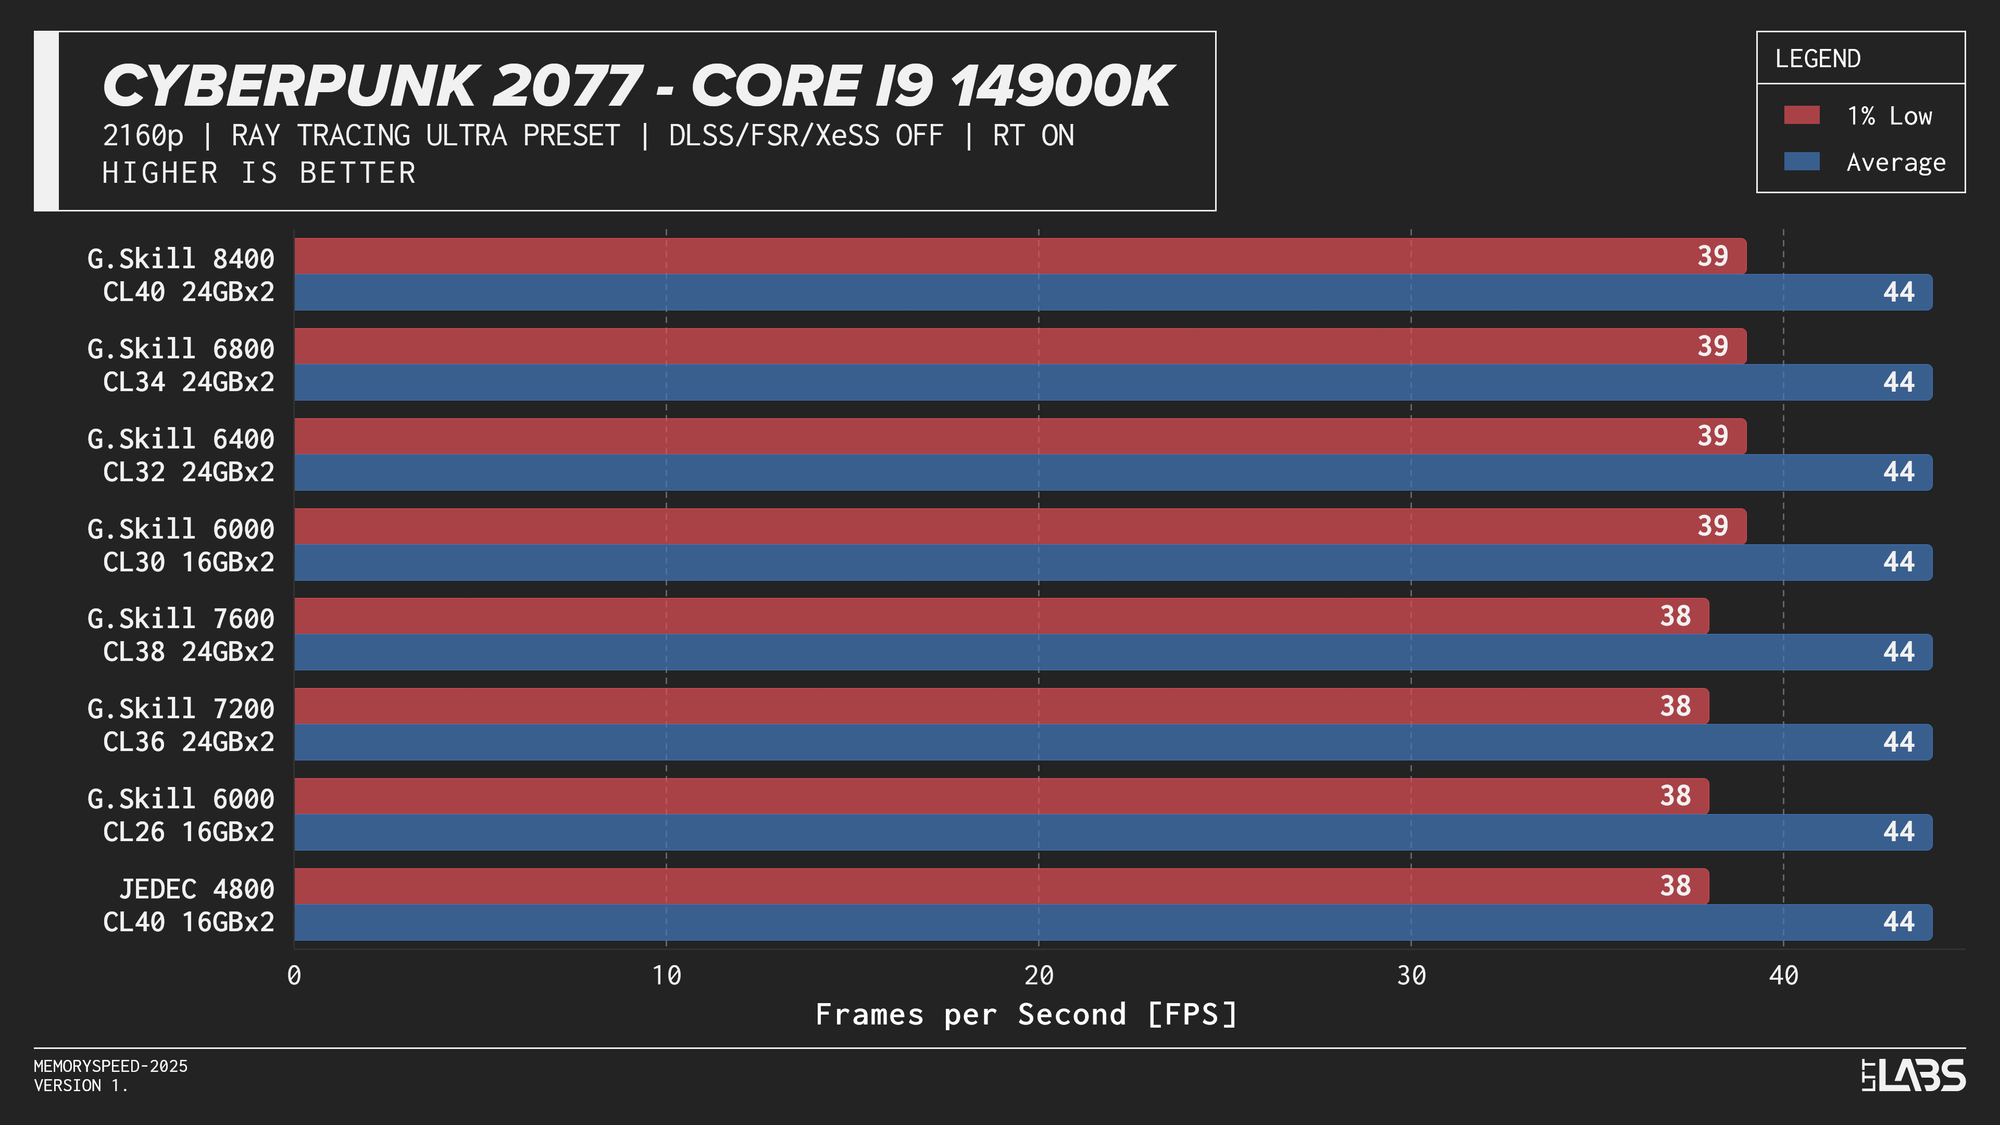
Core i9-14900K
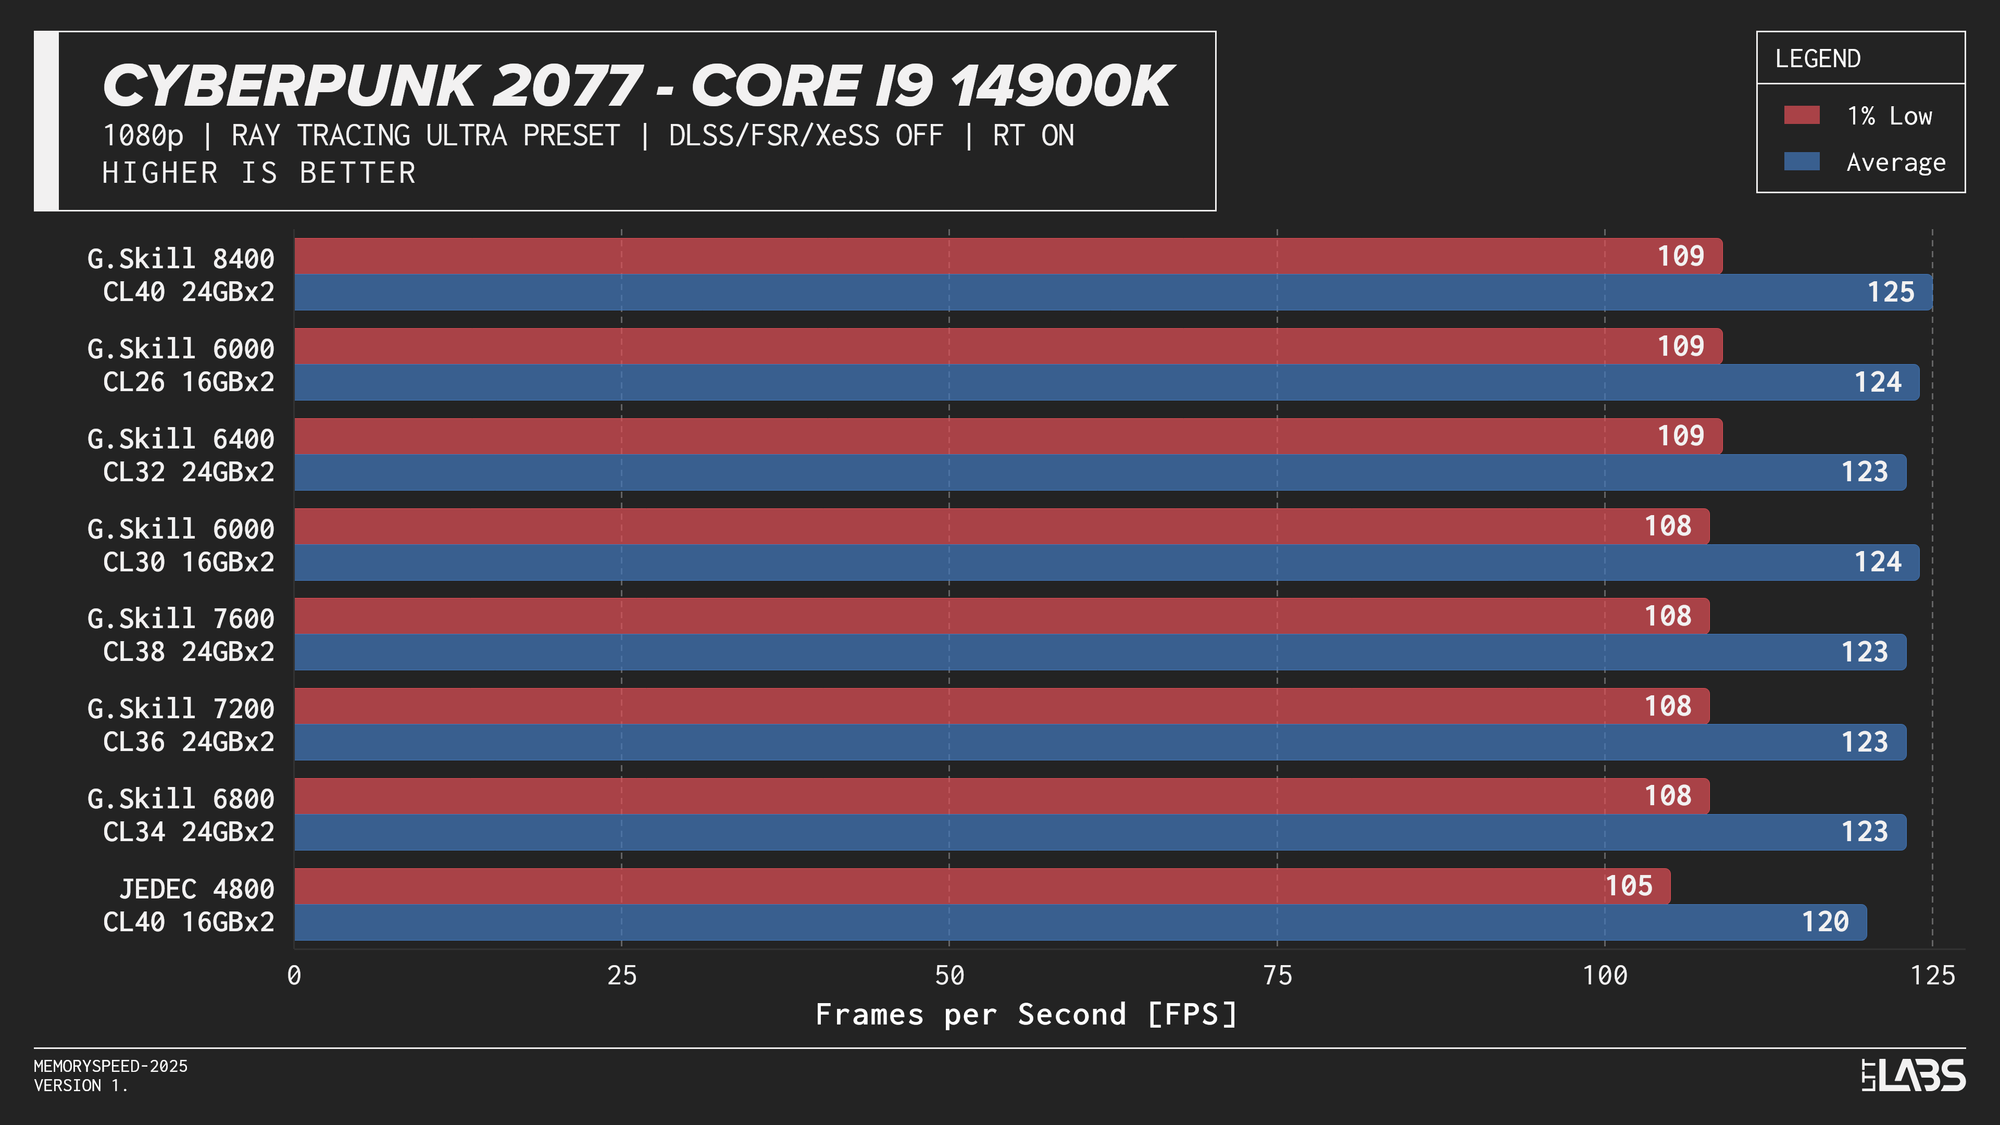
Core i9-14900K Cyberpunk 2077 Ray Tracing
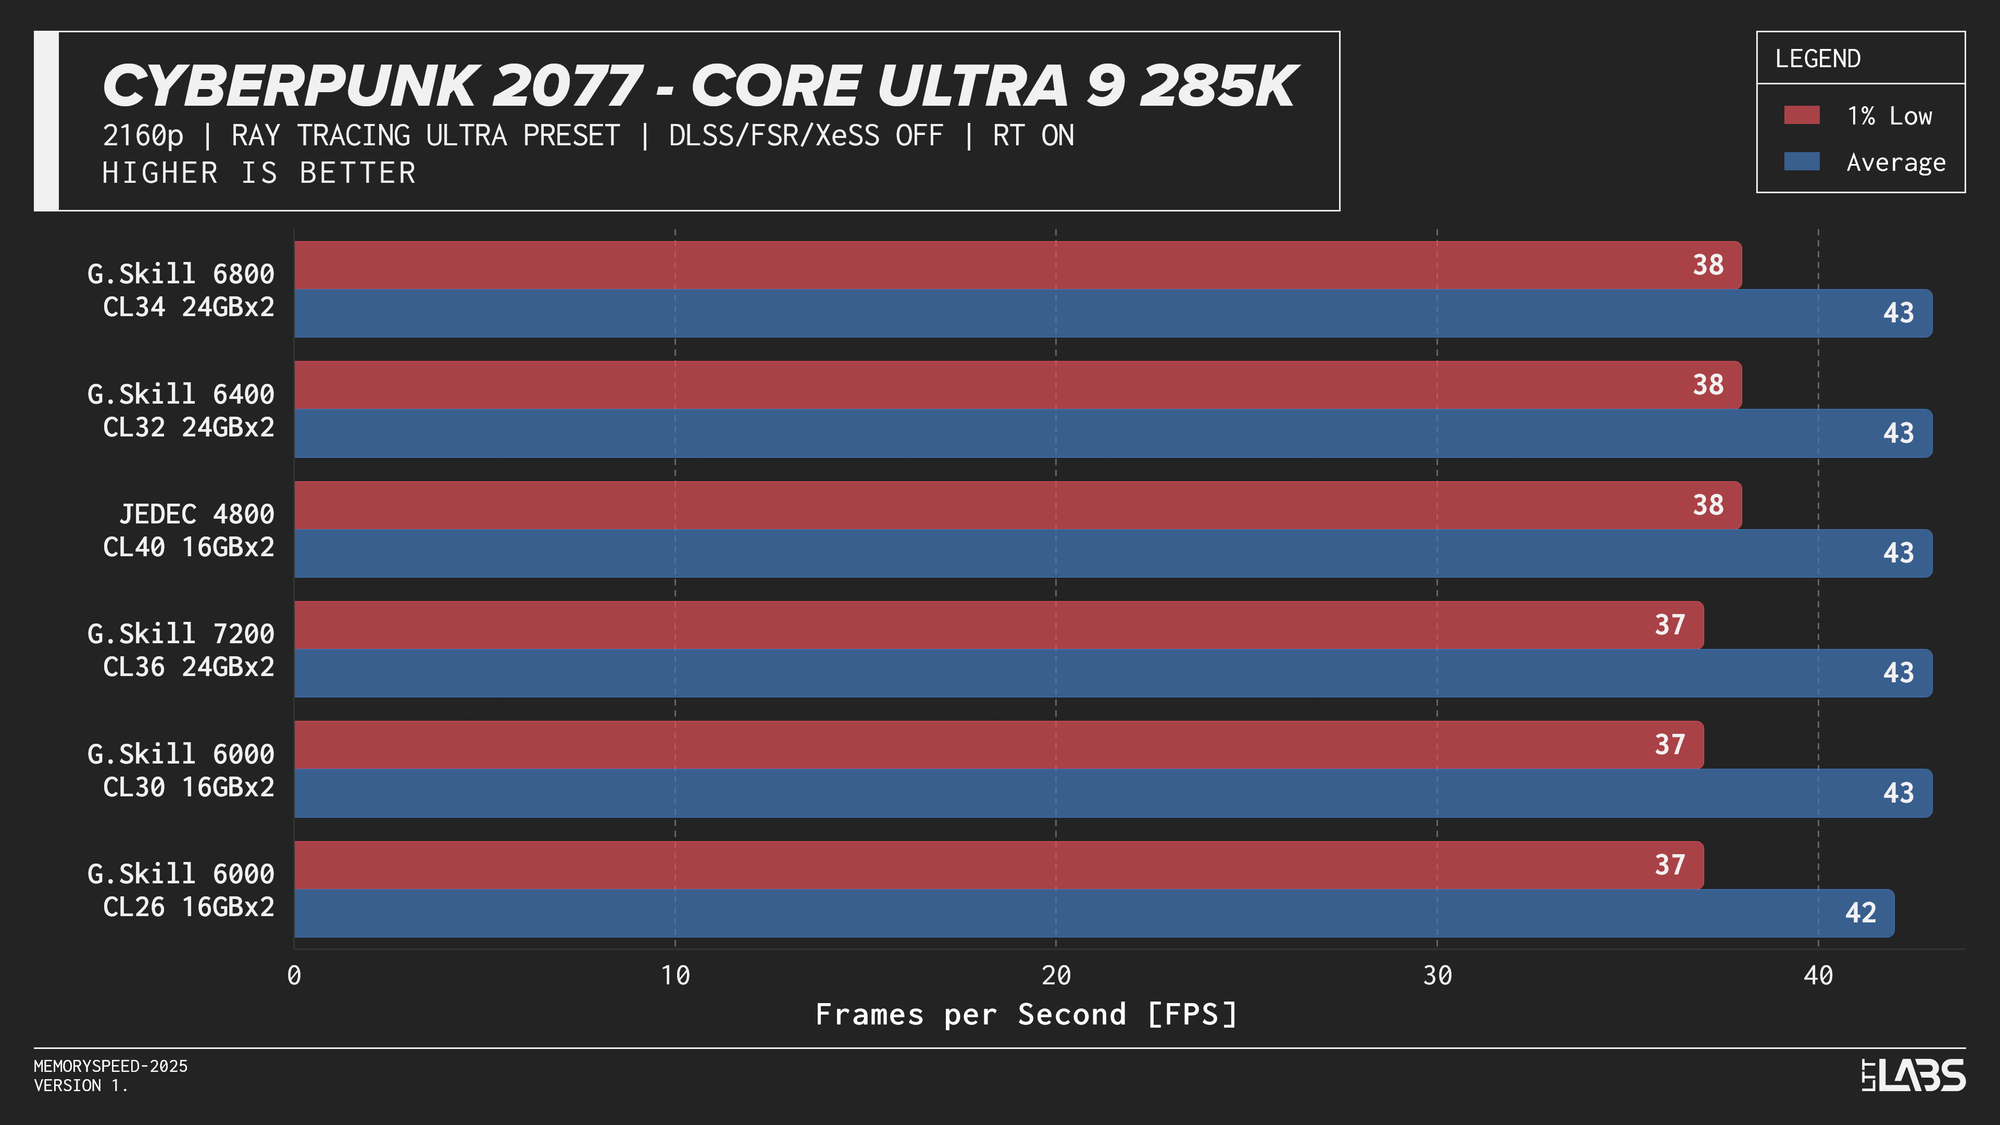
Core Ultra 9 285K
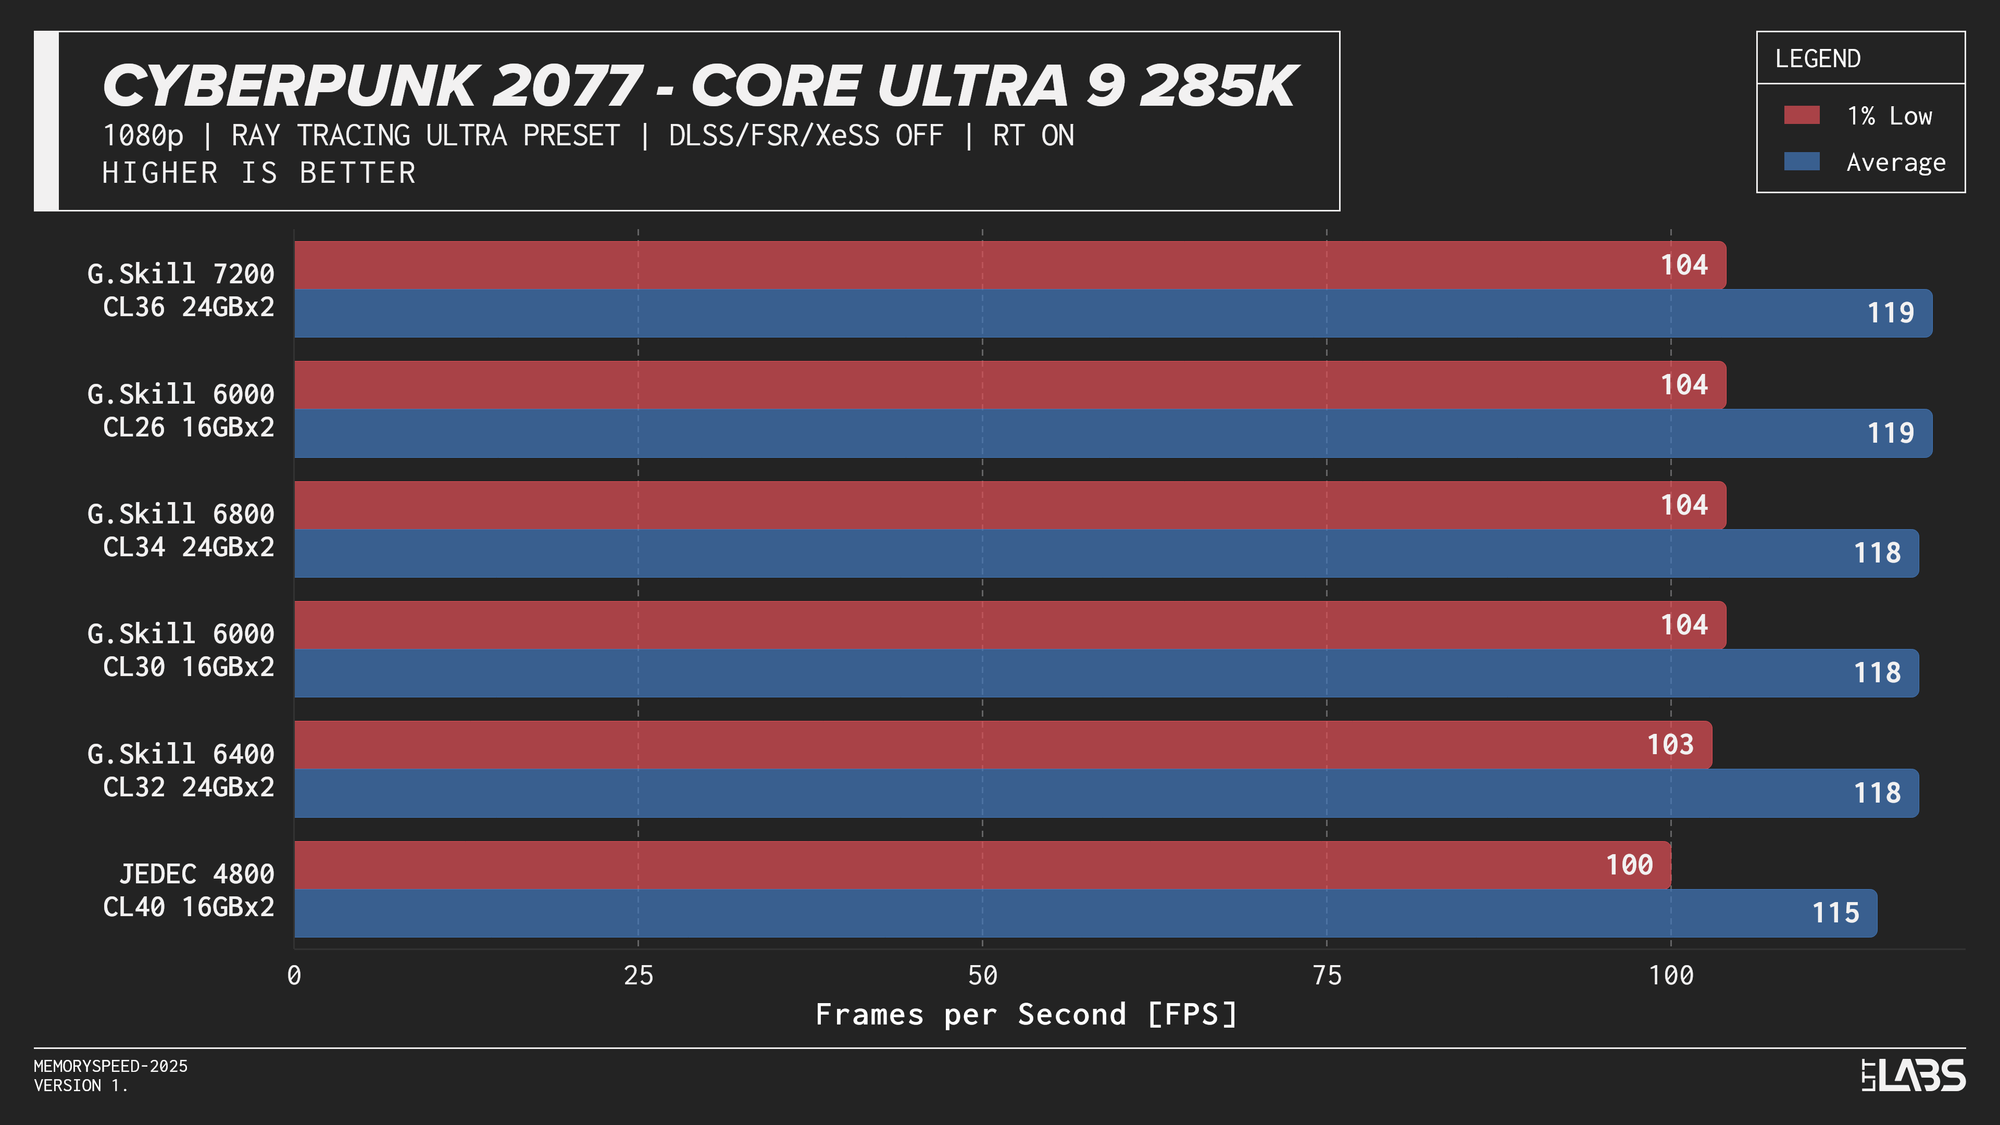
Core Ultra 9 285K Cyberpunk 2077 Ray Tracing
Ryzen 7 9800X3D
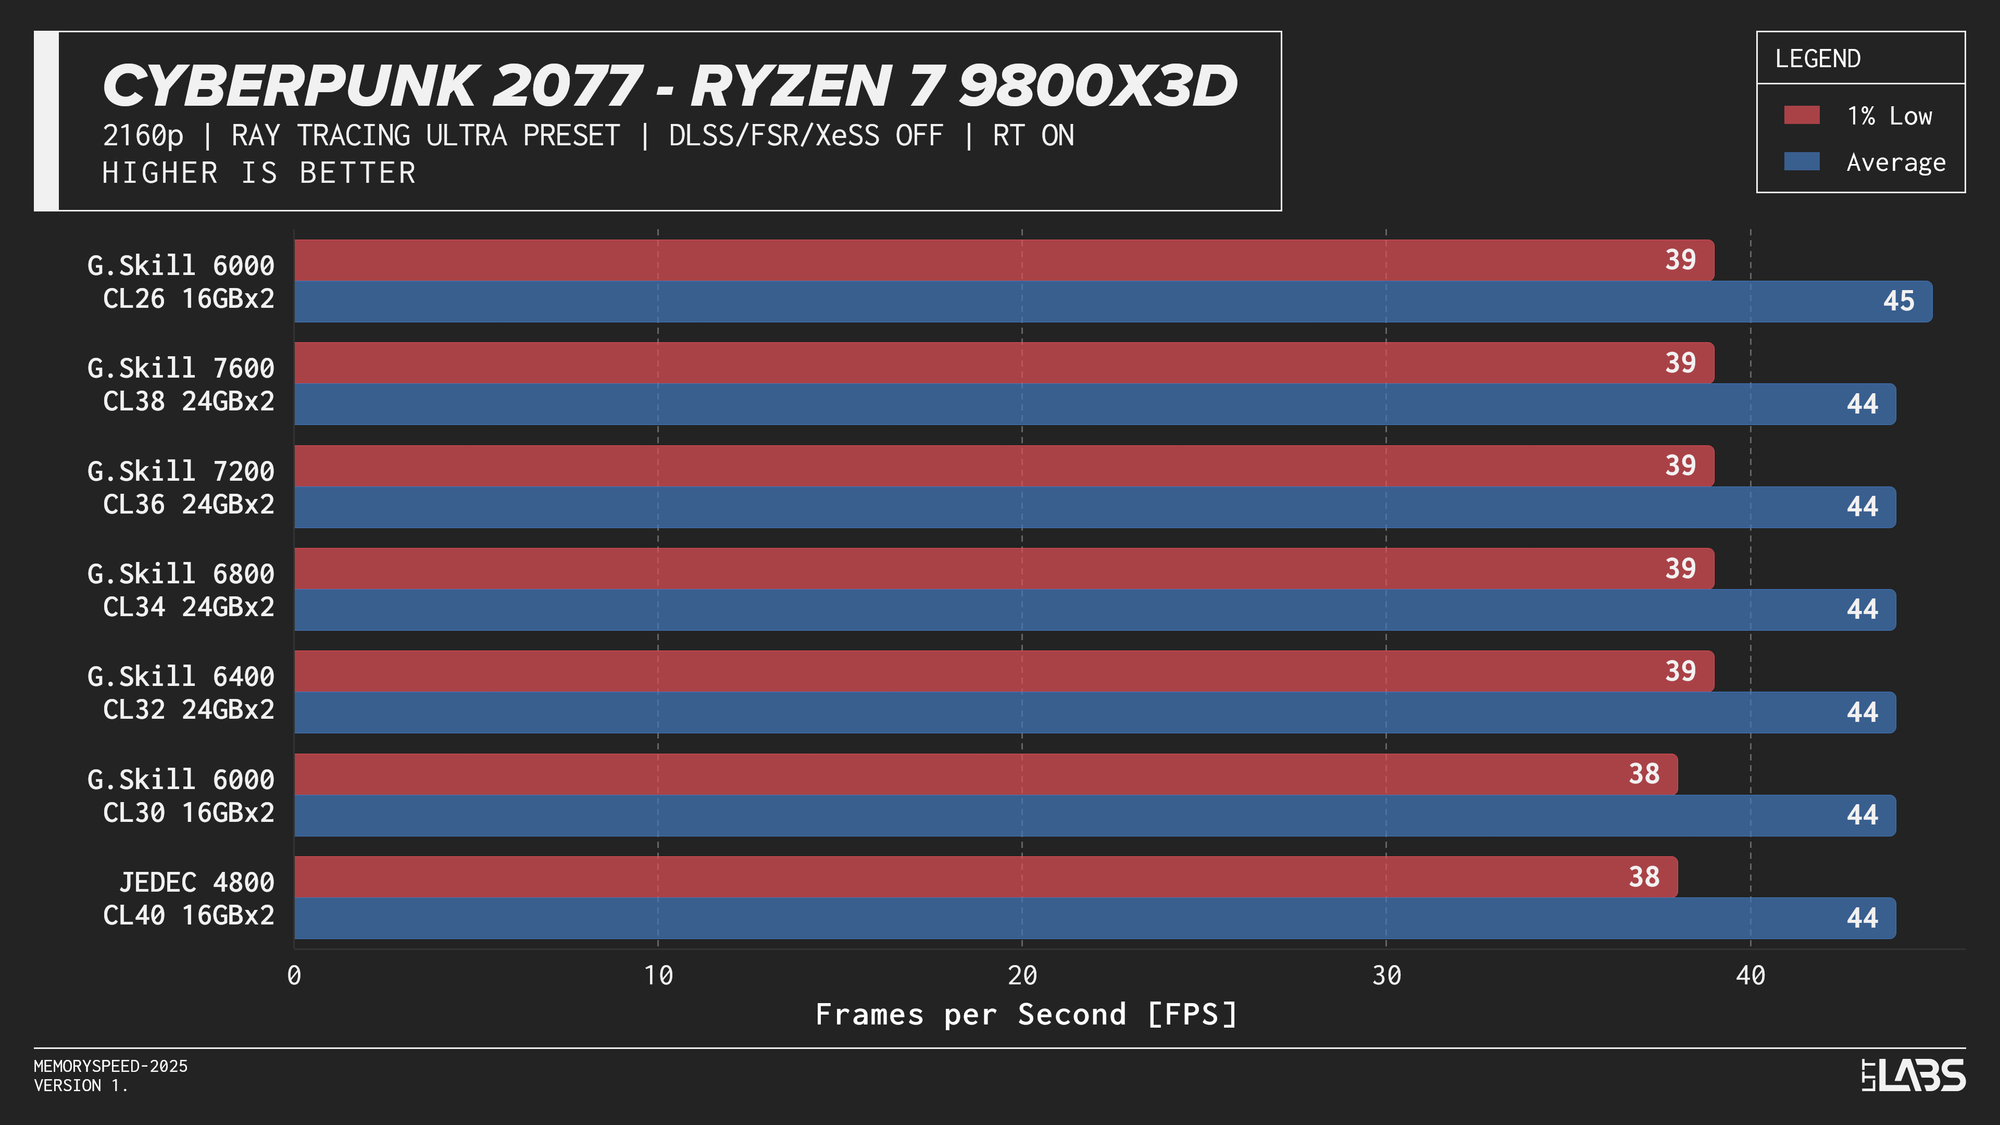
Ryzen 7 9800X3D Cyberpunk 2077 Ray Tracing
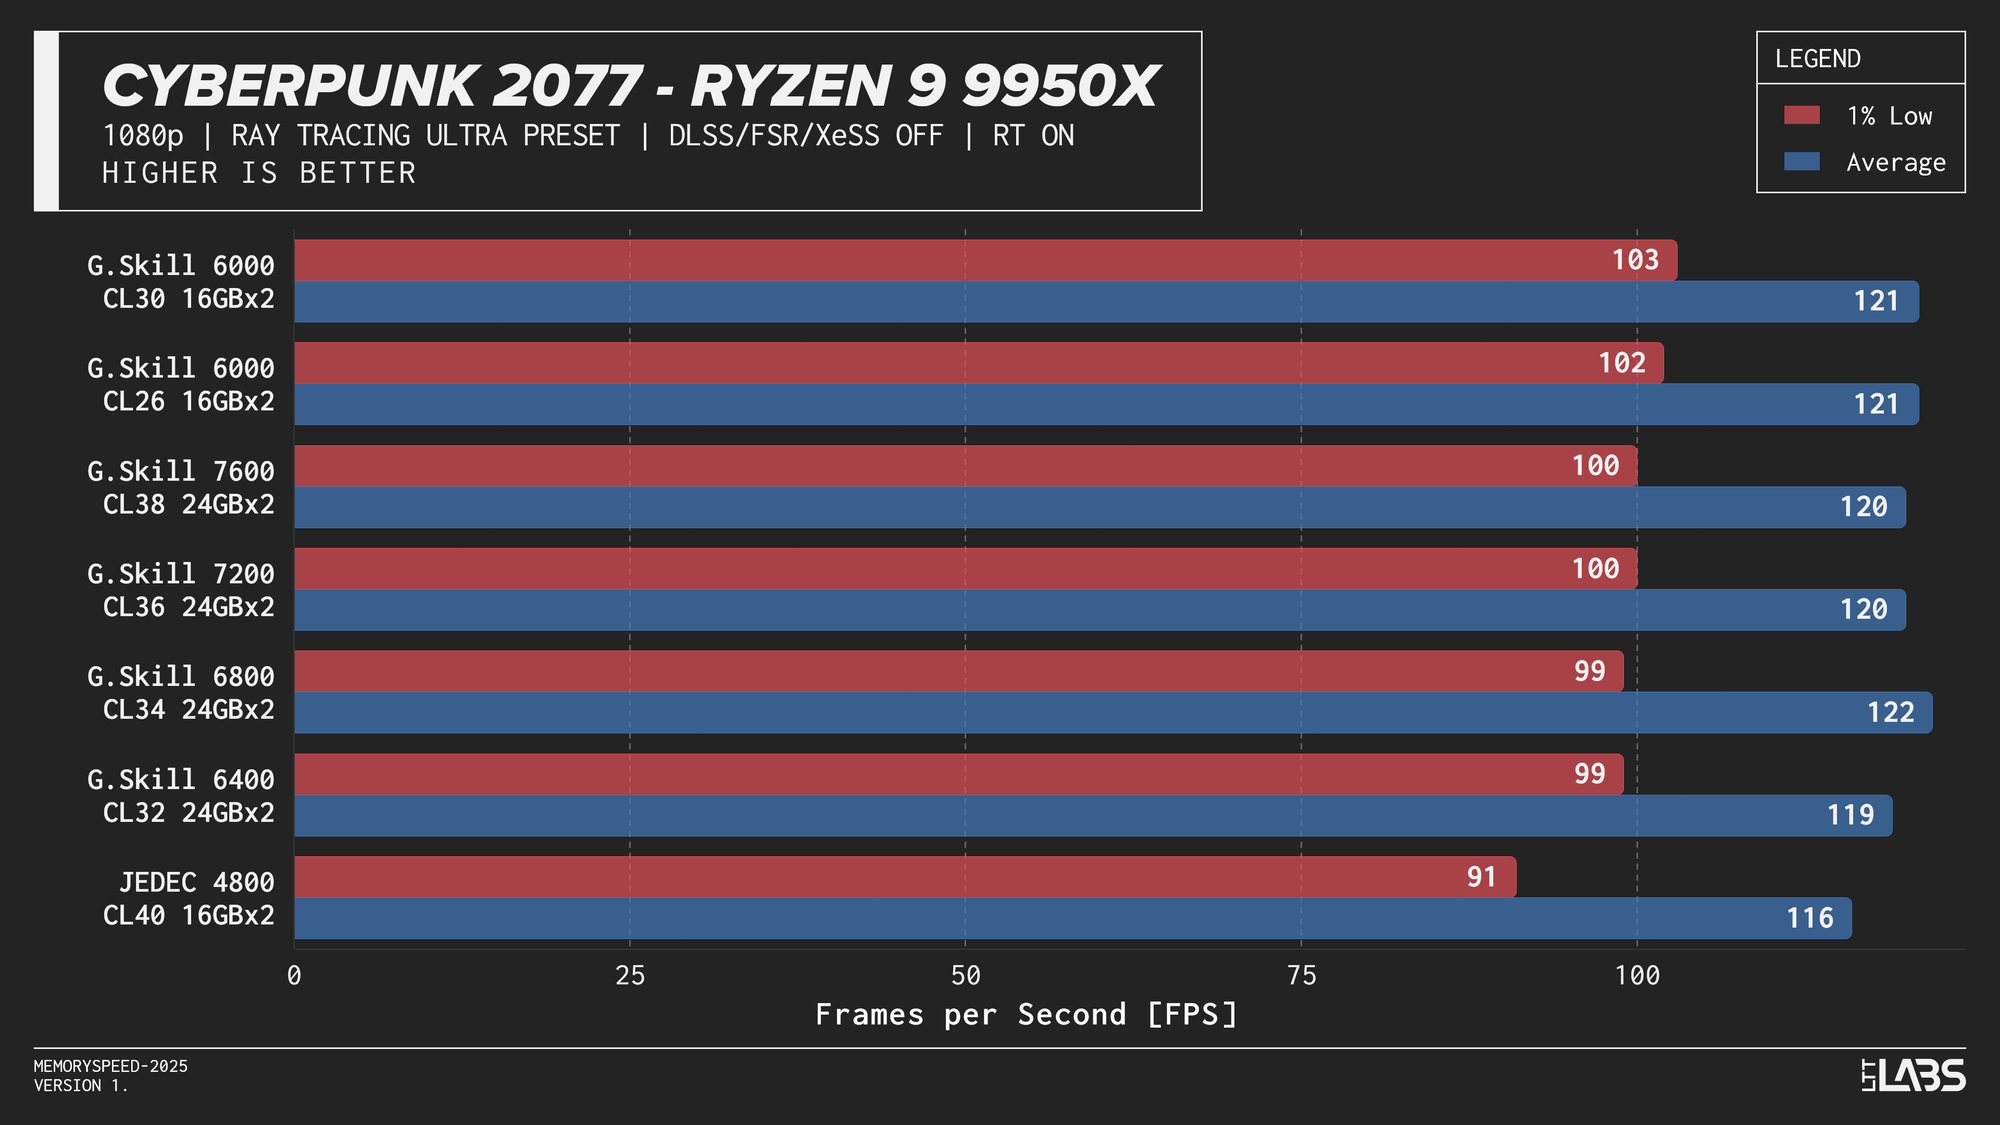
Ryzen 9 9950X
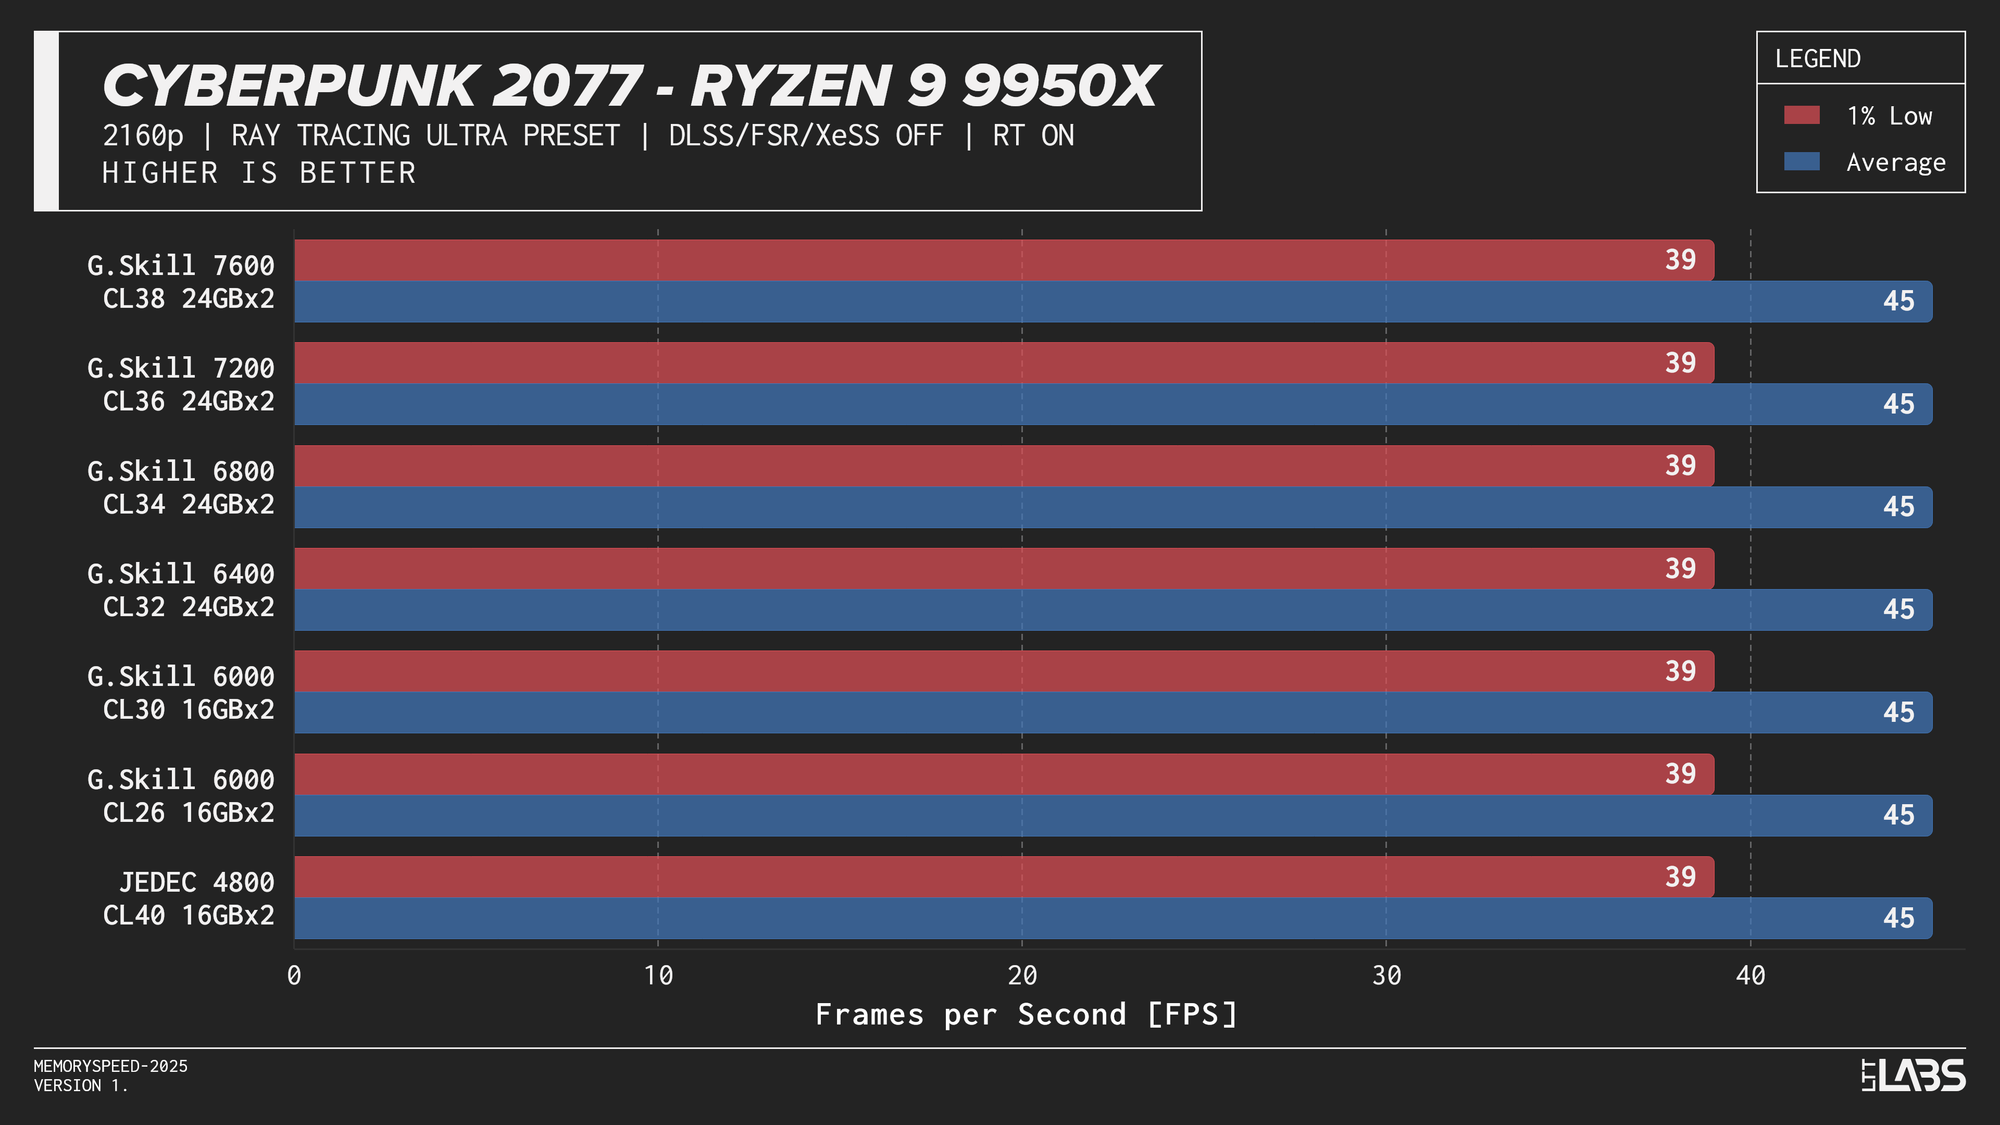
Ryzen 9 9950X Cyberpunk 2077 Ray Tracing
The Ryzen 9 9950X, Core i9-14900K, and Core Ultra 9 285K showed slight separation between JEDEC and tuned memory in 1080p, but higher-speed kits did not provide significant gains beyond the 6000–6800 MT/s range. The 9800X3D showed even less sensitivity, delivering effectively identical results across all tested configurations. For 4k, there were no meaningful gains across the board as the workloads are even more GPU-bound.
DLSS (Quality)
Cyberpunk 2077, Alan Wake 2, and Black Myth: Wukong were evaluated at 4K using DLSS Quality, which renders internally at 1440p before upscaling. As upscaling technologies become more widely used, the effective internal resolution becomes the more relevant performance factor. Lower internal resolutions increase frame rates and can shift the system back toward a CPU-limited scenario, where memory latency and bandwidth may have a greater opportunity to influence performance. In theory, this creates more opportunity for system memory latency and bandwidth to influence performance compared to native 4K.
Core i9-14900K
Core i9-14900K DLSS
Core Ultra 9 285K
Core Ultra 9 285K DLSS
Ryzen 7 9800X3D
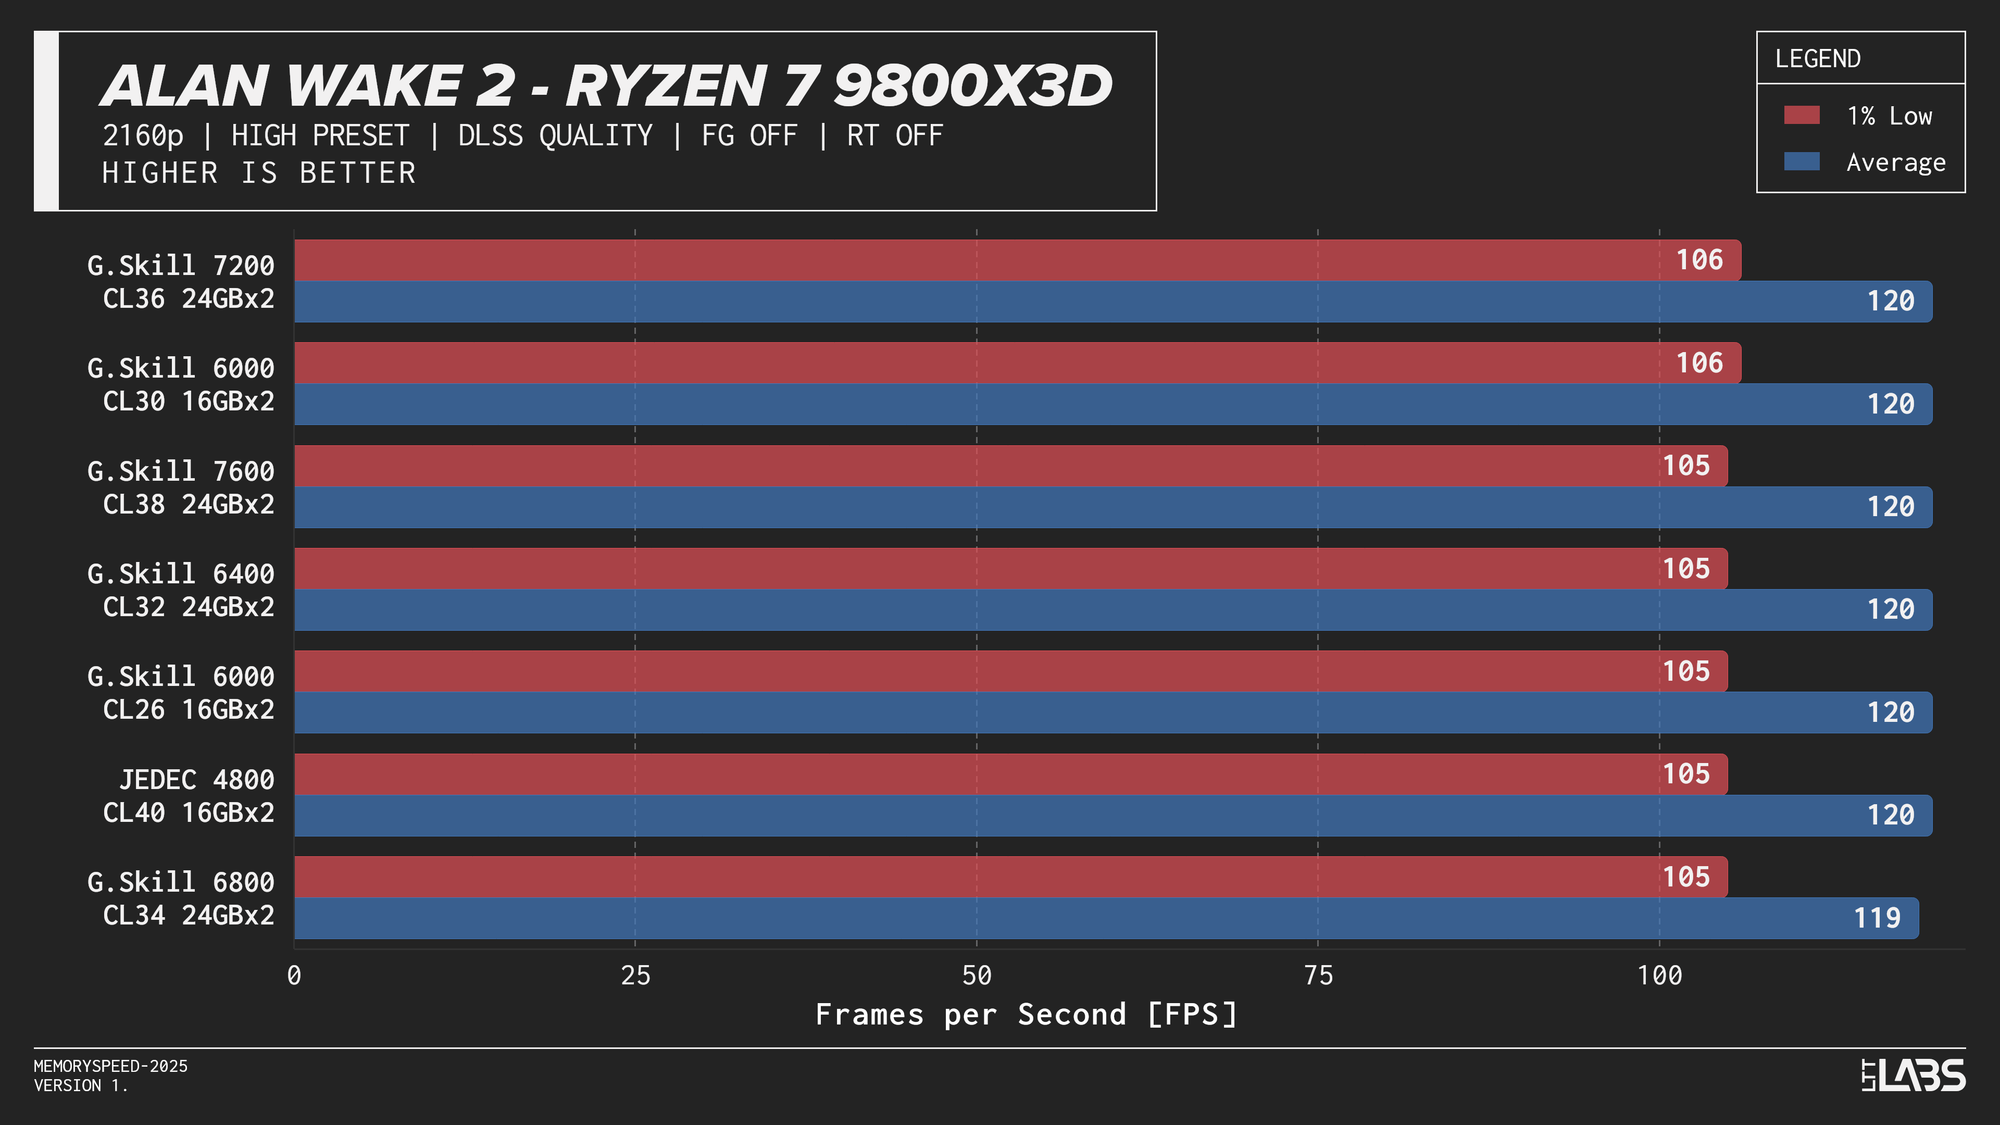
Ryzen 7 9800X3D DLSS
Ryzen 9 9950X
Ryzen 9 9950X DLSS
In practice, the results here showed that upscaling from 1440p to 4K will not benefit from any faster memory speeds. Any slight FPS change between the kits can be attributed to testing variance. Much like 4K, we're still fairly GPU-bound here.
While DLSS Quality today still behaves closer to a GPU-bound scenario, this balance could shift over time. As upscaling technologies improve (DLSS4.5 maybe?) and lower internal resolutions such as 1080p to 4K become more viable for high-quality output, frame rates could increase enough to expose CPU and memory limitations more frequently. If that happens, memory latency and bandwidth may play a larger role than they do in current DLSS workloads.
Who is faster DDR5 memory for then?
Across all platforms, most workloads see their largest performance gains when moving beyond JEDEC-standard memory speeds. However, once memory speeds reach roughly 6000–6800 MT/s, we reach diminishing returns quickly, with higher data rates providing less additional benefit in most gaming and productivity workloads. In some games JEDEC isn't even last. In our testing, the 32 GB (2×16 GB) DDR5‑6000 CL30 configuration struck the optimal balance for AM5, providing near-maximum real-world performance, while CL26 offered only occasional incremental gains. Intel platforms showed incremental scaling up to around 48GB (2×24GB) DDR5-6800 CL34, with little added benefit beyond that in most cases. The 8400 MT/s kit is the only exception with a significant improvement in many workloads but there are some caveats.
High-speed memory is most relevant for professionals and power users running workloads that regularly operate on {{tooltip: In this context, “large” means the actively used data exceeds the CPU’s last-level cache (typically tens to hundreds of megabytes). Once data spills beyond cache, the workload becomes more dependent on system memory speed.}}large{{/tooltip}} datasets beyond CPU cache. This includes software developers working on large codebases with frequent full rebuilds, engineers and researchers performing numerical simulations or scientific computing, data professionals handling large in-memory datasets, and users doing heavy compression, or virtualisation workloads. Competitive eSports players targeting very high frame rates on latency-sensitive titles may also see small gains on certain platforms. Outside of these scenarios, including most gaming, content creation, and general productivity, the performance difference between mid-range and high-end DDR5 speeds is typically too small to justify the added cost.
Faster memory is unlikely to offer significant future-proofing. RAM speed will continue to play a supporting role, with its influence on performance remaining limited. Future technologies may benefit from faster memory, but for now, most performance gains stem from new CPU architectures, larger caches such as those in X3D chips, or broader platform improvements. If long-term flexibility is a concern, prioritizing memory capacity or even a CPU or GPU upgrade will be more impactful than purchasing the highest available memory speed.
Faster kits provide some performance gains, but in today’s market, their escalating cost quickly calls their value into question. Demand from AI infrastructure has pushed DRAM pricing well beyond historical norms, not because data centres are buying desktop memory directly, but because they are utilizing the same underlying DRAM manufacturing capacity. Since AI deployments compete for the same silicon supply, reduced availability affects the entire market, including consumer UDIMMs. Most of this pressure is concentrated on conventional UDIMMs, but CUDIMM kits are also being affected.
In conclusion, we have beaten our own record for most number of graphs in an article and DDR5 speed is less of a performance lever and more of a system balance decision these days. For most consumers, avoiding JEDEC and prioritizing memory capacity and stability or a CPU architecture upgrade will deliver far more value than chasing the highest advertised memory speed.